
Members were advised after Thursday’s session to enter long positions with stops just below the last gap at 2,460.31. Positions should now be profitable and profits may be taken or stops moved up to breakeven.
Summary: Upwards movement may be over at Friday’s high. However, the S&P often forms slow rounded tops that do not conform well to expectations with its trend channels. It is possible price may limp a little higher to start next week, and still possible it may make a new all time high before turning.
A downwards swing to support is expected to begin next week.
Last monthly and weekly charts are here. Last historic analysis video is here.
ELLIOTT WAVE COUNT
WEEKLY CHART
Click chart to enlarge.
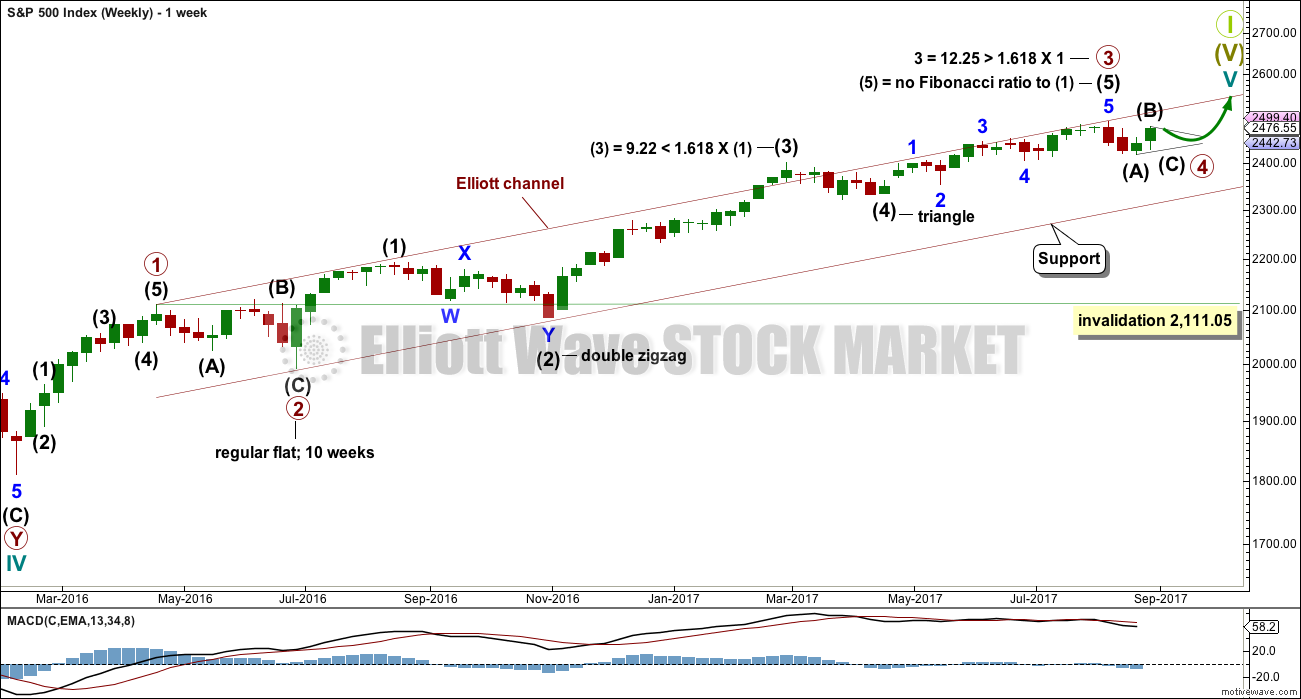
Primary wave 3 now looks complete. Further and substantial confidence may be had if price makes a new low below 2,405.70, which is the start of minor wave 5 within intermediate wave (5). A new low below 2,405.70 may not be a second wave correction within an extending fifth wave, so at that stage the final fifth wave must be over. Fibonacci ratios are calculated at primary and intermediate degree. If primary wave 3 is complete, then it still exhibits the most common Fibonacci ratio to primary wave 1.
Primary wave 4 may not move into primary wave 1 price territory below 2,111.05.
Primary wave 4 should last about 8 weeks minimum for it to have reasonable proportion with primary wave 2. It is the proportion between corrective waves which give a wave count the right look. Primary wave 4 may last 13 or even 21 weeks if it is a triangle or combination. So far it may have just completed its third week.
If primary wave 4 unfolds as a single or double zigzag, then it may find support about the lower edge of the maroon Elliott channel. If it is a triangle or combination, it may be more shallow, ending about mid way within the channel.
At this stage, the analysis gets complicated because there are several possible structures that primary wave 4 may be. The ideas for a triangle, combination, double zigzag, and single zigzag will be separated out into different daily charts in order for members to have a clearer picture of how price may behave for each. It is still impossible for me to tell you with any level of confidence which structure primary wave 4 may take, so all possibilities must be considered. I can only say that a single or double zigzag, or a triangle, would be most likely to exhibit good alternation with the flat correction of primary wave 2.
The final target for Grand Super Cycle wave I to end is at 2,500 where cycle wave V would reach equality in length with cycle wave I. If price reaches the target at 2,500 and either the structure is incomplete or price keeps rising, then the next target would be the next Fibonacci ratio in the sequence between cycle waves I and V. At 2,926 cycle wave V would reach 1.618 the length of cycle wave I.
DAILY CHART – TRIANGLE
Click chart to enlarge.
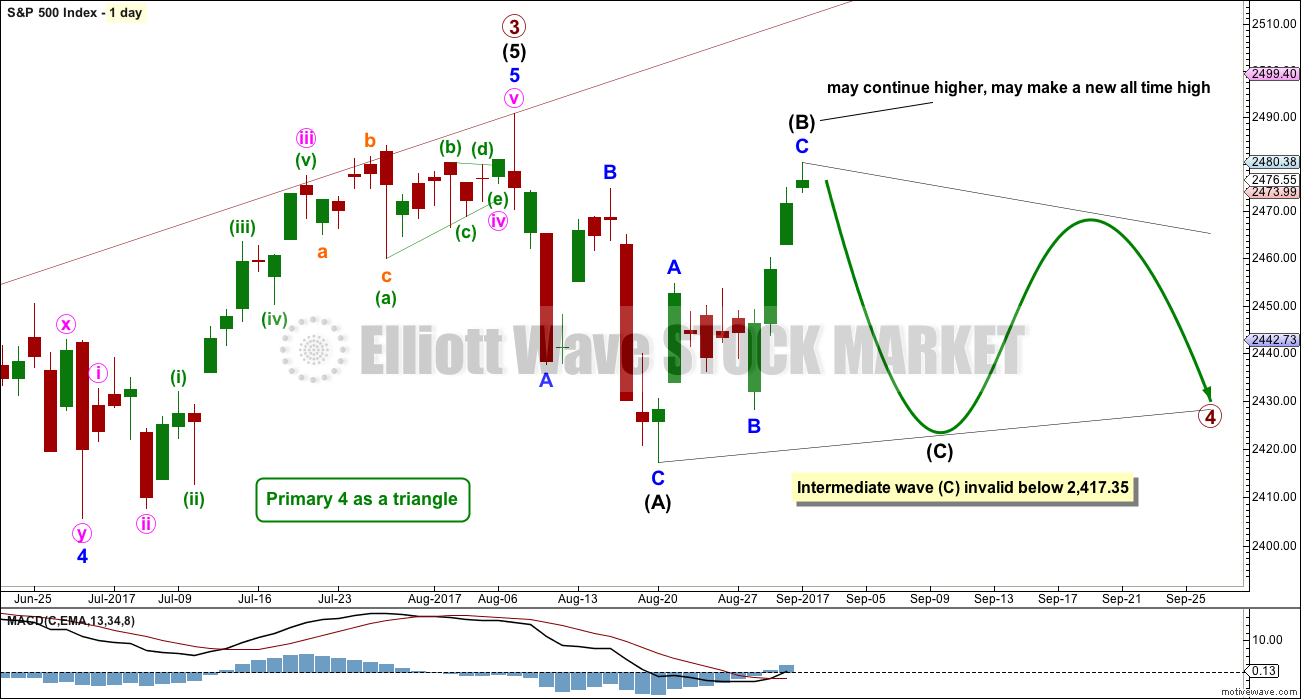
This first daily chart will illustrate how price might move if primary wave 4 unfolds as a triangle.
Intermediate wave (A) of a larger triangle may possibly be complete, lasting only two weeks. The triangle may still last a total of at least eight weeks, and possibly longer.
Intermediate wave (B) may possibly be complete at Friday’s high. If it is complete there’ then it would be a 0.86 length of intermediate wave (A), which is very close to the common range for triangle subwaves of about 0.8 to 0.85.
Both intermediate waves (A) and (B) look like three wave structures.
It is also possible that intermediate wave (B) may yet continue higher, and may make a new all time high as in a running triangle. While there is a breach of the channel on the hourly chart at the end of Friday’s session, it is small and the channel does not have good technical significance. Price may turn back up to hug the lower edge of that channel. A clearer breach is needed, and preferably a five down at the hourly chart level to have confidence that intermediate wave (B) is over.
One of the five sub-waves of a triangle should be a more complicated double zigzag, which is usually wave C. Intermediate wave (C) may be more complicated and time consuming than either of intermediate waves (A) or (B). Intermediate wave (C) may not move beyond the end of intermediate wave (A).
DAILY CHART – COMBINATION
Click chart to enlarge.
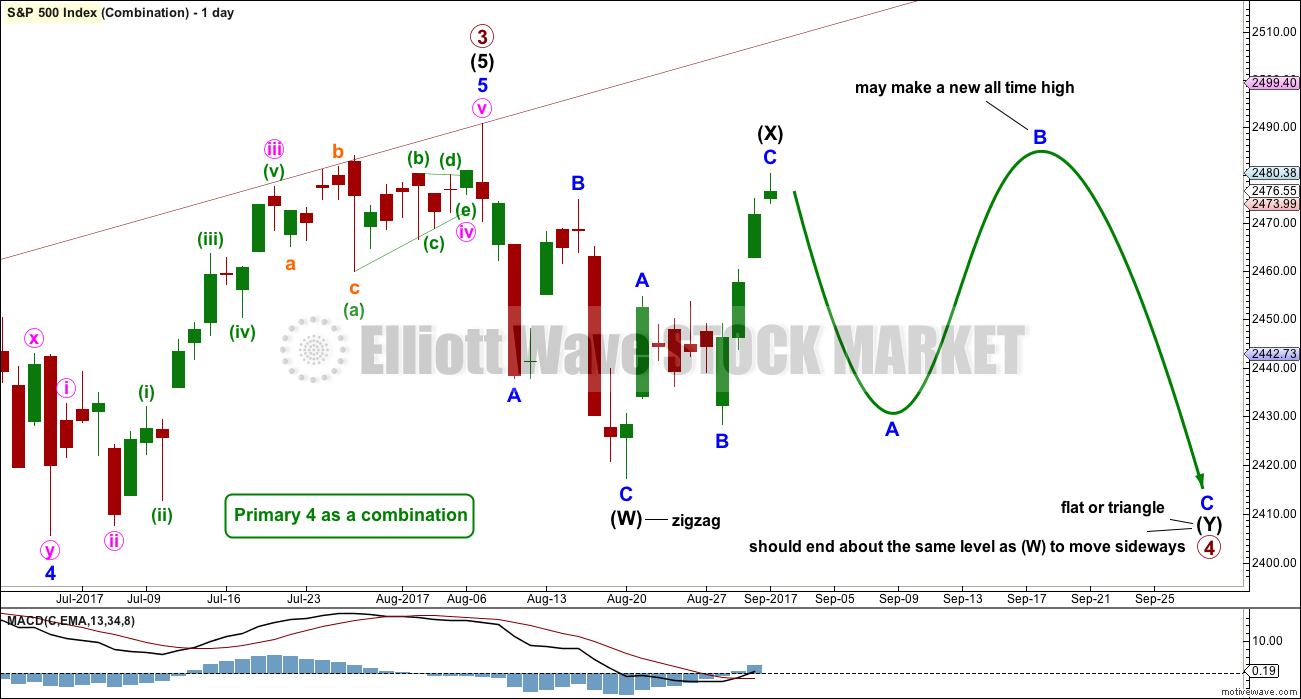
A combination for primary wave 4 would still offer some alternation with the regular flat of primary wave 2. Whenever a triangle is considered, always consider a combination alongside it. Very often what looks like a triangle may be unfolding or may even look complete, only for the correction to morph into a combination.
There may only be one zigzag within a combination (otherwise the structure is a double zigzag, which is very different and is considered below). At this stage, that would be intermediate wave (W), which is complete.
Combinations are big sideways movements. To achieve a sideways look their X waves are usually deep (and often also time consuming) and the Y wave ends close to the same level as wave W.
Here, intermediate wave (X) is very deep.
Intermediate wave (Y) may be a flat correction or a triangle. Within intermediate wave (Y), minor wave B may make a new high above the start of minor wave A as in an expanded flat or running triangle; this may include a new all time high. There is no upper invalidation point for a combination.
DAILY CHART – DOUBLE ZIGZAG
Click chart to enlarge.
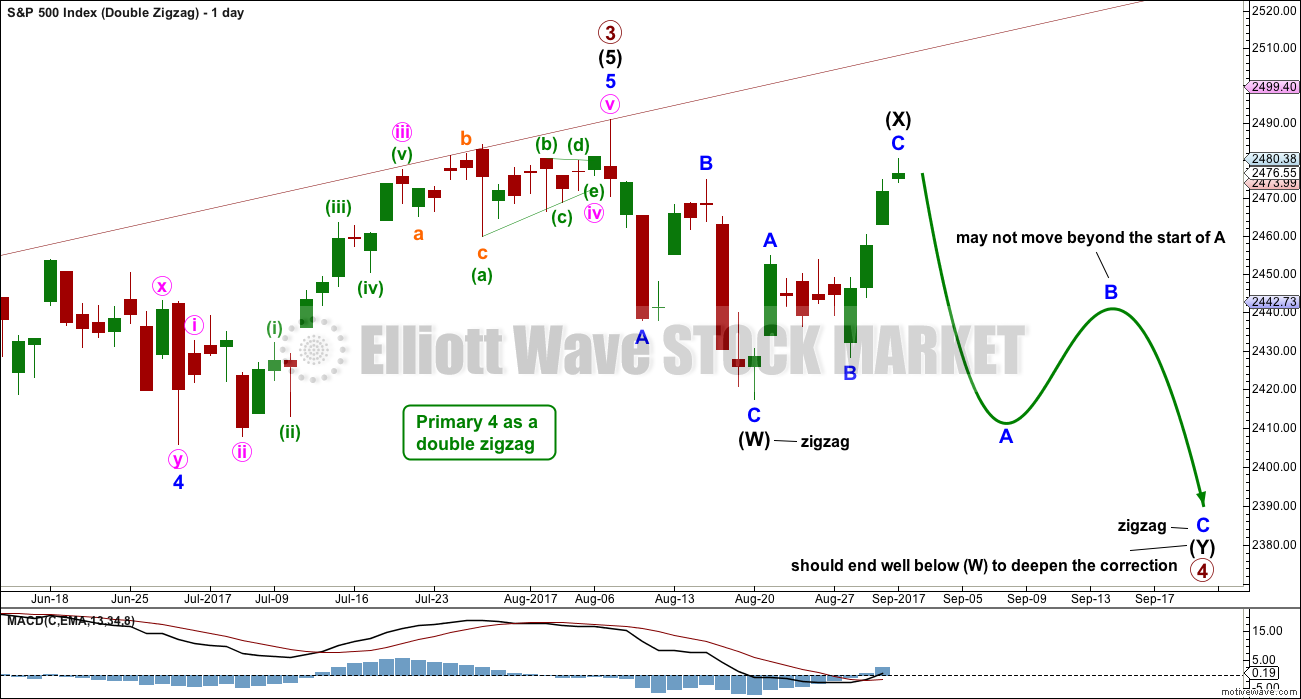
While combinations and double zigzags are both labelled W-X-Y, they are very different structures.
Double zigzags (and very rare triples) belong to the zigzag family of corrections. Combinations are more closely related to flats (these are sideways movements). Double zigzags have a strong slope, as do single zigzags. The second zigzag exists when the first zigzag does not move price deep enough; its purpose is to deepen the correction.
To achieve a strong slope the X waves of double zigzags (and the very rare triple zigzags) are almost always brief and shallow. Here, intermediate wave (X) is neither brief nor shallow reducing the probability of this wave count.
Within the second zigzag, minor wave B may not move beyond the start of minor wave A.
It would still be possible for this wave count for primary wave 4 to end about the lower edge of the maroon channel on the weekly chart.
HOURLY CHART
Click chart to enlarge.
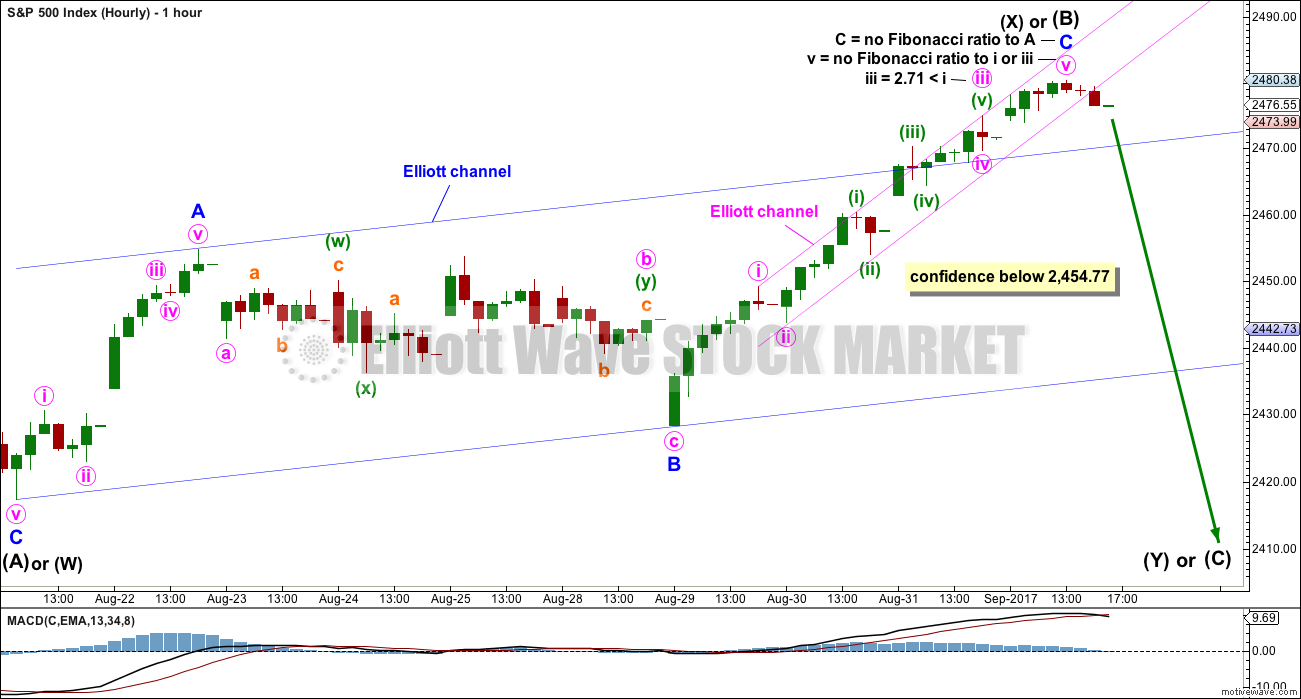
This hourly chart will suffice for all three daily charts above. All three daily charts see the last low as the end of a zigzag, either for intermediate wave (A) or (W). All three daily charts see the last upwards movement as a possibly complete zigzag for intermediate wave (B) or (X).
Attention now turns to the problem of identifying when or if the zigzag of intermediate wave (B) or (X) may be over.
An Elliott channel is drawn about minor wave C. This small channel is breached by downwards movement at the end of Friday’s session, but the breach needs to be clearer and longer lasting for confidence in this breach. The S&P has a tendency to slightly breach channels and then turn back in the old direction as it forms slow rounded tops.
If a five down is very clear on the hourly chart, then reasonable confidence may be had in a trend change.
2,454.77 is the high labelled minor wave A. A new low below this point could not be a fourth wave correction within an impulse unfolding higher, so at that stage it would be confirmed that upwards movement labelled intermediate wave (B) or (X) would be a three and would be complete. This is the price point that would offer strong confidence in a trend change, and also strong confidence that primary wave 4 continues.
ALTERNATE WAVE COUNT
DAILY CHART
Click chart to enlarge.
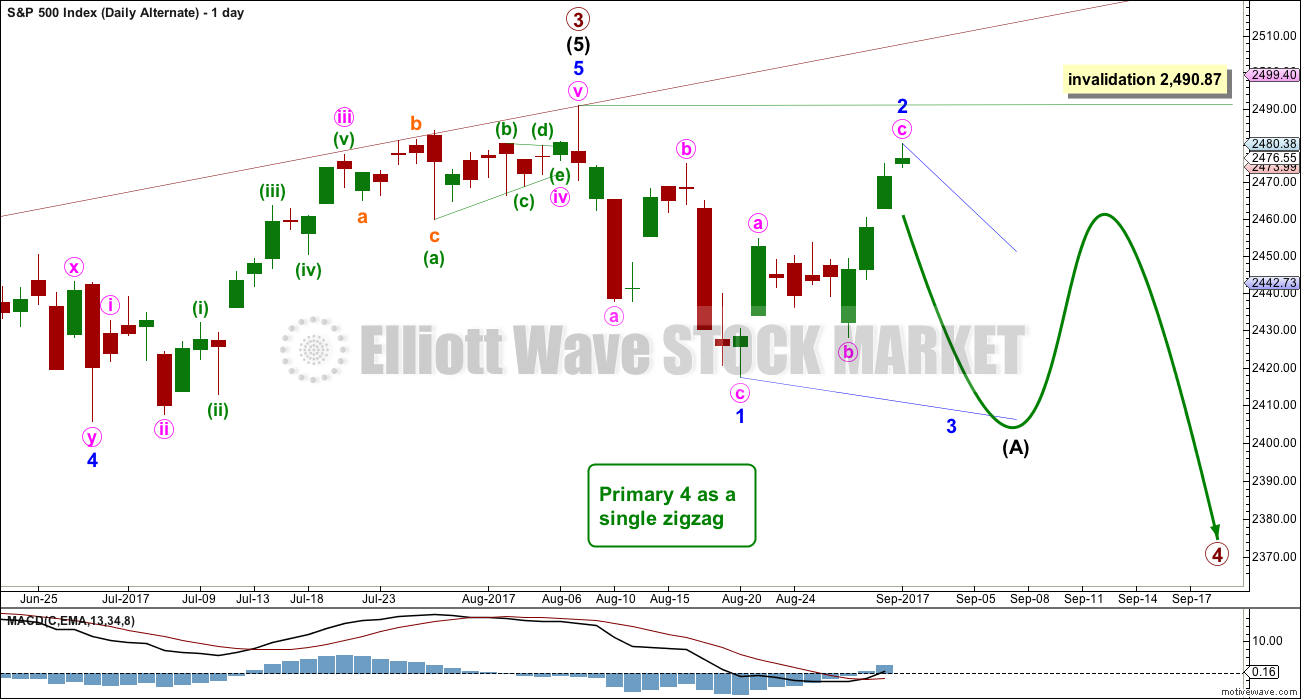
The first three daily charts all consider the possibility that the first wave down was a complete three. This alternate considers the possibility that a five down is still underway.
If intermediate wave (A) is an incomplete five down, then the larger correction for primary wave 4 would be a single zigzag.
Intermediate wave (A) may not now be an impulse, because the first wave down is clearly a three and not a five. It may be a leading diagonal.
Leading diagonals have sub-waves one, three and five that most commonly subdivide as zigzags, although they may also be impulses.
Within diagonals, the second and fourth waves must be zigzags and are commonly from 0.66 to 0.81 the length of the prior wave. Here, minor wave 2 would now be 0.86 the length of minor wave 1, not too much deeper than the common length.
Minor wave 3 must make a new low below the end of minor wave 1 below 2,417.35. It would most likely be shorter than minor wave 1, which was 73.52 points in length, as contracting diagonals are the most common variety.
Minor wave 2 may not move beyond the start of minor wave 1 above 2,490.87.
HOURLY CHART
Click chart to enlarge.
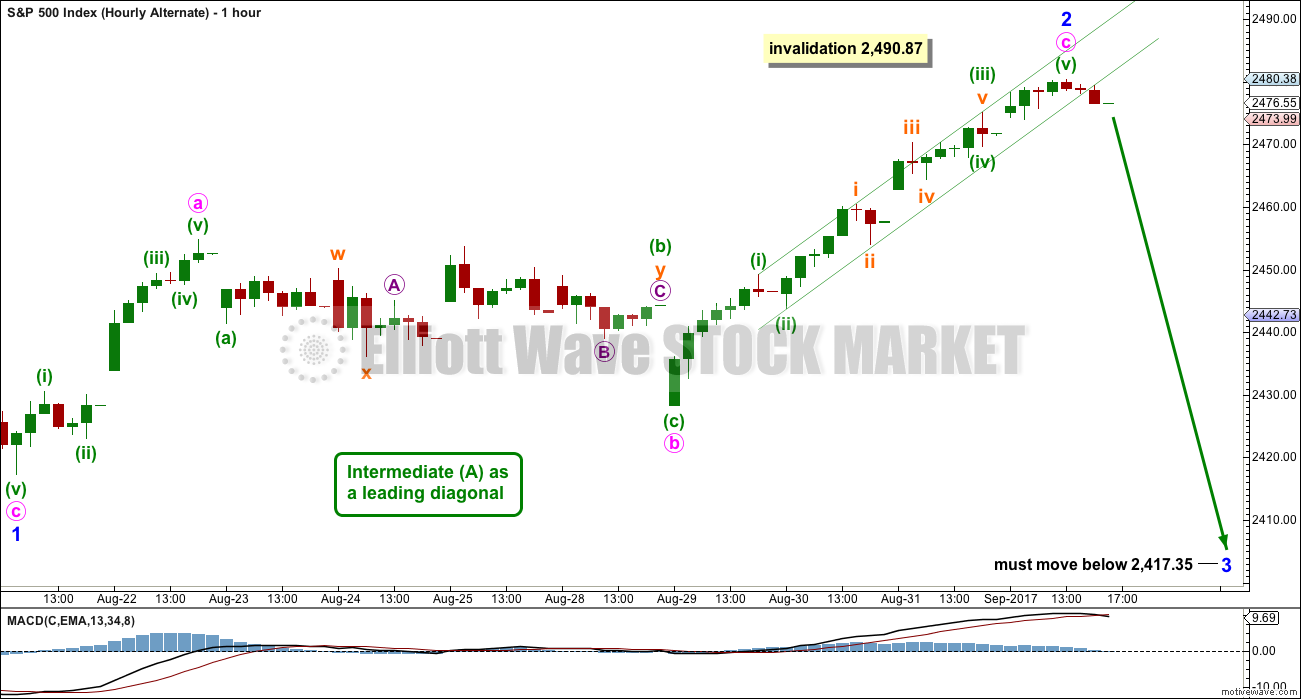
Subdivisions at the hourly chart level are the same for all wave counts. Only the degree of labelling and the larger structure differ. All wave counts see a zigzag complete downwards to the last low, and now a zigzag upwards completing.
The confidence point is the same. The channel is the same and should be used in the same way.
An important difference is the invalidation point for this alternate at the all time high.
TECHNICAL ANALYSIS
WEEKLY CHART
Click chart to enlarge. Chart courtesy of StockCharts.com.
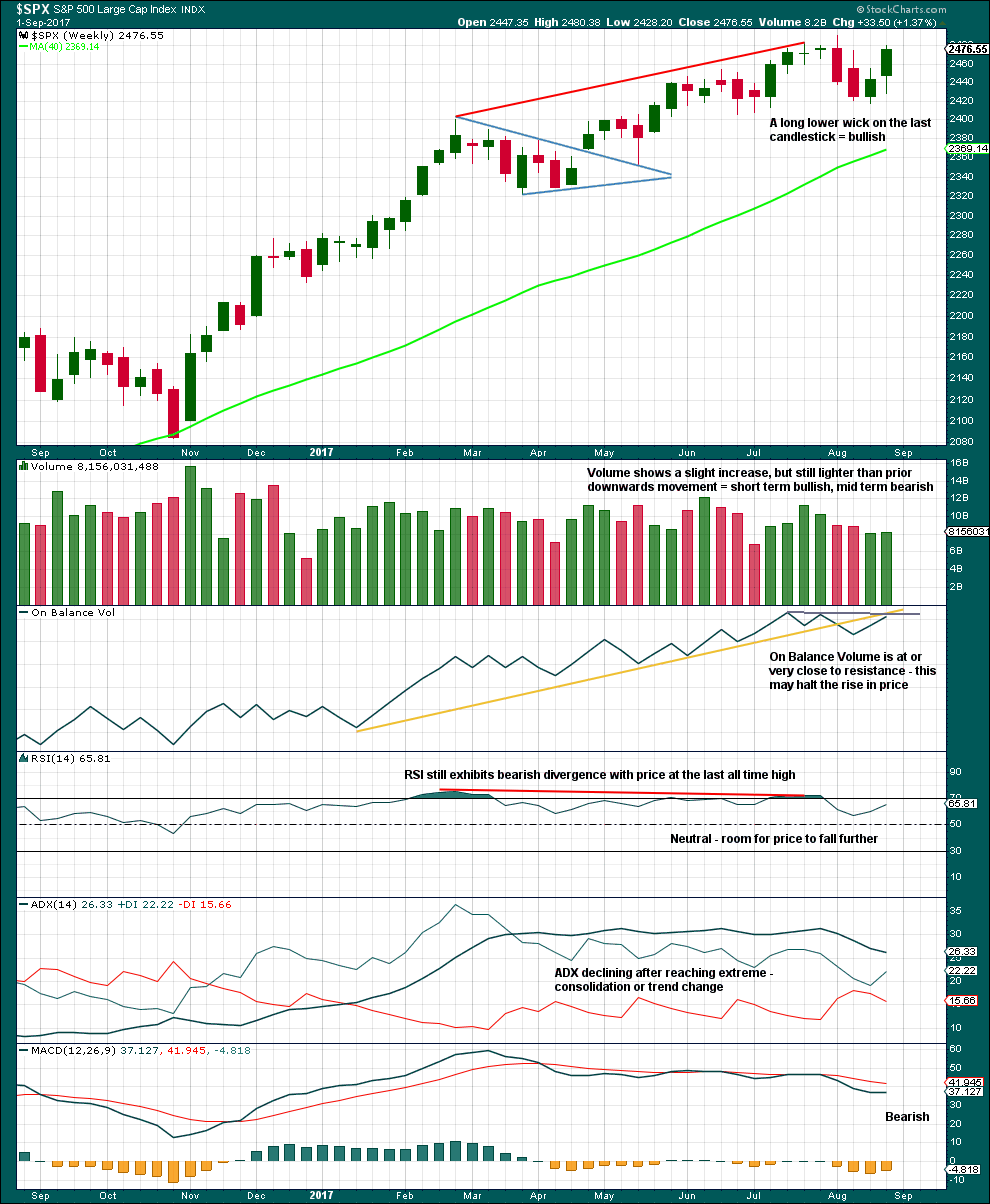
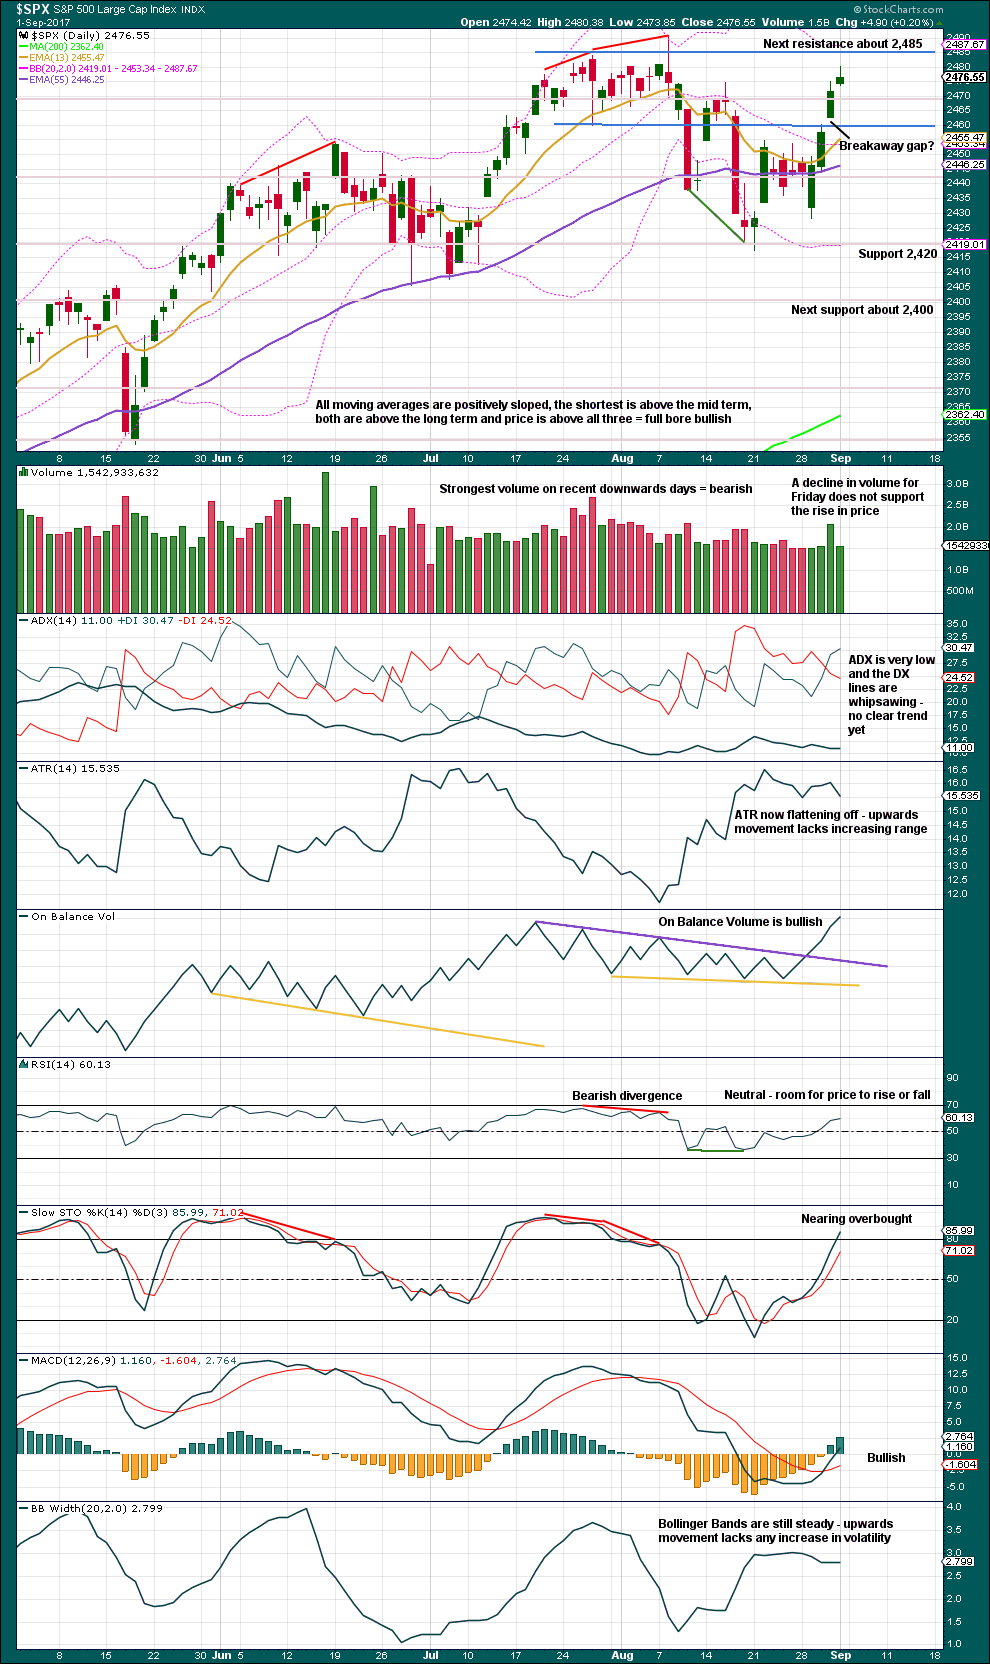
An upwards week has a long lower wick and slight support from volume. In the short term, it is entirely possible that this upwards movement is not over.
However, volume remains relatively light, relative to recent downwards weeks. There is still more support for downwards movement than upwards, so it still looks like a consolidation may be continuing.
Consolidations do not move in straight lines. Price whipsaws from support to resistance, and back again. At this stage, it looks like that is what price may still be doing.
ADX had been extreme for a long time and is now declining. The black ADX line is now declining but has not yet been pulled down below both directional lines, so the consolidation or pullback may be expected to continue.
DAILY CHART
Click chart to enlarge. Chart courtesy of StockCharts.com.
Only if an upwards breakout to a new all time high is seen, which very importantly should have support from volume, would the view that price is consolidating have to change.
ADX, ATR and Bollinger Bands all agree that so far it looks like price may still be consolidating.
Price is nearing resistance and Stochastics is nearing overbought. Expect this upwards swing to end here or fairly soon. Stochastics may remain extreme and then develop divergence before price turns. There is a little room for price to rise further before it finds resistance.
For the short term, the slightly longer upper wick, the small range, and the light volume for Friday’s candlestick looks slightly bearish. The last three daily candlesticks complete a stalled pattern, which is also bearish.
One of the best techniques for trading a consolidation is to use resistance and support along with Stochastics to indicate when price may turn. This is a high risk strategy though: price can overshoot resistance or support before turning, and Stochastics is useful but not as an exact technique for timing a turn. Losses can be large but should be few while profits may be many and small. Only the most experienced traders should attempt it.
It is absolutely essential that good risk management and money management techniques are used. Anyone trading a consolidation without using stops is inviting financial losses.
Please use my two Golden Rules of risk management: always use a stop and invest only 1-5% of equity on any one trade.
VOLATILITY – INVERTED VIX CHART
Click chart to enlarge. Chart courtesy of StockCharts.com.
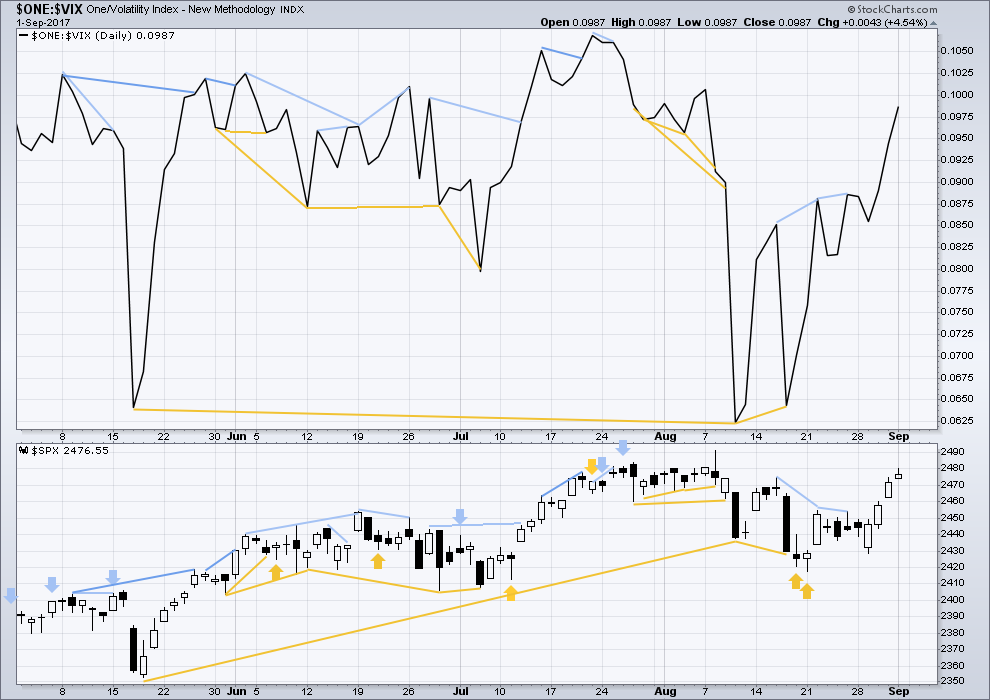
Normally, volatility should decline as price moves higher and increase as price moves lower. This means that normally inverted VIX should move in the same direction as price.
There is no new divergence today. Rising price comes with a normal decline in volatility.
BREADTH – AD LINE
Click chart to enlarge. Chart courtesy of StockCharts.com.
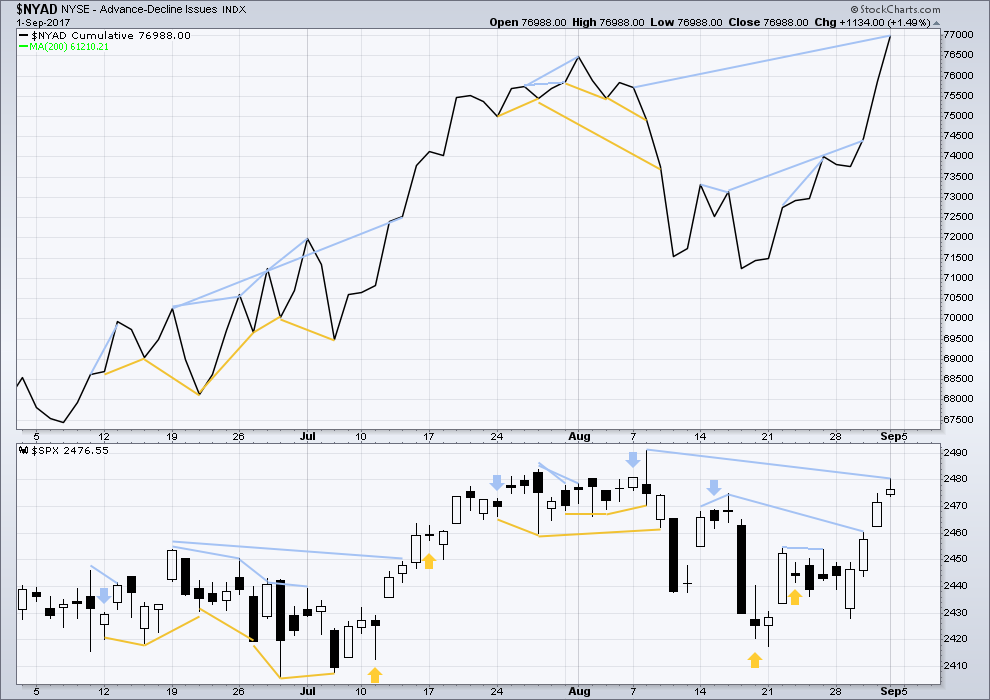
With the last all time high for price, the AD line also made a new all time high. Up to the last high for price there was support from rising market breadth.
There is normally 4-6 months divergence between price and market breadth prior to a full fledged bear market. This has been so for all major bear markets within the last 90 odd years. With no divergence yet at this point, any decline in price should be expected to be a pullback within an ongoing bull market and not necessarily the start of a bear market.
There is new hidden bearish divergence today between price and the AD line: the AD line has made a new all time high for Friday, but price has failed to make a corresponding high. This indicates weakness within price.
However, it has been noted that mid term divergence such as this tends to be less reliable than short term divergence. It will only be noted and given a very little weight because it includes a new all time high for market breadth.
DOW THEORY
The S&P500, DJIA, DJT and Nasdaq have all made new all time highs recently.
Modified Dow Theory (adding in technology as a barometer of our modern economy) sees all indices confirming the ongoing bull market.
The following lows need to be exceeded for Dow Theory to confirm the end of the bull market and a change to a bear market:
DJIA: 17,883.56.
DJT: 7,029.41.
S&P500: 2,083.79.
Nasdaq: 5,034.41.
Charts showing each prior major swing low used for Dow Theory are here.
Published @ 03:49 a.m. EST on 2nd September, 2017.
I want to start off by thanking Lara and the regular contributors – it’s the first time in 12 years of following the stock market that I have some sound advice to go upon.
Open question for anyone that trades US stock options – I’m currently using interactive brokers, and I would like to trade options outside of regular hours. Is that possible/allowed? If it is possible, how do I enable it?
Thanks in advance,
Jiten
Welcome Jiten 🙂 Here you’ll find a small community of extremely experienced and knowledgable professionals. The more you participate, the more you’ll get out of this community.
As for your question re US brokers, as I’m in NZ I can’t answer that one.
IB is one of the few brokers that will let you trade markets world wide and if the exchange is open, buying options even when US markets are closed should not be a problem. You might have to find a different ticker for the equivalent US instrument on a non- US exchange. Some brokers will also let you execute trades after hours with special permission.
You can also of course execute options on futures during futures trading hours.
A big thank you today to Verne and Kevin. Thank you for sharing your ideas, and Verne thank you for sharing your trades and opportunities you’ve spotted.
To newer members: there is a wealth of experience and knowledge being shared here. Take advantage of it. Read carefully, figure out what they’re doing, follow along. When you’re comfortable have a go.
Manage risk.
Right on Lara, off to enjoy some tropical groundswells before we get a good ole fashion pounding here in FL!
Awesome 🙂
I’ve been riding long clean peeling lefts this week at one of my favourite breaks, but only up to 3ft on it’s biggest day.
Go get yourself barrelled 🙂 🙂
Thank you!! I’ll be sure to!
Most Welcome! Also enjoying Kevin’s commentary. 🙂
( I do miss Olga!!)
Me too. She’s awesome. I’m guessing we’ll see her again if / when price starts to fall strongly.
Hi Olga! *waves*
Before I answer any questions and make responses below, here’s your updated hourly chart this morning.
Importantly, price has made a new low today below 2,454.77. I have the low today so far at 2,446.55.
This downwards movement cannot be a fourth wave within a continuing impulse higher, because it’s overlapped down into what would be it’s corresponding first wave price territory.
It’s too big in proportion to be another second wave correction.
I’m going to have confidence now that the last upwards wave looks very much like a three, is probably a three, and is complete.
This gives me reasonable confidence that P4 is indeed underway.
But what structure it’s going to take… still wide open.
My labelling of minor A may change. It could be over at todays low. I need more time on the 5 minute chart before I make a final decision on that for today.
MInor B may not move beyond the start of minor A.
On balance volume turned down today from a possible resistance point. However, I am not seeing a very clear wave structure within today’s price action.
RUT also turned sharply downward. 1400 has been a prior one of support/resistance and it looks like we are experiencing that now. If we take another leg down we might see similar activity around the 1380 area.
I personally think we still have a ways to go to the downside. If not, there is no possible structure (within Lara’s assumption that we are in wave 4) that would fit with the idea we could see a new ATH within the next few weeks.
A new ATM? You mean its going to be that easy??! 🙂
If it’s a triangle, price need to get down to at least the 2437.50 area and turn. If it’s a combination, then Y needs to get close to the bottom of W, which is even further down. However, as a combination, the ride down should be pretty choppy, and here we have a decent chop back up. Combinations inside combinations => short term predictions become extremely difficult!
Those are logical price targets. Logical this market ain’t! 🙂
Talk about beautiful set-ups!
USO lagging the turn already made by the triple leveraged ETfs GUSH and DRIP but is giving clear notice of its intention with that exhaustion gap and shooting start today.
I am certainly not going to look a gift horse in the mouth.
Hurricane jitters makes this feel like a very counter-intuitive trade but the charts don’t lie.
Buying USO September 29 10.00 strike puts for 0.32 per contract.
Filled at 0.29 per contract….
That “exhaustion gap” could be a running gap. Robert Miner published (in his free section, or I wouldn’t be sayin’) over the weekend a very bullish posture on oil, fyi/fwiw.
Yeah. It does look a bit risky doesn’t it? I am looking at Oil’s larger chart and Irma not withstanding, I think 20 dollars per barrel is a’ calling. I’ve got a hard stop at USO 10.15 close just in case I am wrong! 🙂
Based on the market’s prior erratic behaviour, I would not be at all surprised to see this leg of a possible triangle complete in one session. Why?
Because it would be totally nuts! That why.
And totally nuts is what this market has been for quite some time.
No option but to get out the nut-cracker! 🙂
It would be doubly strange as we would not have seen a three wave down….
I think it makes more sense to assume we are in wave 2 up of a 5 down within a zig zag or triangle for wave 4.
Among the auto stocks, AZO and ORLY also looking vulnerable, the latter displaying contracting BBs that suggests a violent move is in the making.
Once again, KSS trading at the deluded level of 40.00 . This is a 30.00 dollar or less stock folk. Take the money and run! 🙂
Stop may be set at 41.53, lower boundary of last gap down….
If we have triangle underway, we will probably descend to the lower boundary into the close to complete wave C followed by a nice move up for the D wave starting tomorrow. The pattern of these moves down is that they have been completing in a session or two and I see no reason to expect any change going forward. This whipsawing price action has been driving traders who have not adjusted absolutely nuts I wager….
TLT island reversal negated with a higher high today indicated by last session’s bullish long lower wick. Long upper wick today however suggestion reprieve may be short lived with resumption of the down-trend imminent. The number of false signal being thrown off by this market is unlike anything I have ever seen. Absolutely remarkable. Maintaining TLT short positions.
Oil also in counter-trend rally probably due to hurricane jitters. Looking for good re-entry for resumption of the downtrend there as well….
Opened “stink bid” on October SCO 35 strike calls…
The .618 fibo is giving signs of holding, sharp reversal bar on 5 minute SPX chart. Calm enough for the moment (and currently flat) to go enjoy one in the garden sunshine for a few minutes and count my short blessings! Thank you Lara for your fine analysis, so extremely helpful for establishing high probability trade triggers!
Yum! 🙂
The bearish symmetry is taken out. However, this looks very much like a 4 wave in development, and so far price hasn’t done any pullback/sideways action similar to such action in the prior big downmoves over the last month. The 21 ema on the 5 minute isn’t busted yet, nor the downtrend line for the whole move. If those don’t bust and price starts dropping yet again, it’ll be time for bite #4.
Chomp! 😀
Selling half 247.50 SPY puts for 2.20….holding remaining half for more downside….
Sweet play, Verne
Thank ye!
The only way I have been able to pull off these precision strikes is with Lara’s scintillating analysis. It allows option traders like me to execute high probability trades with the clearly identified pivots and invalidation points. Best EW analyst I’ve seen.
Critical 2454.77 pivot taken out. You know what to do…! 🙂
We bears can rest easy for now. The bulls lacked the fire-power to maintain capture of the 2470 pivot and they expended a lot of capital trying to get it done. They are probably going to get mauled for the next session or two until the bulls can regroup…. 🙂
Counting at 5 minute level can be “wrong” but…looks to me like we’ve got a clear 1 down, 2, and are deep into the 3. A 4 should be coming pretty soon, and another chance to load up on a pullback. Price now stalling at the 50% fibo, could be the start of some kind of 4. Bearish symmetry now at 2459.5
Counting at 5 minute level can be “wrong” but…looks to me like we’ve got a clear 1 down, 2, and are deep into the 3. A 4 (possibly an inner 4 if 3 is extending) should be coming pretty soon, and another chance to load up. I’ve twice open then closed short positions so far. I want a third bite.
Come on in…the water’s fine! 😀
Kaboom through the 2455 pivot area (and 50% fibo retrace of end of Aug upmove)!! The train a keeps on a rollin’!!! A complete down move symmetric with the Aug 8-10 and/or the Aug 17-18 moves (putting the low for this move at 2425-2427 area) is quickly becoming as likely as not! Next decision area is 62% retrace at 2448.35. Looking at the 1 month spy chart, what comes to my mind is that old phrase, “churning at the top”, seeing all these rather large up/down gyrations.
It’s not wrong at all to count 5 or even 1 minute charts.
It’s just open to more frequent revision. And more frequent error.
Loading SPY 247.50 puts expiring Friday for 0.55. This will be a scalping trade looking for a quick double….
This decline is interesting. We are not seeing a huge early plunge that typicially suggests someone taking a massive short position with subsequent immediate bankster buying to give that long lower wick. It looks like both the bearish and bullish heavy hitters are holding dry powder, so we could see a big move as one of them steps in….
VIX has a bit of a distance to travel to its upper B band. Unless it picks up speed toward the top band today, we could see, for a change, more than a day or two of downward movement. Upper B band penetration and/or the characteristic candlestick hammer should again alert us to a reversal at hand.
Selling September 20 VIX 10.00 strike calls for 3.10
There is probably more upside but until I see evidence that the bears can maintain a sustained decline in this market, I will assume every decline will face still bankster resistance and reversal to the upside. SPX 2455 remains a key pivot per Lara’s wave analysis.
I have symmetric projections and a 38% fibo in the zone of 2460-2462. Definitely a decision point area to be watched carefully for a possible turn back up. The next one down is at the 50% fibo (and another sym projection) at about 2454.5 to 2455. I’m also watching carefully for a break upward of the downtrend line on 5 min bars starting with the top of the final bar last friday. So far, staying under.
2468.22 is the 23.6% retrace fibo of the one week low to high move, and is also at this moment the exact top of the bearish symmetry (the largest upmove in this downtrend, projected from the lowest low so far). If price hits that and starts turning back down, I will re-load (took round 1 profits already).
bearish symmetry lower now, around 2466.80. If it pushes above that (a full 5 minute bar), IMO the downmove is over for the time being, and most likely the day’s range is set. On the other hand a turn down at/before that level indicates to me a strong potential for more significant momentum down today, and I’ll consider more shorts or vix bets.
The banksters are going to no doubt continue to try an arrest these impulsive declines so I think it is smart to cash in short side trades as soon as they are profitable. It has really been uncanny how what should have been the start of extended declines continue to morph into corrective structures due to the relentless intervention. I suspect the current move down will end prior to reaching a new low and give another touch point for what is possibly a developing contracting triangle trendline.
Agreed Verne. Day trading this thing may be the way to go, for those members with nerves of steel.
Because it’s impossible for me to tell you with any confidence which of the one of multiple structures P4 may be, so what pathway price may take to complete it. Whipsaws and lots of chop to be expected.
And triangles have been common of late in this market.
Indeed. The wise option is to ring the register early and often!! 🙂 🙂 🙂
Waiting for a break of 2455 to load a good sized SPY put purchase; the biggest I would have made in some time. This would be a short term scalp to the downside via SPY 248 puts expiring this week.
The bears served notice last Friday that they were not about to surrender the 2470 pivot without a slugfest and they followed through with the gap down this morning. I suspect this battle will unfold in the form of a triangle. The thrust out of it should be the banksters last hurrah, as geo-political and economic realities finally overwhelm even their deep pockets.
Taking profits on half puts bought last week on this gap down.
Looks like price is balanced on the 2470 pinhead!! Which way is it going to fall, I wonder wonder wonder. My $bet is down.
VXX (and related’s) is still quite low. Given the EW view of significant likely downward movement (particularly now that it’s started and there hasn’t been a quick reversal), I like VXX’s risk/reward here.
I think you may be right. What is of huge significance here is that the market is falling in the absence of any significant selling pressure. It has looked to me for a few weeks now that the banksters are providing cover for stealthy exit of the smart money. It could also be that geo-political tremors are starting to shake the resolve of the bankster deep pockets…! 🙂
I guess this could still be part of a flat correction and we are in a 5th up?
don’t say that it is going to go all the way up – again!
really having trouble interpreting a current wave count!
NY is closed and so nothing for me to analyse today
Will we be able to trade S&P tonight or have to wait until tomorrow night re Labor Day?
Futures trade Sunday 5pm CDT to Monday 12pm CDT, then open again at 5 CDT Monday. Everything else can’t be traded until 8:30 CDT.
Again, great and insightful analysis!
These markets are SO interesting right now. We have seen the obsessive determination over these last few years of the banksters to forcibly arrest any kind of impulsive decline in this market. We have probably lost count of all the times an expected third wave ended up being just the C wave of a corrective structure, to our great disappointment, and our being unceremoniously ejected from our short side trades. Triangles and disgonals evidence sharp price battles between bulls and bears, and if we do indeed have a leading diagonal underway, it means the bulls are slowly but surely loosing the battle and the sharp zig zags will continue.
At the conclusion of the posssible LD, they will have a final hurrah in the form of yet another deep manic second wave. THEN, perhaps, after all this time, we get a proper third wave decline… hmmmnn….!
Cheers Verne 🙂
😀
Wow, a treasure trove of Elliott Wave education in this update! Thank you for being so comprehensive, and explanatory. Really valuable.
For the daily chart – combination, you say “There may only be one zigzag within a combination (otherwise the structure is a double zigzag, which is very different and is considered below). At this stage, that would be intermediate wave (W), which is complete.”
The corresponding chart labels the X wave up as a ABC zigzag…which it can’t be for a combination. So X would have to mutate to some other structure, like a flat or an impulse in order for a combination to play out. Am I getting this right?
Cheers Kevin, and you’re welcome 🙂
It gets confusing at this point in a correction. It’s necessary to be clear and illustrate a variety of options.
When I mean there can only be one zigzag in a combination I”m referring to waves W, Y and Z.
Not wave X.
They’re joining structures, not counted as one of the number of corrective structures in a combination.
Combinations are doubles or triples. This counts W and Y, or W, Y and Z. If we counted X as well then they’d be triples (W-X-Y) and quintuples (W-X-Y-X-Z).
So X is just fine as it is, and it could be over. They are most commonly zigzags.
Got it, TY!
Just having a carroty week-end!