
On Balance Volume is very bullish. Members are given some trading advice on how to approach this market at this time.
Summary: The bigger picture sees the S&P now in a primary degree pullback to last a minimum of 8 weeks.
The main and alternate wave counts are swapped over today. It now looks fairly likely that price may make a new all time high in the next few days. Some trading advice is given today in the technical analysis section.
Last monthly and weekly charts are here. Last historic analysis video is here.
ELLIOTT WAVE COUNT
WEEKLY CHART
Click chart to enlarge.
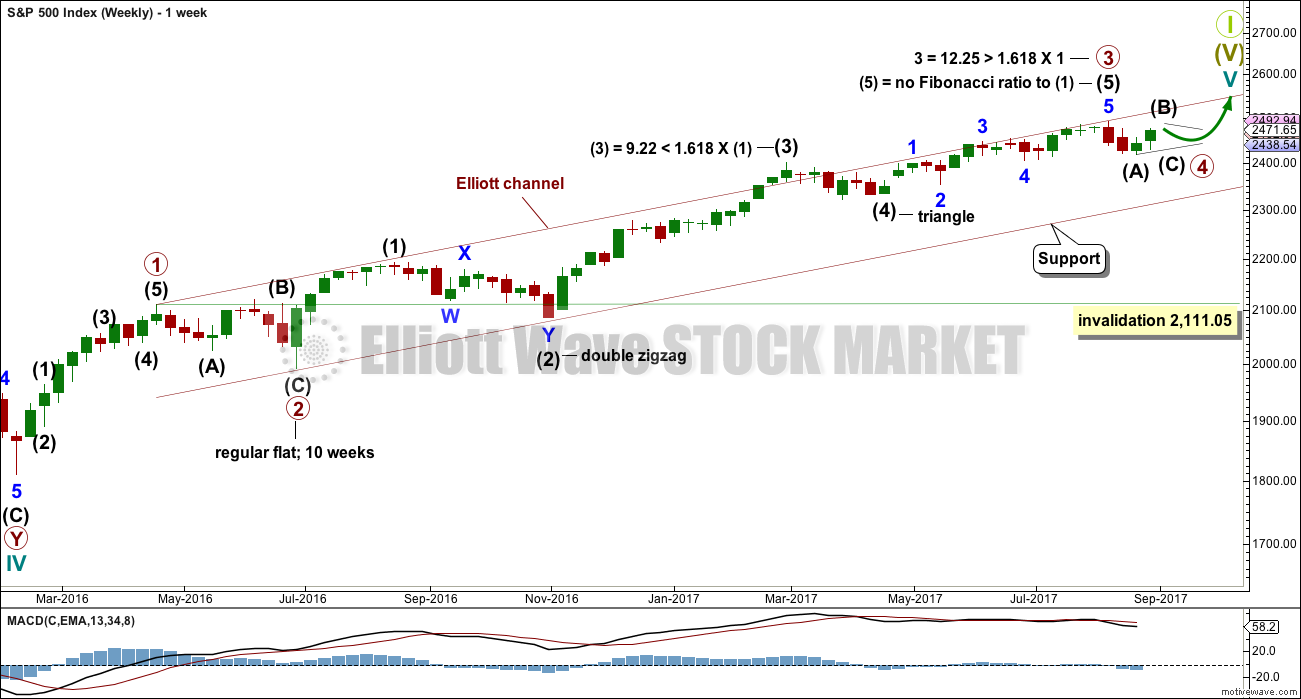
Primary wave 3 now looks complete. Further and substantial confidence may be had if price makes a new low below 2,405.70, which is the start of minor wave 5 within intermediate wave (5). A new low below 2,405.70 may not be a second wave correction within an extending fifth wave, so at that stage the final fifth wave must be over. Fibonacci ratios are calculated at primary and intermediate degree. If primary wave 3 is complete, then it still exhibits the most common Fibonacci ratio to primary wave 1.
Primary wave 4 may not move into primary wave 1 price territory below 2,111.05.
Primary wave 4 should last about 8 weeks minimum for it to have reasonable proportion with primary wave 2. It is the proportion between corrective waves which give a wave count the right look. Primary wave 4 may last 13 or even 21 weeks if it is a triangle or combination. So far it is only nearing the end of its third week.
If primary wave 4 unfolds as a single or double zigzag, then it may find support about the lower edge of the maroon Elliott channel. If it is a triangle or combination, it may be more shallow, ending about mid way within the channel.
The final target for Grand Super Cycle wave I to end is at 2,500 where cycle wave V would reach equality in length with cycle wave I. If price reaches the target at 2,500 and either the structure is incomplete or price keeps rising, then the next target would be the next Fibonacci ratio in the sequence between cycle waves I and V. At 2,926 cycle wave V would reach 1.618 the length of cycle wave I.
DAILY CHART
Click chart to enlarge.
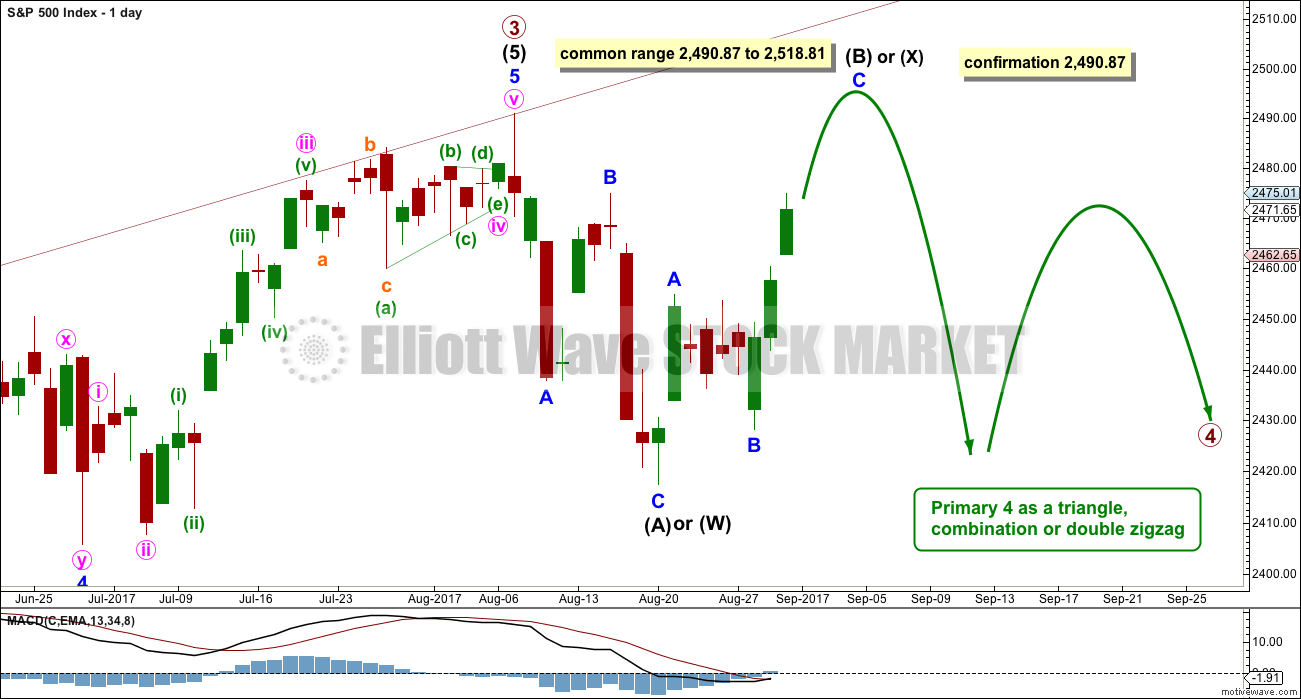
The daily chart will now focus in on the unfolding structure of primary wave 4.
Primary wave 4 may be any one of more than 23 possible corrective structures. With what looks clearly like a three down complete and now a bounce unfolding, primary wave 4 may be unfolding as a triangle or combination. Both those structures would still offer alternation with the flat of primary wave 2.
I have moved the degree of labelling within the zigzag up one degree. Intermediate wave (A) of a larger triangle may possibly be complete, lasting only two weeks. The triangle may still last a total of at least eight weeks, and possibly longer.
The zigzag down may also be intermediate wave (W) of a combination or double zigzag. A combination at this stage looks more likely because the following bounce is so far fairly deep.
If primary wave 4 is unfolding as a triangle, then within it intermediate wave (B) may make a new all time high as in a running triangle. There is no upper invalidation point.
If primary wave 4 is unfolding as a combination, then intermediate wave (X) may also make a new all time high. There is no upper invalidation point.
If primary wave 4 is unfolding as a double zigzag, then intermediate wave (X) should be over here or very soon. Double zigzags normally have relatively brief and shallow X waves.
While a flat correction is also possible for primary wave 4, it will not be considered at this stage as it is the least likely structure because it would offer no alternation with the flat correction of primary wave 2.
HOURLY CHART
Click chart to enlarge.
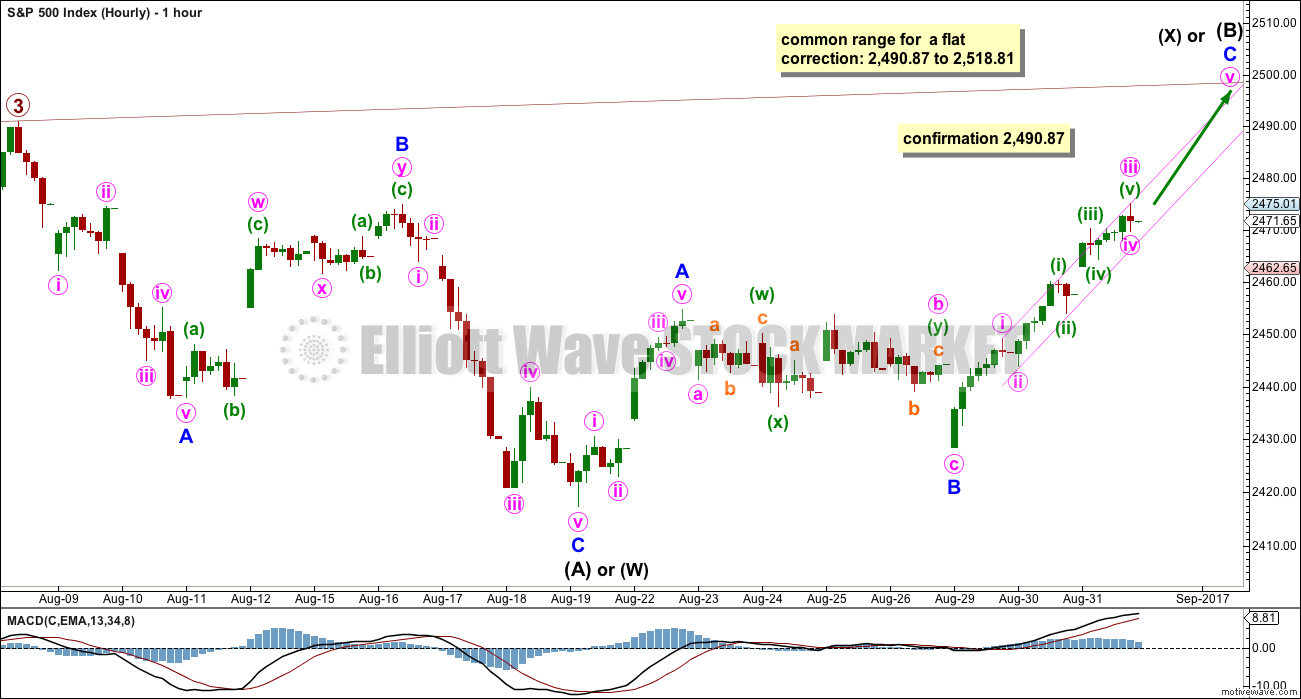
The degree of labelling has been moved up one degree. Intermediate wave (A) or (W) may be complete. Intermediate wave (B) or (X) may be incomplete.
Expect price to continue rising while it remains within the narrow pink channel.
While the target calculated does not expect a new all time high, the target may be wrong and a new all time high is possible.
ALTERNATE WAVE COUNT
DAILY CHART
Click chart to enlarge.
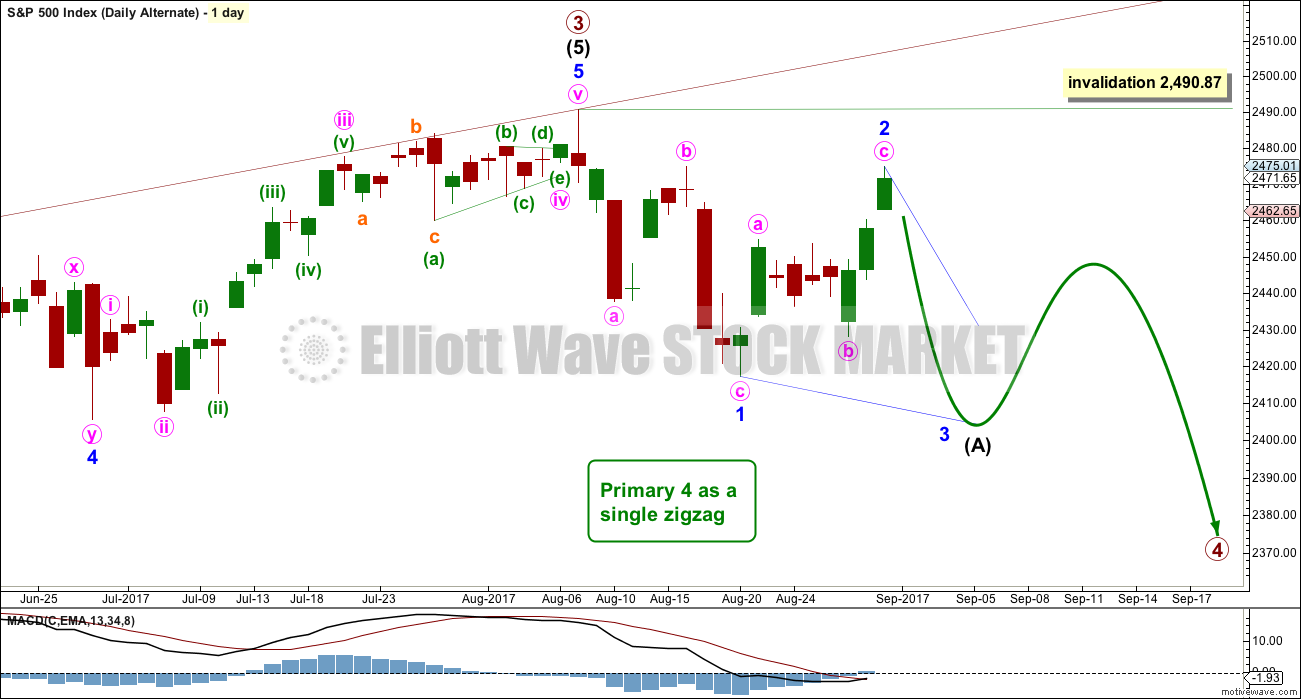
Primary wave 4 may be a single or double zigzag. Within both of those structures, a five down at the daily chart level should unfold. At this stage, that looks incomplete.
Intermediate wave (A) may be unfolding as a leading diagonal. The diagonal would most likely be contracting. Within intermediate wave (A), minor wave 2 may not move beyond the start of minor wave 1 above 2,490.87.
HOURLY CHART
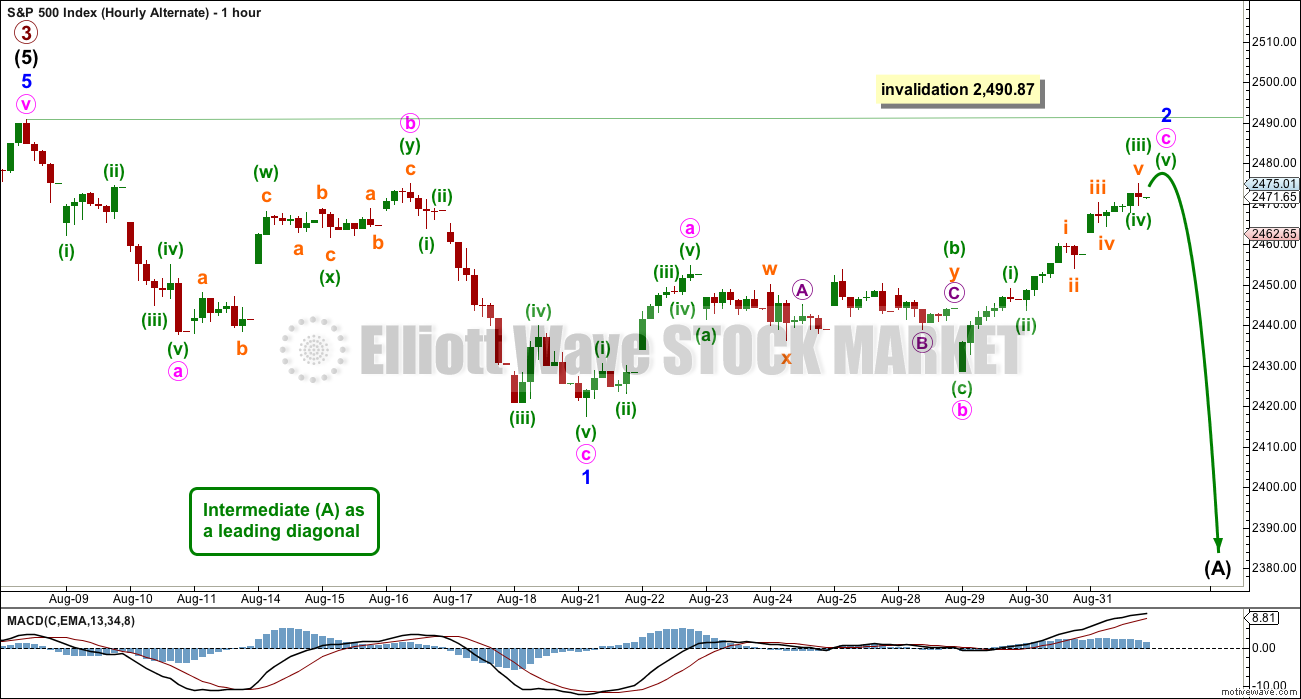
Click chart to enlarge.
Subdivisions at the hourly chart level are the same for both wave counts. Only the degree of labelling and the larger structure differ. Both wave counts see a zigzag complete downwards to the last low, and now a zigzag upwards completing.
The target at 2,488 would also work for this alternate wave count.
TECHNICAL ANALYSIS
WEEKLY CHART
Click chart to enlarge. Chart courtesy of StockCharts.com.
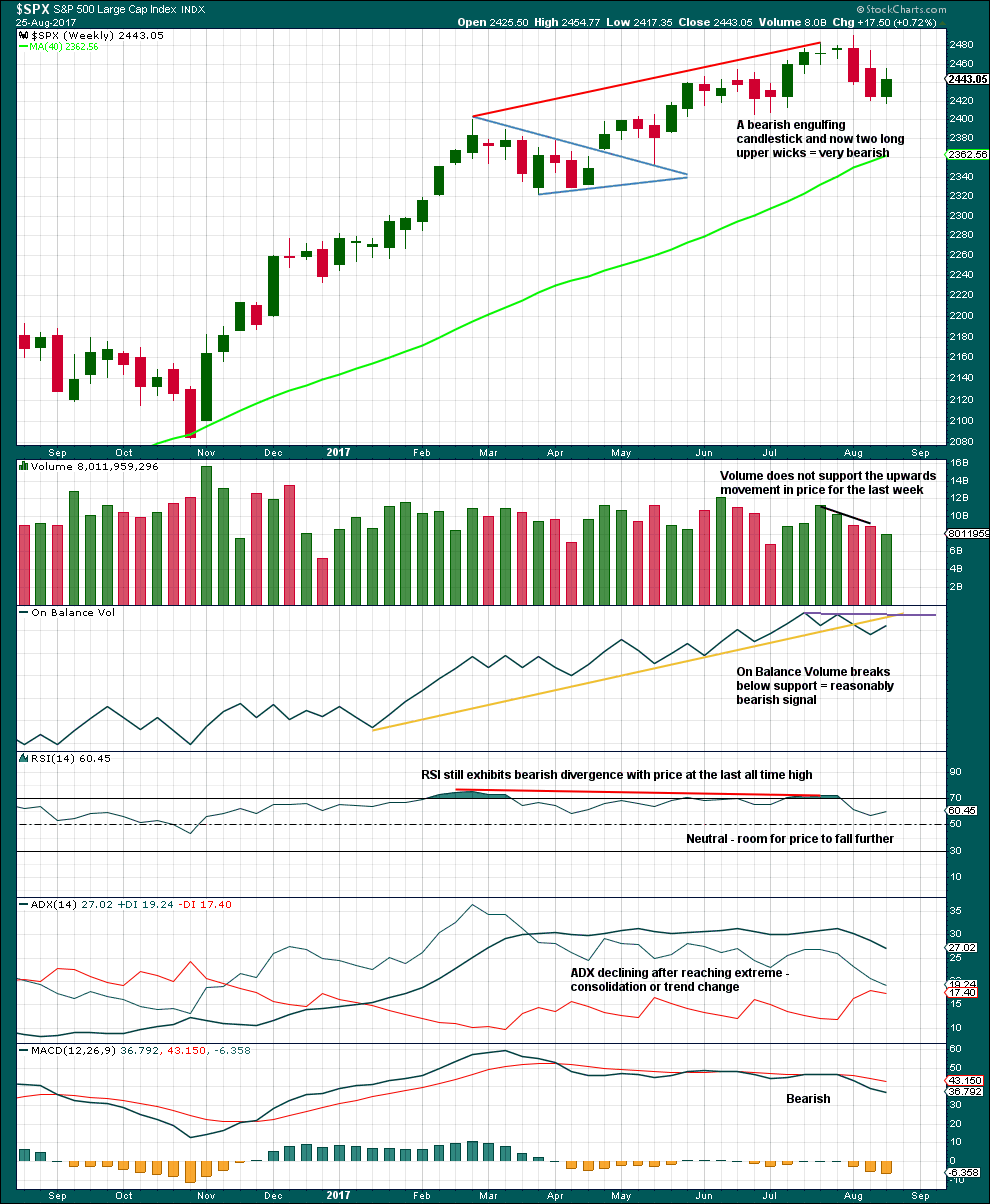
Last week has made a lower low and lower high, but the candlestick closed green and the balance of volume was upwards. Lighter volume does not support the rise in price during the week.
ADX had been extreme for a long time and is now declining. The black ADX line is now declining but has not yet been pulled down below both directional lines, so the consolidation or pullback may be expected to continue.
DAILY CHART
Click chart to enlarge. Chart courtesy of StockCharts.com.
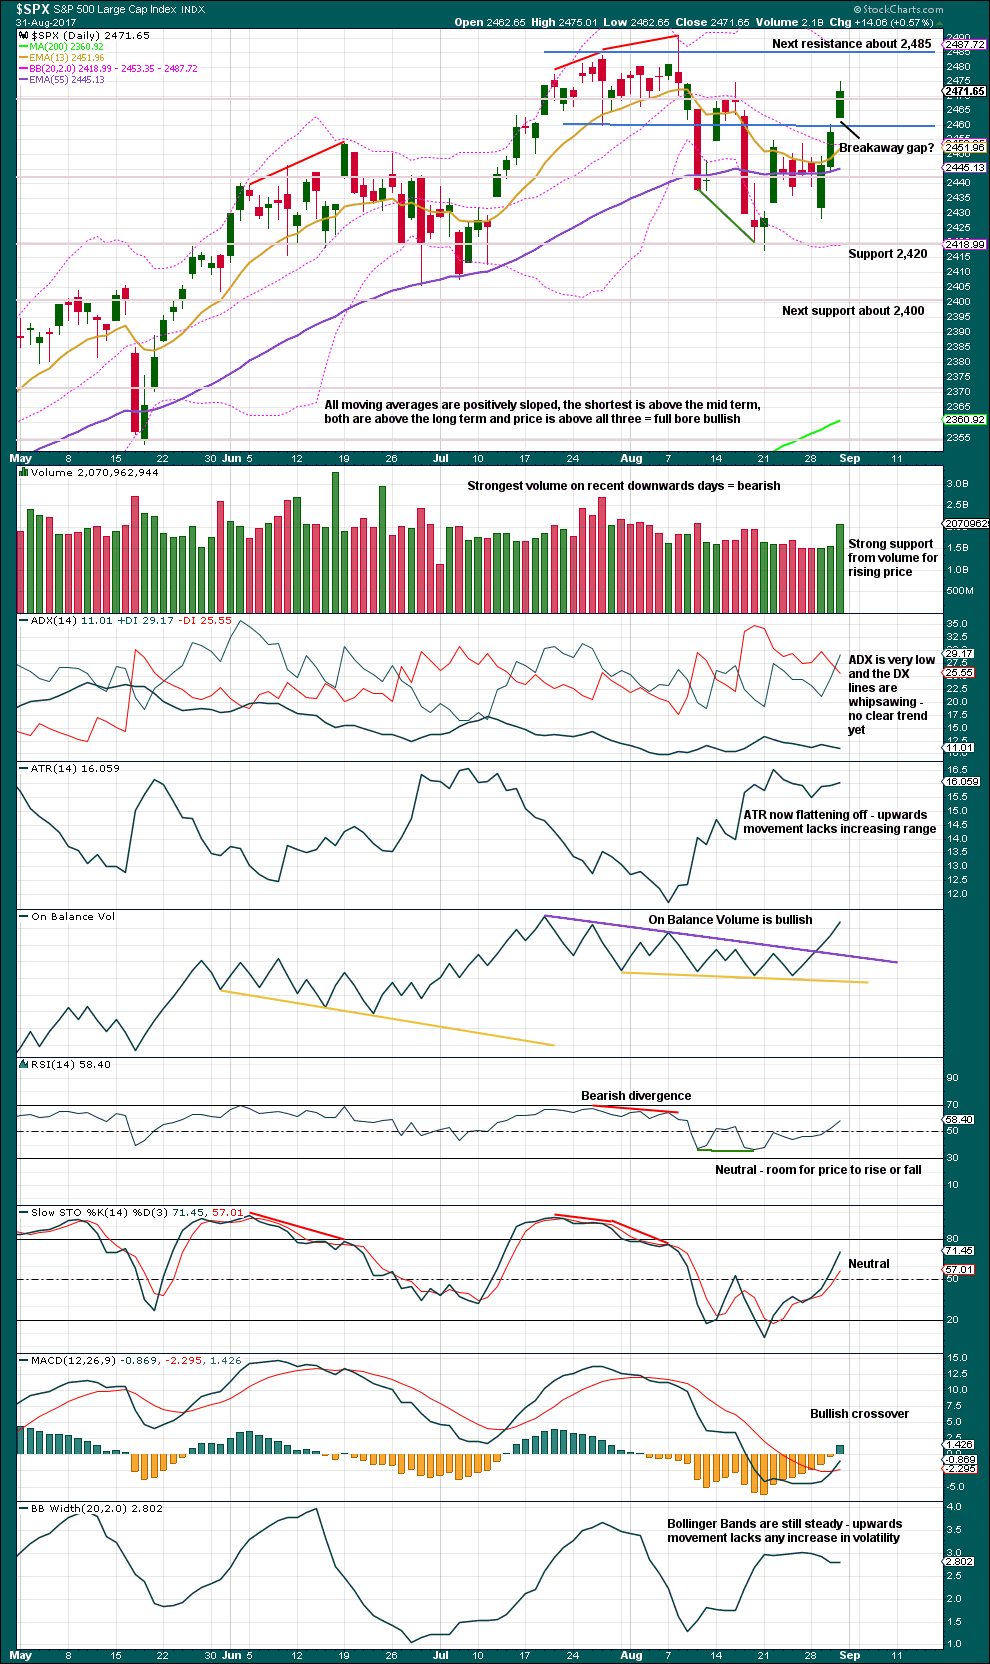
Volume and On Balance Volume are very bullish. If the Elliott wave analysis is wrong, it may be in expecting a primary degree correction to continue for some weeks. Members may like to enter long positions with stops just below the breakaway gap for a buy and hold strategy. If price makes a new all time high, then the area about 2,485 to 2,490 may offer strong support.
If the gap is a breakaway gap, then it may not be filled for a long time. If it is filled, then it is not a breakaway gap and long positions should be exited.
Always use a stop and invest only 1-5% of equity on any one trade. Risk management is the most important aspect of trading.
Moving averages are full bore bullish. ADX gives a bullish crossover today. MACD gives a bullish crossover. On Balance Volume is strongly bullish.
If this upwards movement is a B wave, then the only weakness it is showing so far is flat ATR and slightly contracting to steady Bollinger Bands. This weakness was seen in recent bullish trends.
VOLATILITY – INVERTED VIX CHART
Click chart to enlarge. Chart courtesy of StockCharts.com.
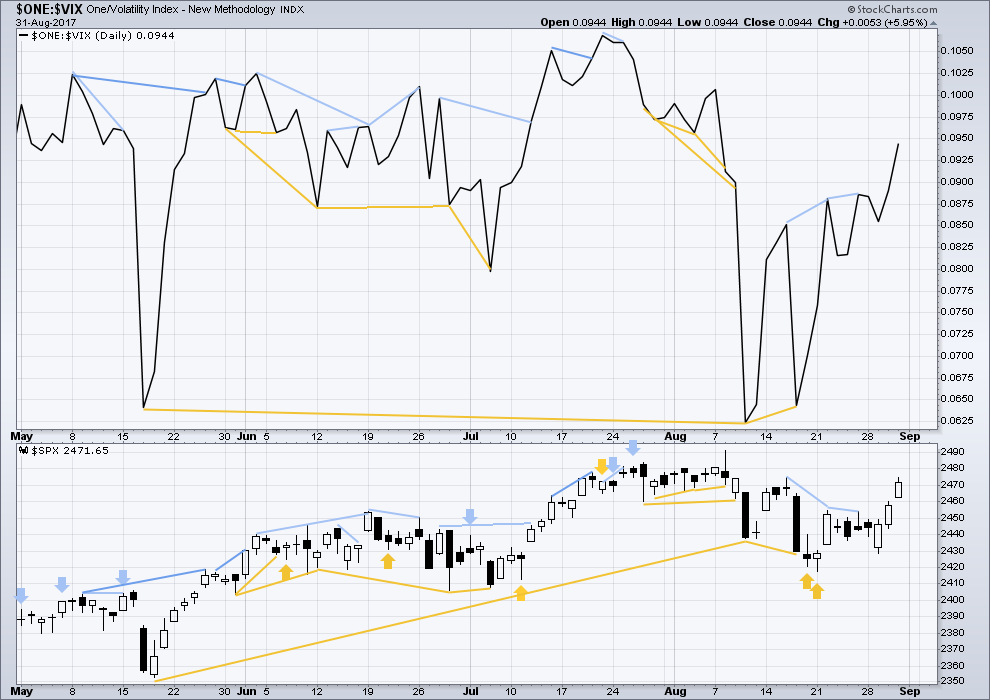
Normally, volatility should decline as price moves higher and increase as price moves lower. This means that normally inverted VIX should move in the same direction as price.
There is no new divergence today. Rising price comes with a normal decline in volatility.
BREADTH – AD LINE
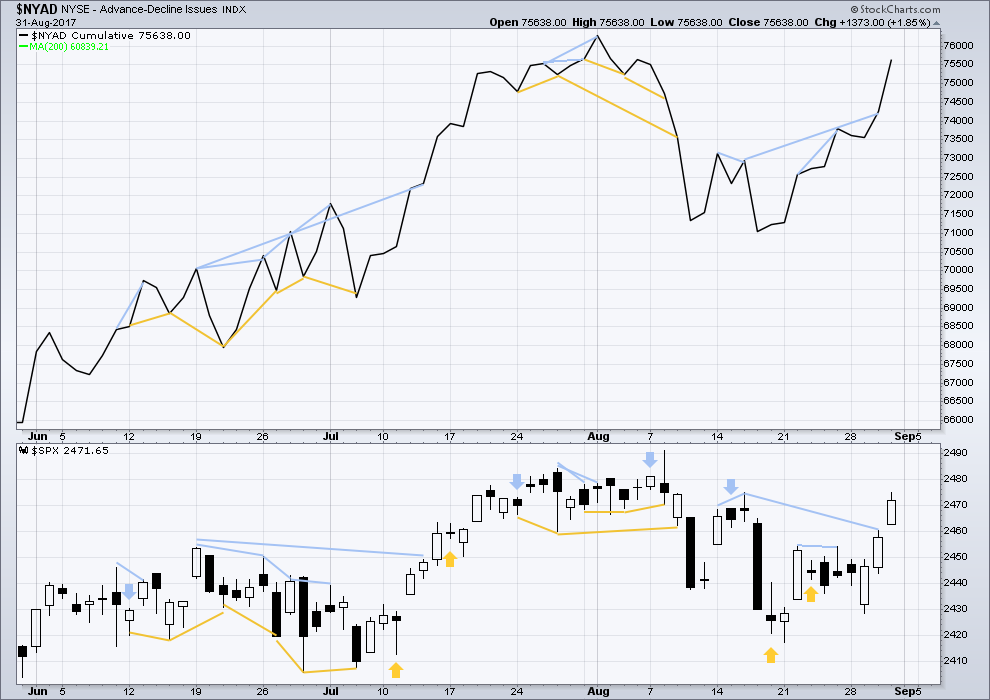
Click chart to enlarge. Chart courtesy of StockCharts.com.
With the last all time high for price, the AD line also made a new all time high. Up to the last high for price there was support from rising market breadth.
There is normally 4-6 months divergence between price and market breadth prior to a full fledged bear market. This has been so for all major bear markets within the last 90 odd years. With no divergence yet at this point, any decline in price should be expected to be a pullback within an ongoing bull market and not necessarily the start of a bear market.
Hidden bearish divergence noted in last analysis was mid term. It was judged to be unreliable and so given no weight. Today, it has simply disappeared.
There is no new divergence today between price and breadth. The rise in price is supported by a rise in market breadth.
DOW THEORY
The S&P500, DJIA, DJT and Nasdaq have all made new all time highs recently.
Modified Dow Theory (adding in technology as a barometer of our modern economy) sees all indices confirming the ongoing bull market.
The following lows need to be exceeded for Dow Theory to confirm the end of the bull market and a change to a bear market:
DJIA: 17,883.56.
DJT: 7,029.41.
S&P500: 2,083.79.
Nasdaq: 5,034.41.
Charts showing each prior major swing low used for Dow Theory are here.
Published @ 12:05 a.m. EST on 1st September, 2017.
hourly chart updated:
it looks like my target was too high
this last hourly candlestick is moving below the trend channel
BUT as many of us know the S&P just doesn’t play nicely with it’s trend channels. it breaches them, only to continue in the old direction, in this case up
a breach of this narrow steep channel gives a clue we might have a high, but it does not give reasonable confidence
a five down on the hourly chart would give confidence
and if a high is in place then this move can only be a combination, triangle or double zigzag
because so far intermediate (B) is only 0.86 X intermediate (A), the minimum requirement for 0.9 as flat is not met, yet alone the minimum of 1.05 for the most common expanded flat
Does a deep second wave no longer have the right look?
still possible, if the larger structure is a diagonal
because the first wave down is a three not a five
the second wave would now be 0.86 X the first wave, so a bit deeper than the common length of up to 0.81 but not by too much
that will still be the alternate idea
Adding AN September 15 45 strike puts for 0.80
You do not get these one-way trades very often! 🙂
SPX back above 2470 is not something I wanted to see. It has also typically clambered back inside a broken bullish channel and that also spells more bullishness ahead in all probability. Nonetheless, I think whatever bullishness remains in this market is going to be short lived in the form of the anticipated expanded flat taking us to new highs, or the very deep second wave retracing almost 100% of the initial wave down.
Right now riding lower trendline of channel on 1 hour chart. Nice to have a break before close but knowing Banksters will not let it happen. Perhaps a black Tuesday, like Oct 29,1929, Lol , if highs of day not taken out, otherwise I will accept being underwater in shorts a little longer.
This smallest of pullbacks has XIV moving down pretty good and VXX popping up. Those are based on a blend of VIX futures, and so represent a discounted view of the immediate future, more than the vix itself IMO. There may be some significant before holiday profit taking coming right up. I may use VXX as a means of some quick intraday profit should SPX start taking a dive.
The banksters indeed have been very successful in stoking very bullish sentiments going into this long holiday week-end. You really do have to hand it to them! I am sitting on a hedging bull put spread but I am not entirely convinced. 🙂
Very tough riding out counter-trend rallies as they tend to be manic. A little hedging relieves the stress, as well as providing a bit more ammunition… 😉
AN is cavorting waaaay above its upper BB and sporting a long upper wick. They don’t come any more inviting that that. It’s free money people!! 🙂 🙂 🙂
Adding September 15 44 strike puts for 0.35….
This a long shot but looking at movement since end minute 4, 2469.63, wonder if overlapping movement could be ending contracting diagonal. Possible if high is in and 2480.97 is not taken out which is length of what I have as minuette wave 3. This may also explain lack of new lows in VIX.
We may indeed be seeing a very deep second wave correction. I hope for the bull’s sake that is not the case, because if it is, the next move down is going to be be brutal. Very deep second waves are typical for leading diagonals, although I know Lara prefers to count the initial move down as an impulse….
Looks like it could be (and ending diagonal in SPX). Price is approaching a break of that diagonal, then immediately below is the trend line under this entire 4 day move. But I’m not considering an SPX play to the short side unless/until bullish symmetry is taken out, current around 2473.50. Occasional jags down in big runs like this have to be expected. In the QQQs I’ll get really interested in the short side if the low today is taken out. That would be a trigger for me, given the set up.
Bullish symmetry break point is now about 2474.90.
It is quite interesting how the market has managed to buck all the seasonal bearish symptoms this year. We did not see “Sell in May and Go Away”, as we often do, and we also remarkably managed to complete on of the most historically bearish months of the year in terms of the depth of declines, pretty much unscathed. Coincidence, or design? 🙂
Despite the move down in VIX today, there has been very little movement on the VIX 10.00 strike calls for September 20 which are still bid at 2.50 with a 2.60 ask.
Hopefully we get a market spike higher and bit cheaper entry price…
Adding to September 15, 45 strike AN puts at 0.55, lowering cost basis to 0.72 per contract….
Buying KSS September 29, 39 strike puts for 0.50.
They really like to try and reanimate this corpse so it could go up awhile. Loading 1/4 full position and will lower cost basis as, and if, it goes higher…41.53 -41.93 gap area should provide strong resistance…
Very strange price action on the long bond. TLT had today what looks like an island reversal but at the same time is printing a hammer with today’s price action. This beast has a long way to fall but perhaps one more upside pop…it should go down to around 100 for the fifth wave down…..
Thanks for head up, in a scalp now on TBT, why not. I also see XLE is in a big ABC correction of it’s 3+ week down move through most of August. I will be using ERY to take advantage of that at some point soon.
Yep. I have been looking for a DRIP entry but have been a bit hesitant over the possibility of supply disruptions due to the weather. All the best counts I have seen call for a continued down-trend in the Oil price in a third wave…
Added to September 15, 145 strike puts on Triple Qs for 0.70, lowering cost basis to around 0.88 per contract….
Taking profit on bullish put spread and rolling to higher strikes,,,
A symmetric move relative to the July 11-27 low to high move puts the top of this one at almost exactly 2500. A big juicy number for a significant top. Another 2-3 days to get there I’d guess, with some minor pullbacks on the way.
Well now that we are all rather bullish I guess that means it’s time to go short? LOL. j/k, but really…
Decided it’s time to get a little bit in flow and add a long SPX position, given how high targets are here for the main count. Good reward/risk as I measure it. My eyes on the daily scream at me “going higher!”, and along with a real analysis saying the same thing…I’m in.
I believe the double top possibly forming in QQQ would be quite significant. I’m watching closely to see if QQQ starts rolling down here, and I would view that as a strong indicator this bull run may be over. Next would be SPX breaking bullish symmetry (<2473.50 or so at the moment), and then I'd be looking to get back short. If it goes that way today!
Thanks Lara for the excellent analysis and commentary. Corrective waves are nearly impossible to predict the final structure. You do a great job at identifying the probabilities as well as possibilities. Your use of classic TA to help identify the corrective waves is extremely valuable.
That being said, we have a great deal of bullish signals this past week. It looks like the weekly candle will be up strongly. I suspect that weekly on-balance volume may also give us a bullish signal. If it only approaches and stays underneath the upper trend line, it will fit with the B wave and X wave scenarios.
Thanks again and have a wonderful weekend.
Cheers Rodney
I agree, a lot of bullishness about
I am going to be taking some time to see if I can see a more bullish wave count that sees P3 still underway, or possibly P4 over and P5 underway
but if P4 is over, then it would have lasted just 2 weeks. that would be a remarkably brief and shallow primary degree correction
it simply has to turn up sooner or later…
Appears as though my hopes and dreams of 2320 for P4 low will not come true. Figures. This market loves the shallow correction.
we can’t rule it out yet, P4 could still be a double zigzag
that’s still on the table
oh, I was pipped!
First today!
A new sheriff in town!