
Downwards movement was expected. This is how the session began, but price recovered well by the end of the session to come up to touch the trend line expected to provide resistance on the hourly chart.
Summary: The bigger picture sees the S&P now in a primary degree pullback to last a minimum of 8 weeks and find support at the maroon channel on the weekly chart.
Watch the upper blue trend line on the main hourly chart carefully. If price breaks above it, then look for upwards movement to end somewhere in the zone of 2,466 to 2,477. A new high above 2,455.77 would provide price confidence in this view. WARNING: A bullish signal from On Balance Volume today supports the alternate hourly Elliott wave count which sees a bounce underway.
The short term target for a third wave down is now at 2,362, which may be met in eight more sessions.
Last monthly and weekly charts are here. Last historic analysis video is here.
ELLIOTT WAVE COUNT
WEEKLY CHART
Click chart to enlarge.
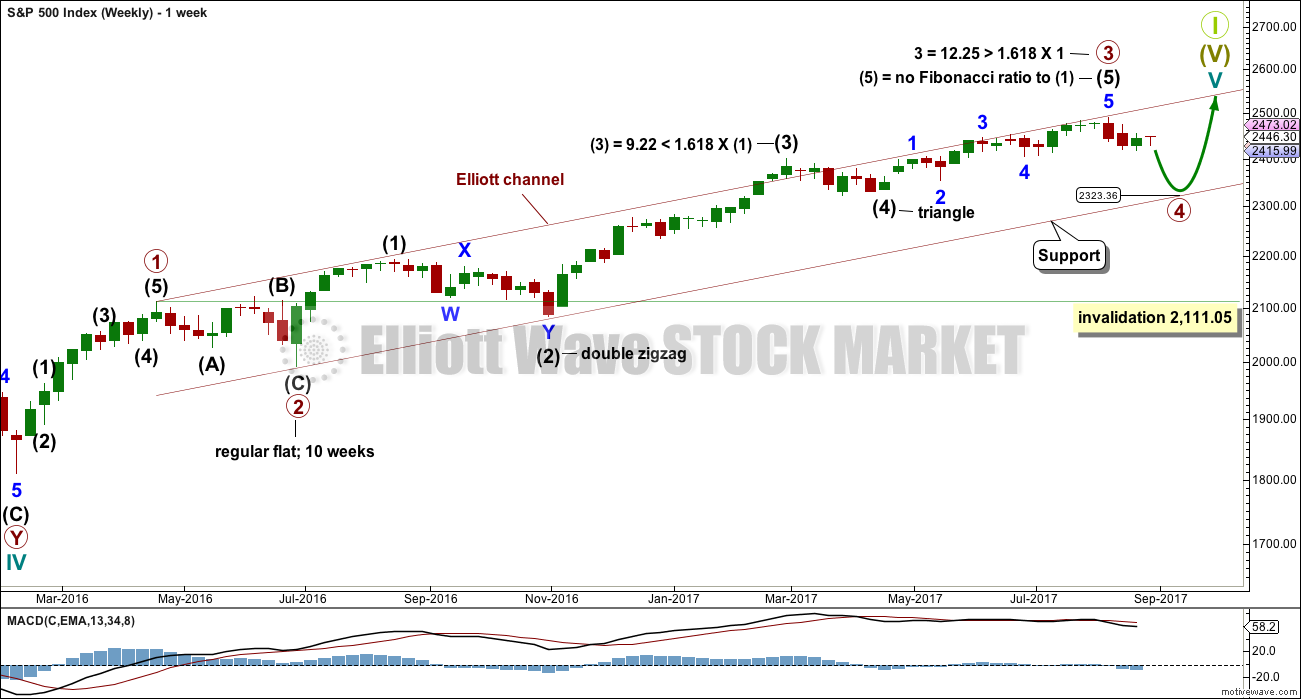
Primary wave 3 now looks complete. Further and substantial confidence may be had if price makes a new low below 2,405.70, which is the start of minor wave 5 within intermediate wave (5). A new low below 2,405.70 may not be a second wave correction within an extending fifth wave, so at that stage the final fifth wave must be over. Fibonacci ratios are calculated at primary and intermediate degree. If primary wave 3 is complete, then it still exhibits the most common Fibonacci ratio to primary wave 1.
Primary wave 4 may not move into primary wave 1 price territory below 2,111.05.
Primary wave 4 should last about 8 weeks minimum for it to have reasonable proportion with primary wave 2. It is the proportion between corrective waves which give a wave count the right look. Primary wave 4 may last 13 or even 21 weeks if it is a triangle or combination. So far it has lasted only two weeks.
If primary wave 4 reaches down to the lower edge of the Elliott channel, it may end about 2,325. This is within the range of intermediate wave (4); fourth waves often end within the price territory of the fourth wave of one lesser degree, or very close to it.
The final target for Grand Super Cycle wave I to end is at 2,500 where cycle wave V would reach equality in length with cycle wave I. If price reaches the target at 2,500 and either the structure is incomplete or price keeps rising, then the next target would be the next Fibonacci ratio in the sequence between cycle waves I and V. At 2,926 cycle wave V would reach 1.618 the length of cycle wave I.
DAILY CHART
Click chart to enlarge.
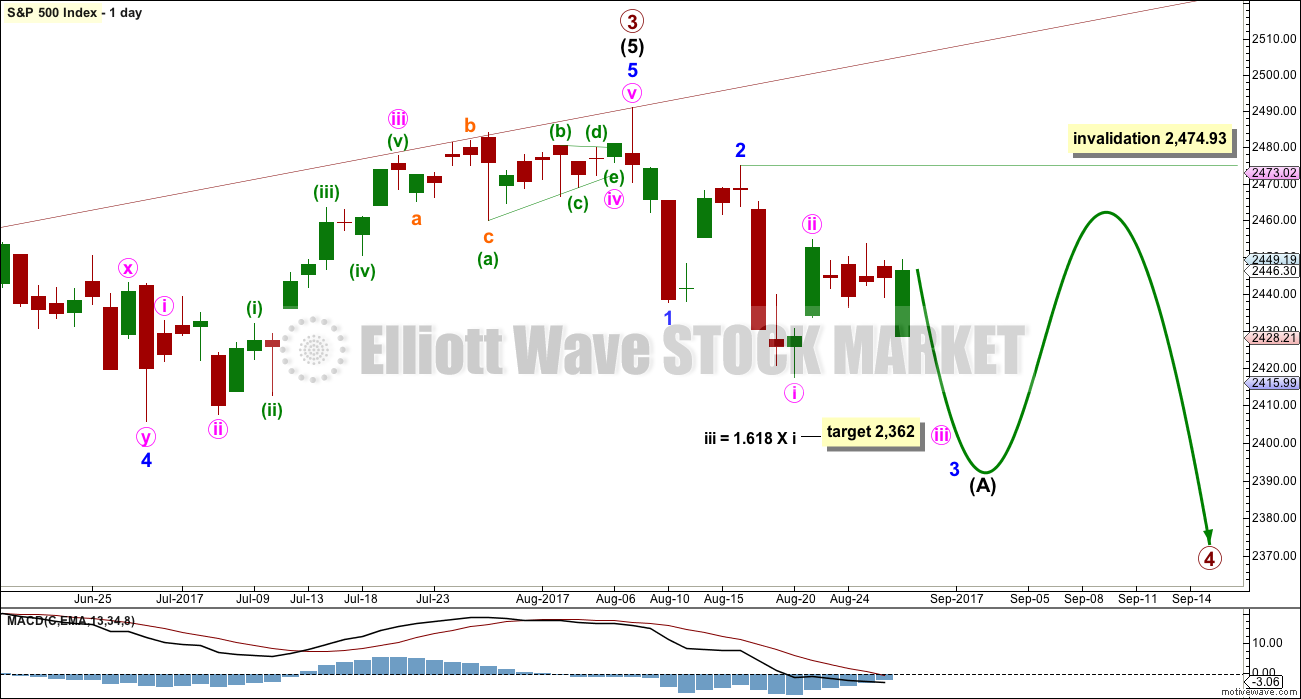
The daily chart will now focus in on the unfolding structure of primary wave 4.
Primary wave 2 was a regular flat correction lasting 10 weeks. Given the guideline of alternation, primary wave 4 may most likely be a single or double zigzag. Within both of those structures, a five down at the daily chart level should unfold. At this stage, that looks incomplete.
While primary wave 4 would most likely be a single or double zigzag, it does not have to be. It may be a combination or triangle and still exhibit structural alternation with primary wave 2. There are multiple structural options available for primary wave 4, so it is impossible for me to tell you with any confidence which one it will be. It will be essential that flexibility is applied to the wave count while it unfolds. Multiple alternates will be required at times, and members must be ready to switch from bear to bull and back again for short term swings within this correction.
While intermediate wave (A) is labelled as an unfolding impulse, it may also be a diagonal. Both structures are considered at the hourly chart level.
Intermediate wave (A) may also be a zigzag if primary wave 4 is to be a triangle. So far it is possible a zigzag downwards could be complete, but it is not deep enough for wave A of a triangle when it is viewed on the weekly chart. And so that possibility will not be considered at this time.
MAIN HOURLY CHART
Click chart to enlarge.
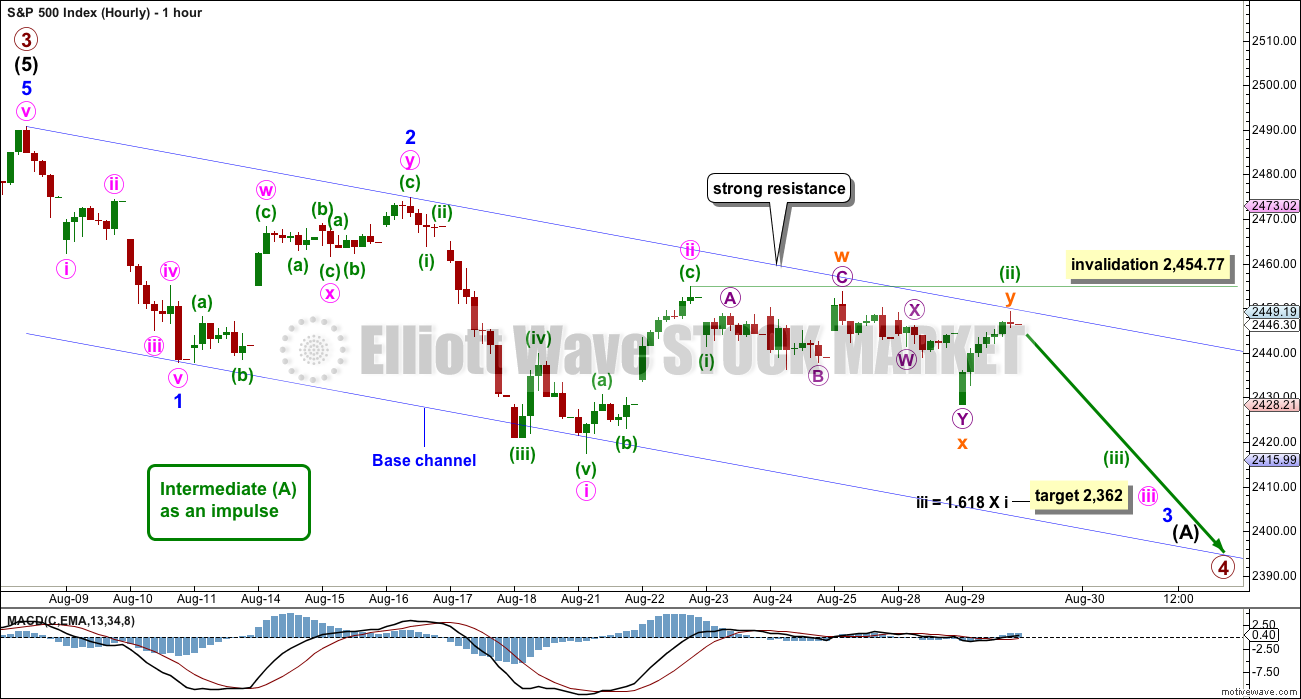
Minor wave 1 downwards looks very clear as a five wave structure.
Minor wave 2 upwards ended just above the 0.618 Fibonacci ratio. Minor wave 3 downwards has now made a new low below the end of minor wave 1, meeting the Elliott wave rule.
Minor wave 3 now exhibits slightly stronger momentum than minor wave 1. A further increase in downwards momentum would be expected.
Minute wave iii may be extending. Today, a target is calculated for minute wave iii and the target for minor wave 3 is removed.
When third waves extend, they do so in price and time. They look like stretched out accordions with their subdivisions showing at higher time frames. Minuette wave (ii) now shows up on the daily chart.
So far minute wave iii has lasted five sessions. If it completes in a Fibonacci 13, then it may continue now for another eight sessions. This is when the target at 2,362 may be met.
Minute wave iii downwards should show an increase in momentum and should have support from volume. Along the way down, bounces should continue to find resistance at the upper edge of the base channel. Lower degree second wave corrections should not breach base channels drawn about first and second waves one or more degrees higher.
Minuette wave (ii) may not move beyond the start of minuette wave (i) above 2,454.77.
If upwards movement breaks above the upper edge of the base channel tomorrow, then use the alternate below, even before invalidation.
ALTERNATE HOURLY CHART
Click chart to enlarge.
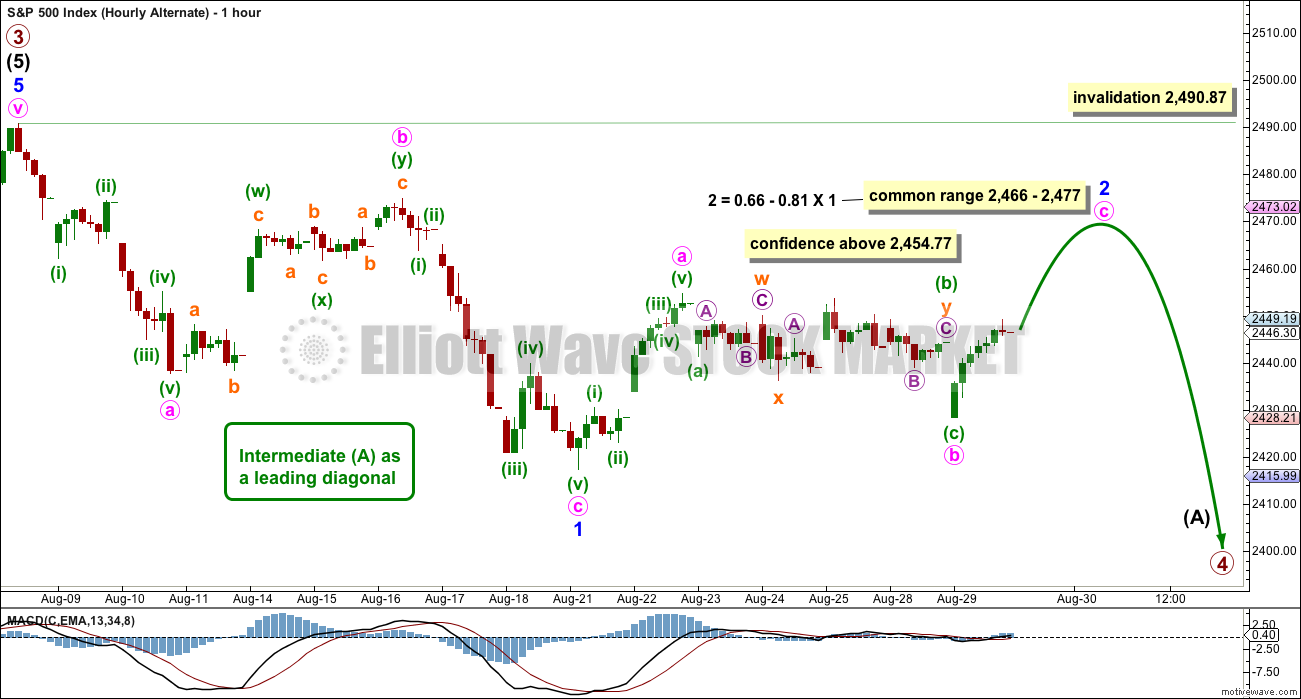
If the base channel on the main hourly chart is breached by upwards movement, use this alternate.
The other possible structure for intermediate wave (A), if it is to be a five, would be a leading diagonal. These are not as common as impulses, so this must be an alternate wave count judged to have a lower probability than the main wave count. However, low probability does not mean no probability. All possibilities should be considered.
Within leading diagonals, the first, third and fifth waves are most commonly zigzags. They may also appear to be impulses. Here, minor wave 1 will fit as a zigzag.
Second and fourth waves must be zigzags. Minor wave 2 may not move beyond the start of minor wave 1 above 2,490.87.
Sideways movement over the last five sessions may be a zigzag for minute wave b; this movement no longer fits as a triangle.
Second and fourth waves within diagonals are usually very deep; a range is given for the common depth.
Minor wave 3 would have to move below the end of minor wave 1 at 2,417.35. Minor wave 3 downwards of a leading diagonal should still exhibit an increase in downwards momentum and should still have support from volume.
TECHNICAL ANALYSIS
WEEKLY CHART
Click chart to enlarge. Chart courtesy of StockCharts.com.
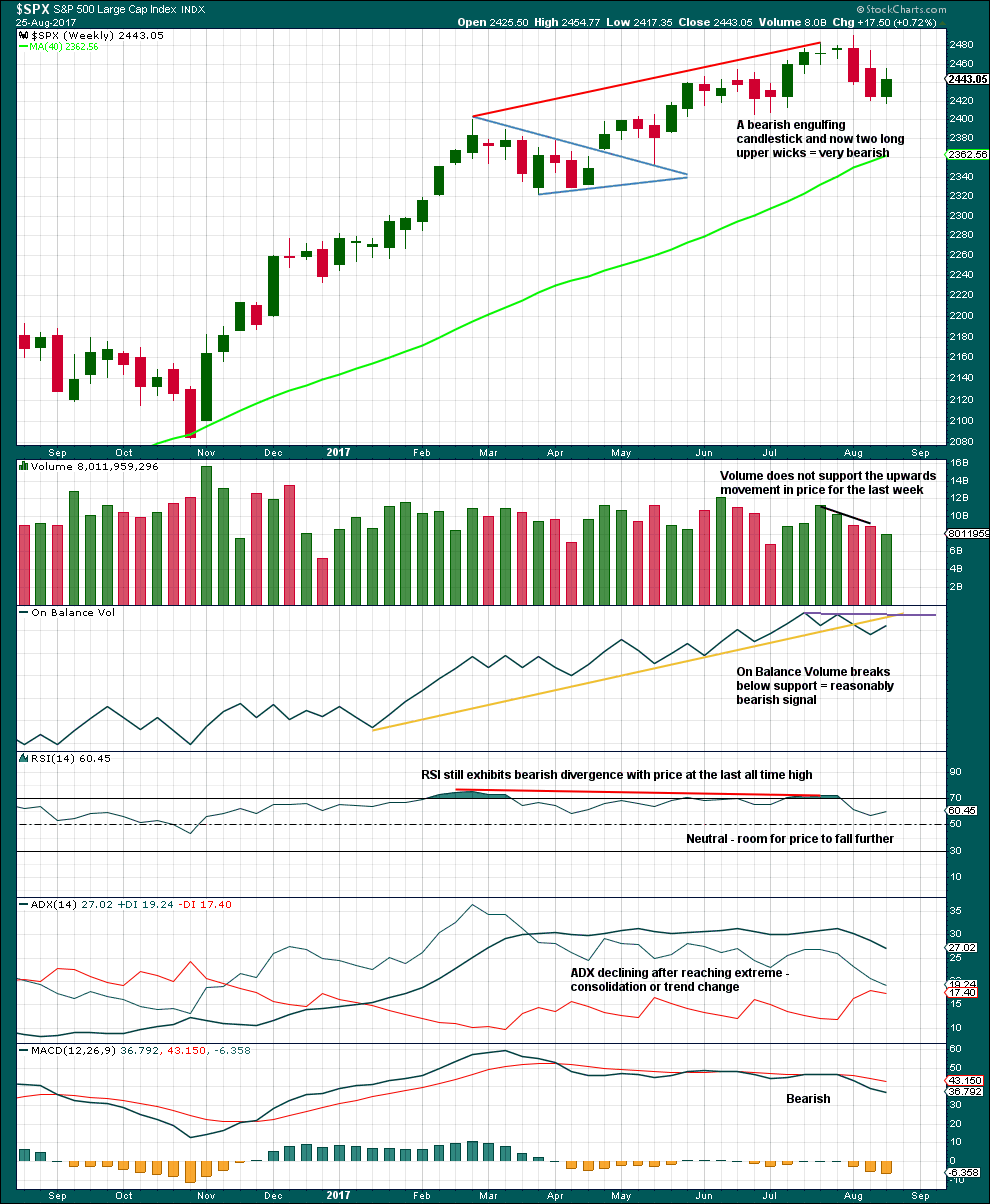
Last week has made a lower low and lower high, but the candlestick closed green and the balance of volume was upwards. Lighter volume does not support the rise in price during the week.
ADX had been extreme for a long time and is now declining. The black ADX line is now declining but has not yet been pulled down below both directional lines, so the consolidation or pullback may be expected to continue.
DAILY CHART
Click chart to enlarge. Chart courtesy of StockCharts.com.
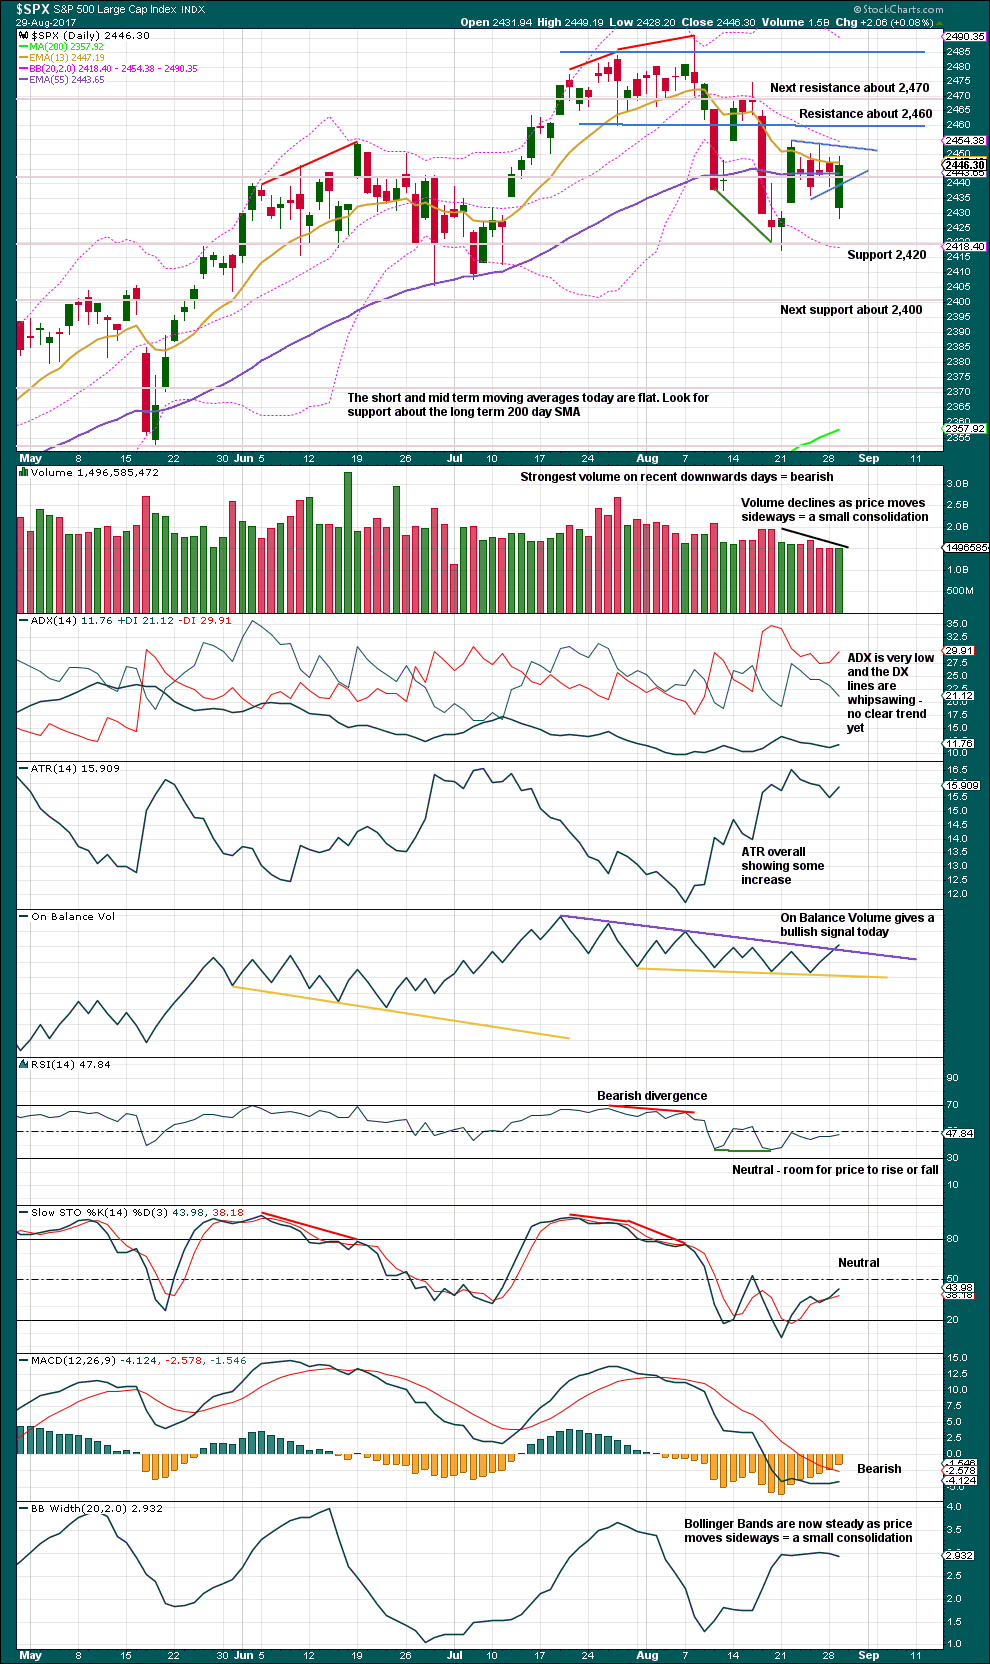
A downwards break has negated the possible pennant pattern.
There is an important bullish signal today from On Balance Volume. This supports the alternate hourly Elliott wave count. Look for resistance about 2,460 and next 2,470.
VOLATILITY – INVERTED VIX CHART
Click chart to enlarge. Chart courtesy of StockCharts.com.
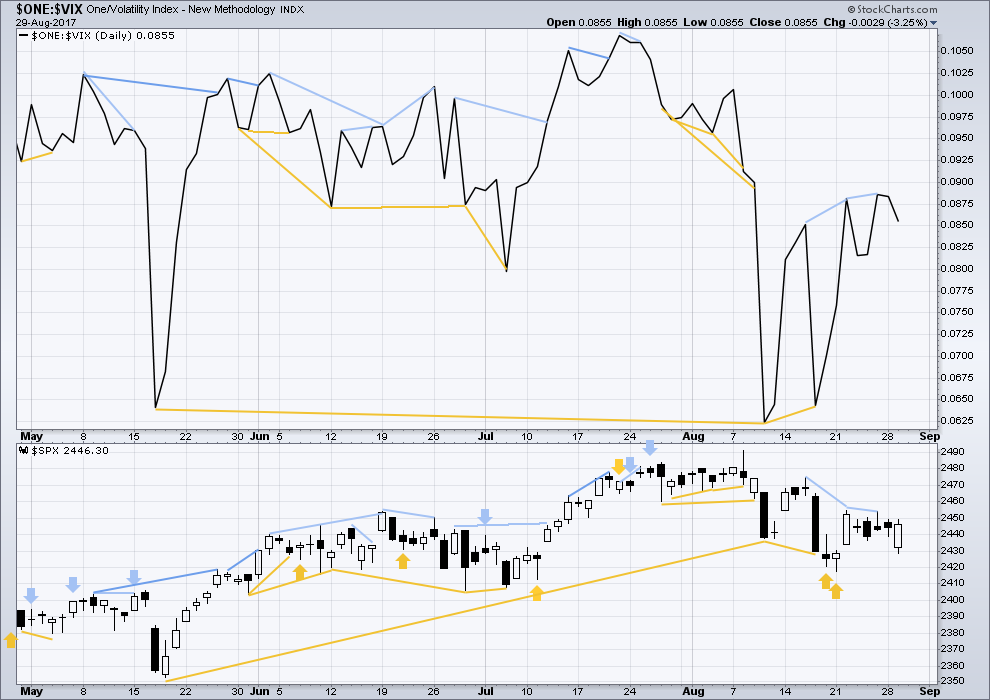
Normally, volatility should decline as price moves higher and increase as price moves lower. This means that normally inverted VIX should move in the same direction as price.
There is no new divergence today.
BREADTH – AD LINE
Click chart to enlarge. Chart courtesy of StockCharts.com.
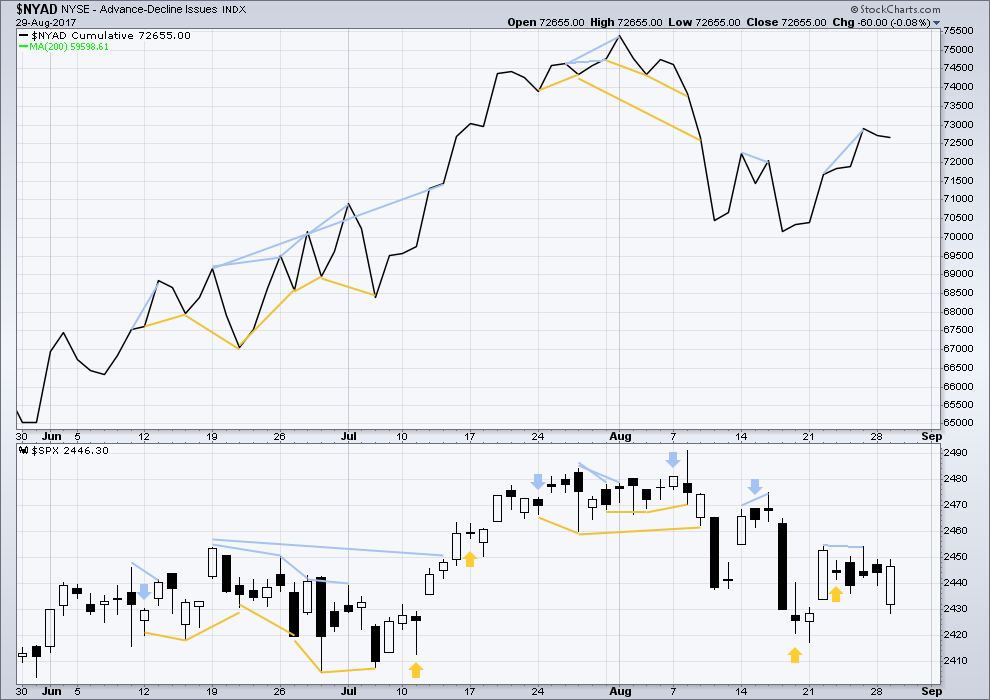
With the last all time high for price, the AD line also made a new all time high. Up to the last high for price there was support from rising market breadth.
There is normally 4-6 months divergence between price and market breadth prior to a full fledged bear market. This has been so for all major bear markets within the last 90 odd years. With no divergence yet at this point, any decline in price should be expected to be a pullback within an ongoing bull market and not necessarily the start of a bear market.
There is no new divergence today.
DOW THEORY
The S&P500, DJIA, DJT and Nasdaq have all made new all time highs recently.
Modified Dow Theory (adding in technology as a barometer of our modern economy) sees all indices confirming the ongoing bull market.
The following lows need to be exceeded for Dow Theory to confirm the end of the bull market and a change to a bear market:
DJIA: 17,883.56.
DJT: 7,029.41.
S&P500: 2,083.79.
Nasdaq: 5,034.41.
Charts showing each prior major swing low used for Dow Theory are here.
Published @ 11:11 p.m. EST.
The alternate is the one.
I’m going to now have to also consider the idea that the three down could be a wave A. That this up could be a wave B.
It looks far too shallow on the weekly chart for intermediate (A) though. Maybe minor A of a flat for intermediate (A)?
That will be an alternate.
this is now the main count
What about the possibility of a triangle?
I’ll be considering that when I consider the three down could be an A wave, now in a three up for a B wave.
I’d have intermediate (A) unfolding as a flat, which may be wave A of a triangle.
That’ll be an alternate today
Yes I think we are now in a 3,3,5 expanded flat and are in wave b now.
Looks like we are in for a melt-up today.
I suspect quite a few short positions are anchored at the 2470 pivot. The algos will probably try to run those stops with at least an iinta-day breach.
XIV is staying almost flat in this big market push up. And GLD isn’t falling like I would expect given it’s recent contrary action to the market. Both quite divergent I’d say.
FWIW, on the hourly SPX is just hitting the upper keltner channel. The entire move starting yesterday morn started almost exactly on the lower KC. (I use a 21 period KC, in this case with a std. dev. of 2.1.) I note that the end of Aug 21 to end of Aug 22 move did almost the exact same thing.
A move symmetric with the Aug 22 move would put the top at 2460.1 area, I’ll be watching that closely.
2459.21 on that little peak. Not sure if done.
Tagged 2460.10 exact.
2460.1 on the nose on my chart. Not sure we are done yet though.
Well, I posted 45 mins prior to you. Also – this might be tin hat type stuff, but if SPY hits 246.75 between 3 and 4pm EST today. This move will match the exact $ value and time (14 hourly candles) of the previous lower to upper KC move the OP is talking about.
Time and price symmetry is basic market geometry, not tin hat stuff. After all, symmetry is the just most significant fibonacci ratio: 1.0!! And fibo ratios play out in both price and time, so there ya go.
Ah, the power of symmetry. We have a 5 min swing low violated, first time in the entire run up!! Next confirmation of end of trend I want to see is bullish symmetry violated, that is, a move down larger than the largest downmove in the run up. That’ll happen just about as the run up trend line is getting busted too. Perhaps though the push will continue to end of day.
This looks like 30 minutes of development of a (final??) 4 wave. In which case, the 5 wave pops tomorrow morning, takes us into Lara’s target zone, and this monster move finishes. Keeping powder dry…
Bullish symmetry doesn’t break until price gets below 2454.80 or so. That’s well under a break of the trend line of this move. Also, if the bull symmetry is broken, price will also have pushed back inside the upper keltner channel. Until all of these happen, gotta view pullbacks as merely pullbacks (probably little 4 waves), not trend change, IMO.
Price has blown through the hourly keltner channel. Last time that happened was Aug 8. That was the all time high final push, and we all know what immediately followed that one.
The surrender of the 2470 pivot was a torturous affair going on interminably for weeks. We may be about to see the same with 2440.
Do we have a 5 wave up approaching completion?? (sorry, last v should have parentheses around it as well).
SPX 4 hour MACD had a bullish crossover a few days ago. When this happens the daily just about always follows. The daily MACD is very close to a bullish crossover and it is at a very low point with much upside. If it has a bullish crossover now, which I think will happen, it can be in an uptrend for weeks. This supports the alternate hourly count and even portends a much more bullish scenario with new ATH’s on the near term horizon.
This morning, the talking heads on Bloomberg were commenting on the massive short positions accumulated by some large hedge funds. Sounds like a big short squeeze in on the horizon. This is one time it might not be prudent to “hold on to your shorts”.
Very much appreciate the caution!! Meanwhile, 2nd reject at main channel line. If broken I shall “submit”, with intention to reload all and more higher, in which case, every point up is worth $$!!
At what point do you consider it broker? It’s looking just about broken to me at this point.
It’s broken now of course. I suspect by the end of the day we’ll view it as a “throw-over”, because I expect a turn and a decent sharp initial sell-off.
Yes, the main hourly channel line is now broken. Lara wrote in above daily commentary regarding the main hourly count,
“If upwards movement breaks above the upper edge of the base channel tomorrow, then use the alternate below, even before invalidation.”
That means she is expecting upwards movement before any significant downwards movement. Her target range is 2466 to 2477.
Indeed. I am flat, awaiting a turn and initiation of a fresh leg down. It’ll happen when it happens, but IMO it’s just about due. I can count 5 waves up here, and multiple markets hitting some resistance areas. I see XIV isn’t moving up last 20 minutes with market, and GLD isn’t moving down. Little signals to me that this move is approaching doneness. I will wait though for the actual turn.
“If it has a bullish crossover now, which I think will happen, it can be in an uptrend for weeks. This supports the alternate hourly count and even portends a much more bullish scenario with new ATH’s on the near term horizon.”
If we hit new ATHs we are still in P3, not P4. Then Lowry’s would be wrong, and neither wave count is correct.
Jimmy,
I am just giving my opinion which is simply that, an opinion. All members are best to follow and pay heed to Lara’s commentary and analysis. She is the professional not me. But you are correct, any new ATH would invalidate the current counts. I made the comment about new ATH’s because of the daily On Balance Volume bullish break.
I meant no offense, just pointing out that new ATHs are not consistent with any of the wave counts here. I too believe there is a possibility we head to new ATHs.
No offense taken. I didn’t even think that. So no worries at all. Thanks for your participation.
My take (utterly meaningless and valueless, just commentary) on what’s up here is that the Big Money is quietly selling to the retail crowd who are buying the dip. A push back down will start up, driven by the big money, as soon as the retail crowd buy pressure starts dropping. The big money might have even started the whole push up yesterday morning to get things going, after manipulating the market down overnight to set up the attractive dip for the retailers. However, they all know that we are this wave 4, and this is the optimal way for them to handle it: create up moves and distribute, rinse and repeat.
This crossover seems to be a bit different. Most other signals are showing overbought here… while in previous crossovers, they were not. (First week of April appears to be most similar to now. In April, it sputtered out for a few weeks)
going down but not sure this is impulsive. But then again if this only wave 1 of wave c not sure there is enough room above for this c wave to play out?
Wow, the break in on balance volume has me quite alarmed. Last time we saw that we broke another 40 points higher within days. There is no more resistance beyond it. RUT closed above its 200dma. SPY closed just below the 50dma. If tomorrow is a green day I am half convinced we may not have seen the end of P3. The “buy the dip” mentality is too strong in this market.
If that’s the case Lowry’s would be wrong though.
Not sure I’d be betting against them… just yet.
Their measures of supply and demand are just too objective.
yo, first here