
Bearish divergence noted in last analysis between price and breadth and price and volatility has been followed by a downwards day. This was expected.
Summary: The bigger picture sees the S&P now in a primary degree pullback to last a minimum of 8 weeks and find support at the maroon channel on the weekly chart.
Watch the upper blue trend line on the main hourly chart carefully. If price breaks above it, then look for upwards movement to end somewhere in the zone of 2,466 to 2,477. A new high above 2,453.71 would provide price confidence in this view.
However, the short term trend remains the same (down) until proven otherwise. Assume new lows are ahead while price remains below the blue trend line.
The short term target for a third wave down is still at 2,389.
If price moves above 2,474.93, then use the alternate hourly chart.
Last monthly and weekly charts are here. Last historic analysis video is here.
ELLIOTT WAVE COUNT
WEEKLY CHART
Click chart to enlarge.
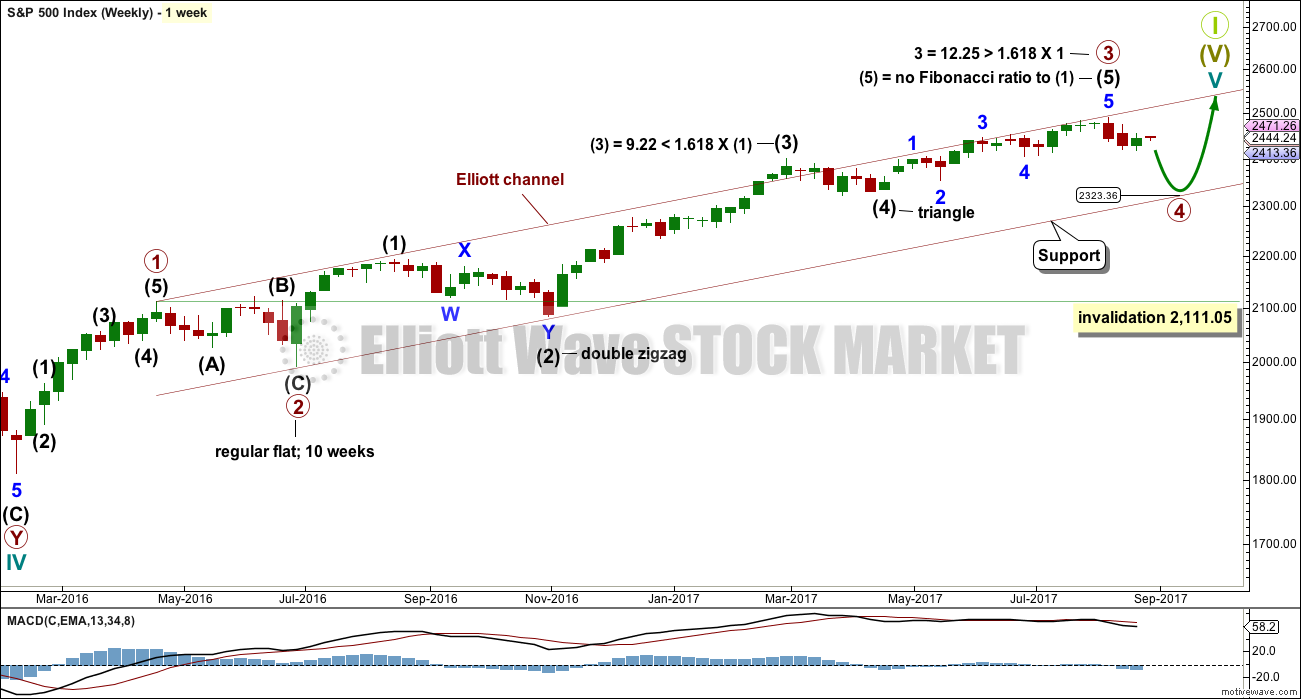
Primary wave 3 now looks complete. Further and substantial confidence may be had if price makes a new low below 2,405.70, which is the start of minor wave 5 within intermediate wave (5). A new low below 2,405.70 may not be a second wave correction within an extending fifth wave, so at that stage the final fifth wave must be over. Fibonacci ratios are calculated at primary and intermediate degree. If primary wave 3 is complete, then it still exhibits the most common Fibonacci ratio to primary wave 1.
Primary wave 4 may not move into primary wave 1 price territory below 2,111.05.
Primary wave 4 should last about 8 weeks minimum for it to have reasonable proportion with primary wave 2. It is the proportion between corrective waves which give a wave count the right look. Primary wave 4 may last 13 or even 21 weeks if it is a triangle or combination. So far it has lasted only two weeks.
If primary wave 4 reaches down to the lower edge of the Elliott channel, it may end about 2,325. This is within the range of intermediate wave (4); fourth waves often end within the price territory of the fourth wave of one lesser degree, or very close to it.
The final target for Grand Super Cycle wave I to end is at 2,500 where cycle wave V would reach equality in length with cycle wave I. If price reaches the target at 2,500 and either the structure is incomplete or price keeps rising, then the next target would be the next Fibonacci ratio in the sequence between cycle waves I and V. At 2,926 cycle wave V would reach 1.618 the length of cycle wave I.
DAILY CHART
Click chart to enlarge.
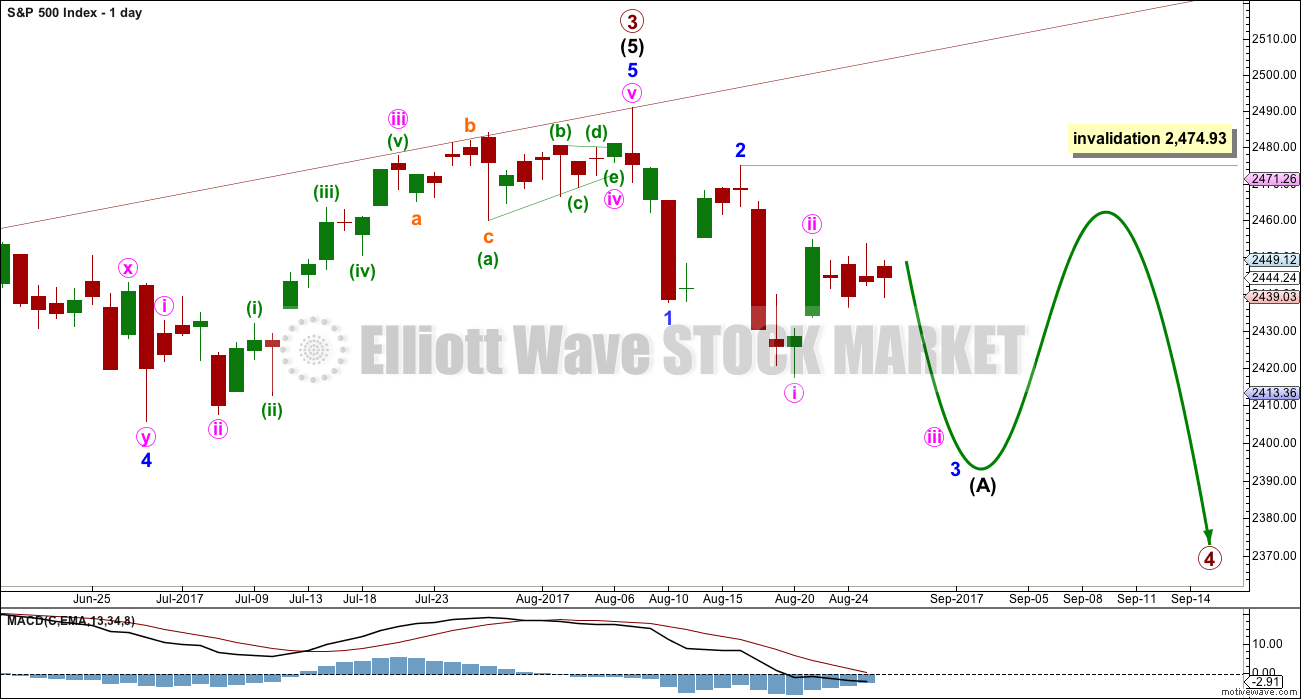
The daily chart will now focus in on the unfolding structure of primary wave 4.
Primary wave 2 was a regular flat correction lasting 10 weeks. Given the guideline of alternation, primary wave 4 may most likely be a single or double zigzag. Within both of those structures, a five down at the daily chart level should unfold. At this stage, that looks incomplete.
While primary wave 4 would most likely be a single or double zigzag, it does not have to be. It may be a combination or triangle and still exhibit structural alternation with primary wave 2. There are multiple structural options available for primary wave 4, so it is impossible for me to tell you with any confidence which one it will be. It will be essential that flexibility is applied to the wave count while it unfolds. Multiple alternates will be required at times, and members must be ready to switch from bear to bull and back again for short term swings within this correction.
While intermediate wave (A) is labelled as an unfolding impulse, it may also be a diagonal. Both structures are considered at the hourly chart level.
Intermediate wave (A) may also be a zigzag if primary wave 4 is to be a triangle. So far it is possible a zigzag downwards could be complete, but it is not deep enough for wave A of a triangle when it is viewed on the weekly chart. And so that possibility will not be considered at this time.
MAIN HOURLY CHART
Click chart to enlarge.
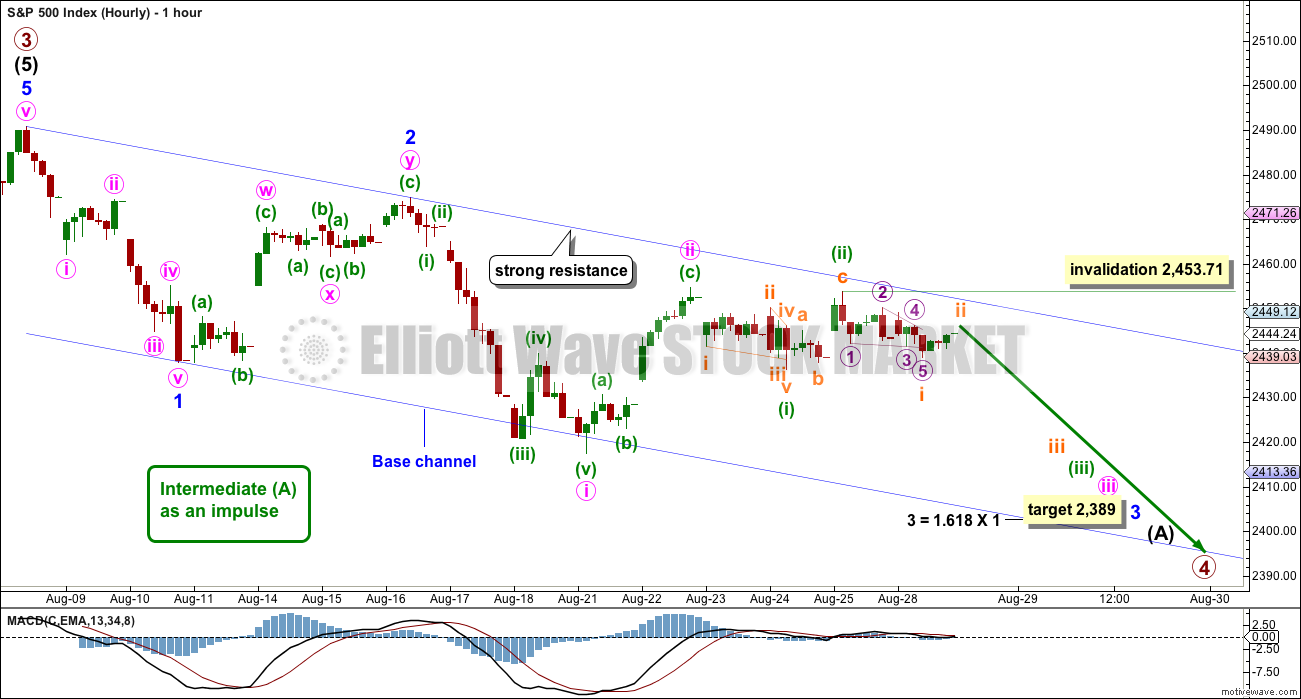
Minor wave 1 downwards looks very clear as a five wave structure.
Minor wave 2 upwards ended just above the 0.618 Fibonacci ratio. Minor wave 3 downwards has now made a new low below the end of minor wave 1, meeting the Elliott wave rule.
Minor wave 3 now exhibits slightly stronger momentum than minor wave 1. A further increase in downwards momentum would be expected.
Minuette wave (i) will fit as a leading contracting diagonal. Minuette wave (ii) may now be a completed deep zigzag.
Another leading contracting diagonal may have completed today for subminuette wave i. Subminuette wave ii may not move beyond the start of subminuette wave i above 2,453.71.
If price moves higher above the upper edge of the base channel, then the alternate below should be preferred as soon as that trend line is breached and before the invalidation point is passed.
The target expects minor wave 3 to be an extension. When third waves extend, they do so both in price and time. They often show their subdivisions at higher time frames, which is why minute waves ii and iv may show up on the daily chart.
Minute wave iii may also be extending; it is common for the middle of third waves to extend and be stretched out. With minute wave iii extending, it too may show its subdivisions at the daily chart level.
ALTERNATE HOURLY CHART
Click chart to enlarge.
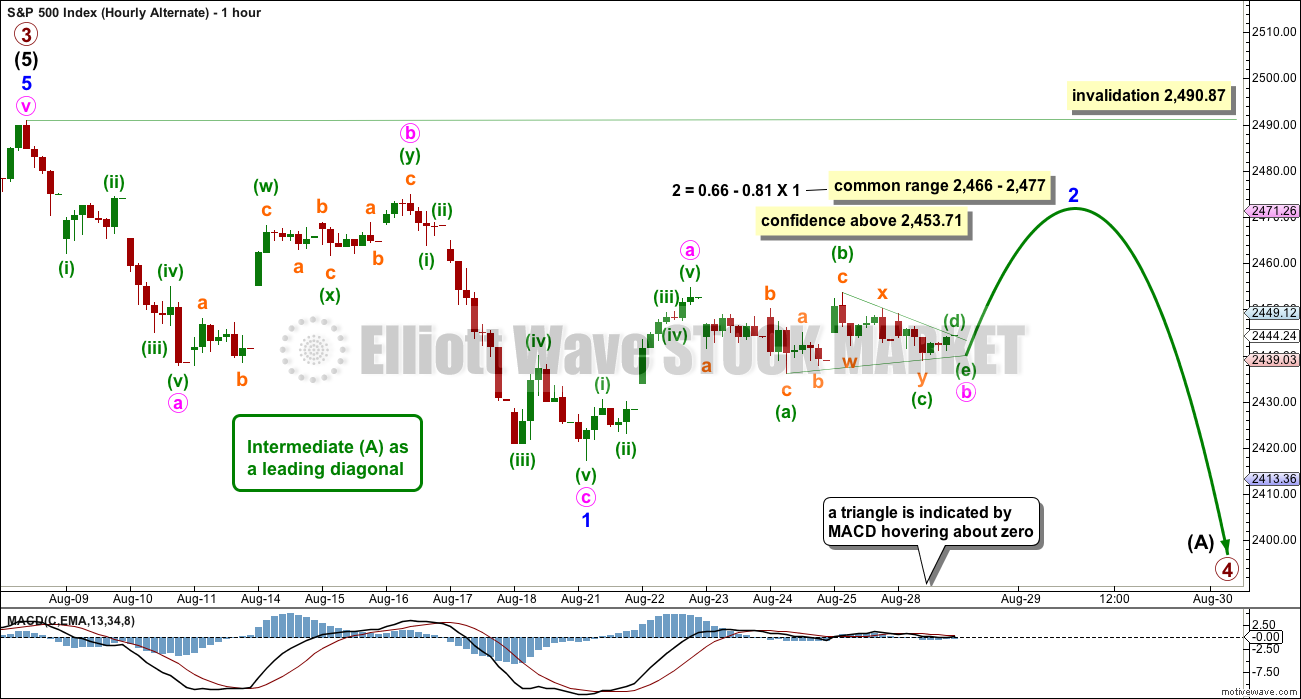
If the base channel on the main hourly chart is breached by upwards movement, use this alternate.
The other possible structure for intermediate wave (A), if it is to be a five, would be a leading diagonal. These are not as common as impulses, so this must be an alternate wave count judged to have a lower probability than the main wave count. However, low probability does not mean no probability. All possibilities should be considered.
Within leading diagonals, the first, third and fifth waves are most commonly zigzags. They may also appear to be impulses. Here, minor wave 1 will fit as a zigzag.
Second and fourth waves must be zigzags. Minor wave 2 may not move beyond the start of minor wave 1 above 2,490.87.
Sideways movement of the last four sessions fits well as a triangle. This is supported by MACD hovering about zero. So far the triangle adheres well to its trend lines; this looks correct. If a triangle is unfolding as it is labelled here, then the breakout should be upwards.
Second and fourth waves within diagonals are usually very deep; a range is given for the common depth.
Minor wave 3 would have to move below the end of minor wave 1 at 2,417.35. Minor wave 3 downwards of a leading diagonal should still exhibit an increase in downwards momentum and should still have support from volume.
TECHNICAL ANALYSIS
WEEKLY CHART
Click chart to enlarge. Chart courtesy of StockCharts.com.
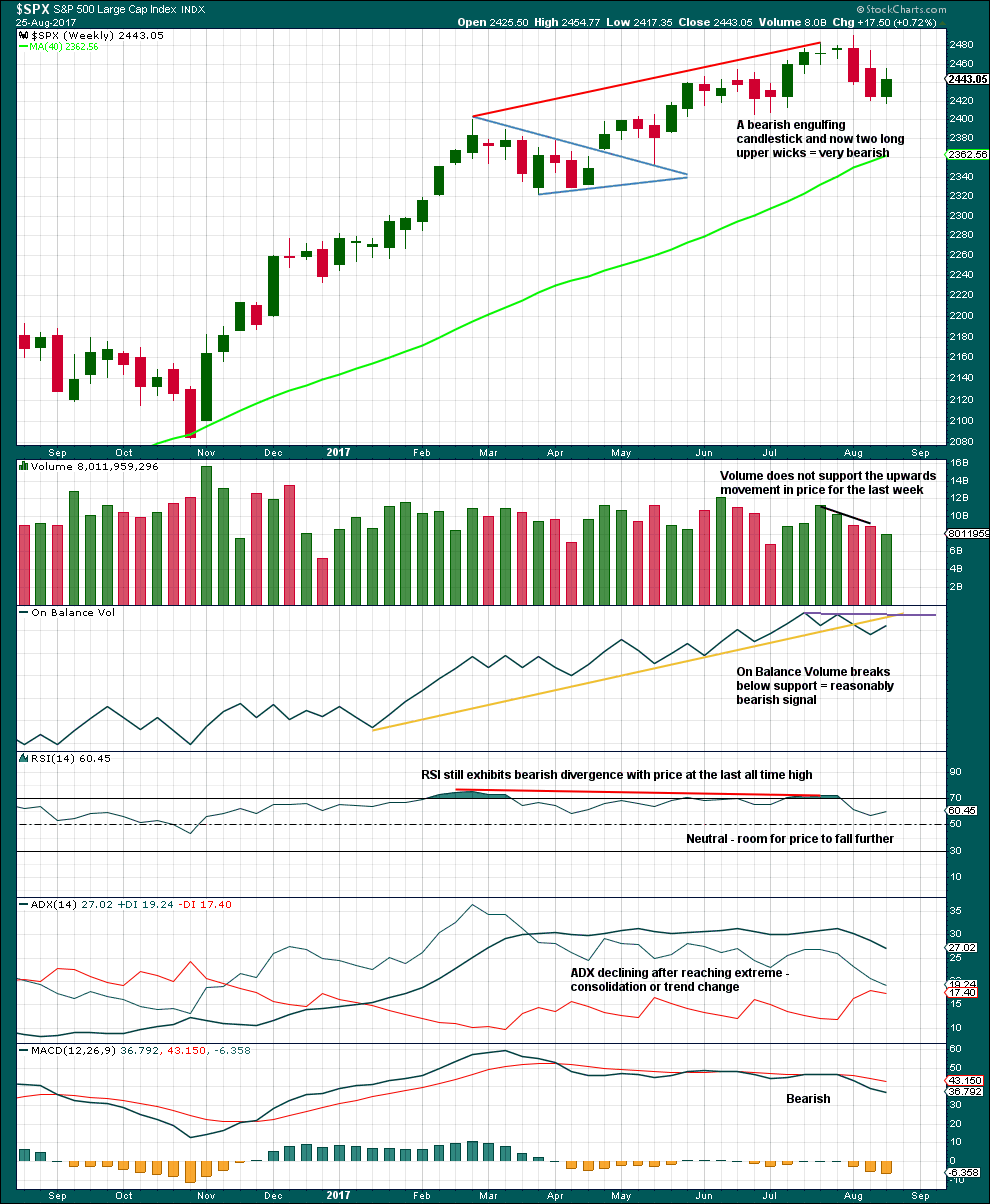
Last week has made a lower low and lower high, but the candlestick closed green and the balance of volume was upwards. Lighter volume does not support the rise in price during the week.
ADX had been extreme for a long time and is now declining. The black ADX line is now declining but has not yet been pulled down below both directional lines, so the consolidation or pullback may be expected to continue.
DAILY CHART
Click chart to enlarge. Chart courtesy of StockCharts.com.
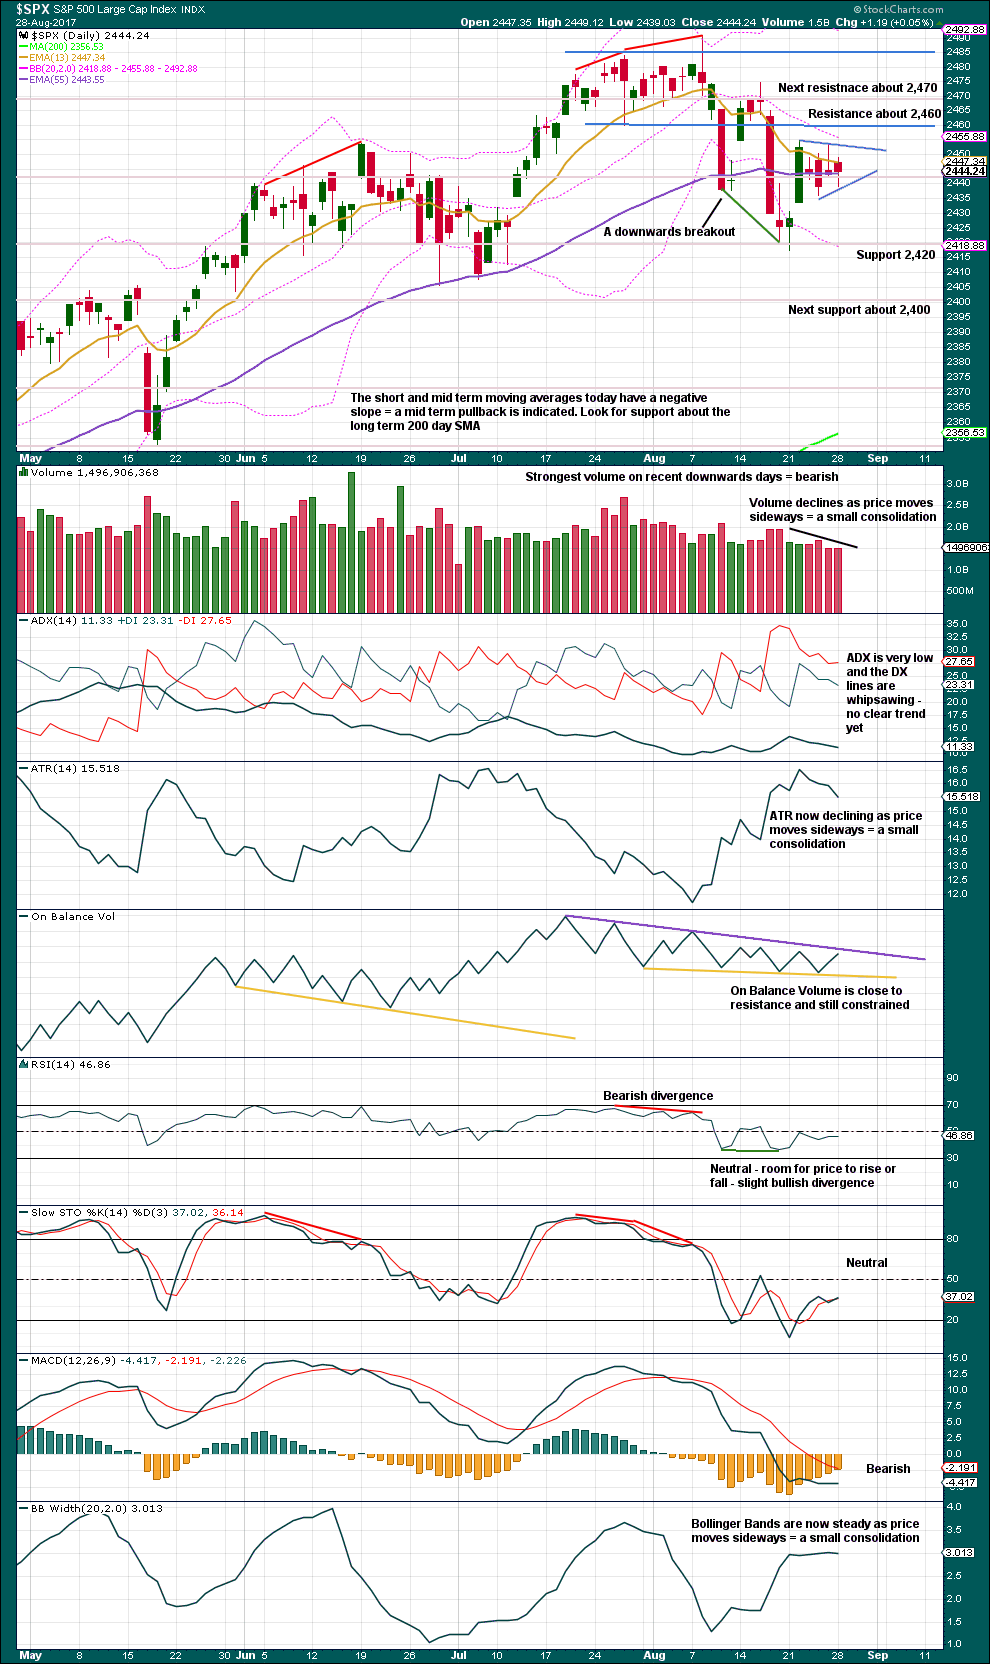
For the last four sessions, price has been moving sideways and volume overall has been declining. A small pennant pattern may be forming. But volume is strongest on a downwards day within this small consolidation suggesting a downwards breakout is more likely. However, the pennant pattern suggests an upwards breakout.
A target using the measured rule for the possible pennant would be about 2,487.
On Balance Volume suggests that any upwards movement may be limited. Watch On Balance Volume carefully over the next few days. A breakout there may indicate the next direction for price.
VOLATILITY – INVERTED VIX CHART
Click chart to enlarge. Chart courtesy of StockCharts.com.
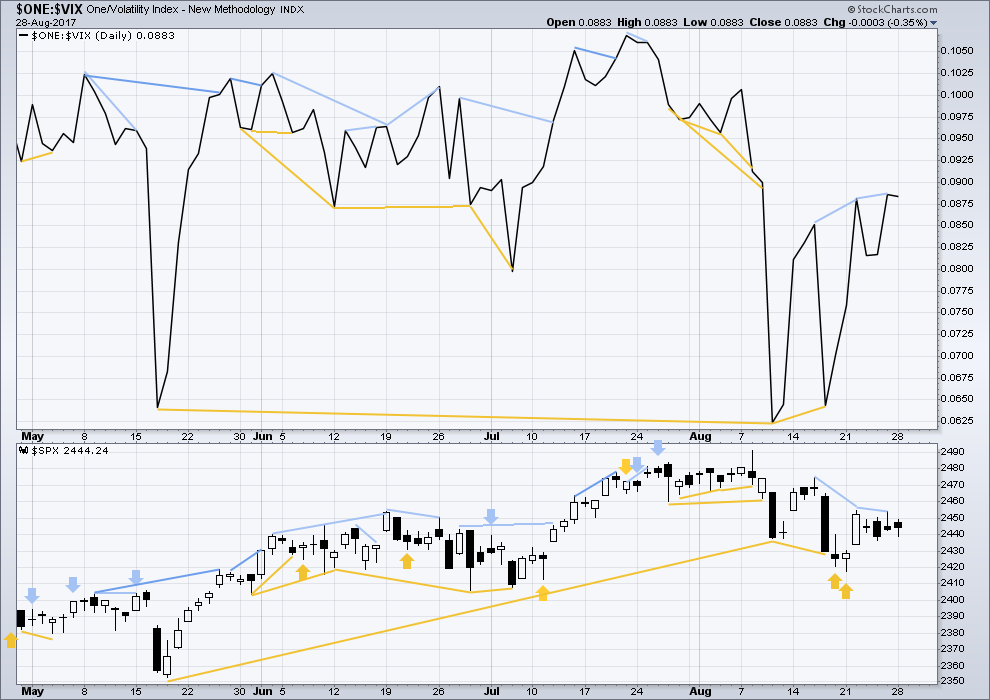
Normally, volatility should decline as price moves higher and increase as price moves lower. This means that normally inverted VIX should move in the same direction as price.
Bearish divergence noted in last analysis between price and inverted VIX has now been followed by one downwards day. It may now be resolved, or it may need one more downwards day to resolve it. There is no new divergence today.
BREADTH – AD LINE
Click chart to enlarge. Chart courtesy of StockCharts.com.
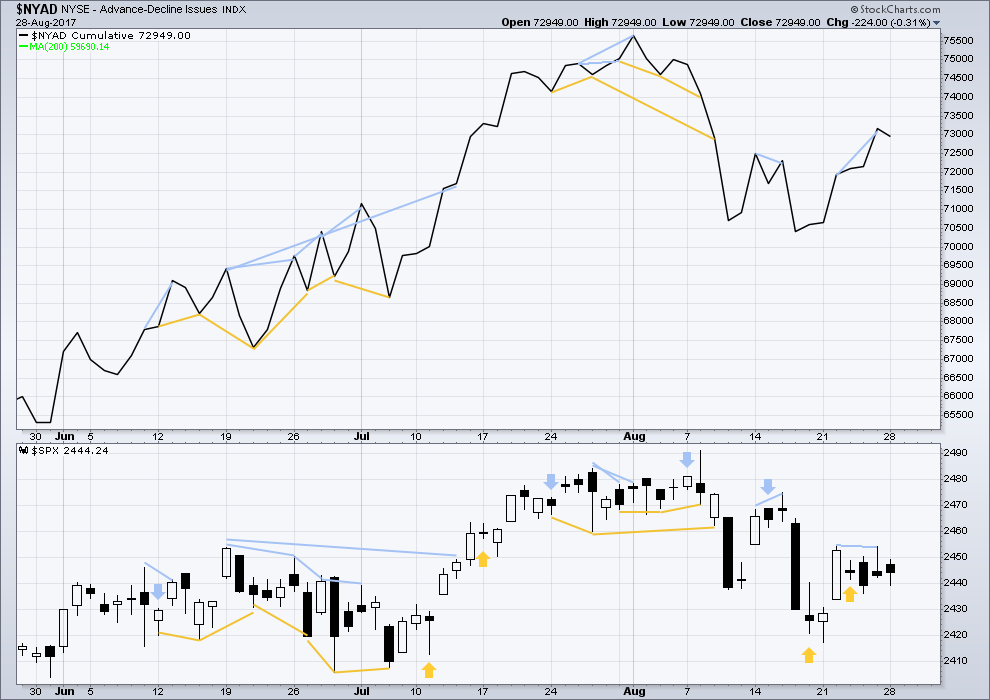
With the last all time high for price, the AD line also made a new all time high. Up to the last high for price there was support from rising market breadth.
There is normally 4-6 months divergence between price and market breadth prior to a full fledged bear market. This has been so for all major bear markets within the last 90 odd years. With no divergence yet at this point, any decline in price should be expected to be a pullback within an ongoing bull market and not necessarily the start of a bear market.
Short term bearish divergence noted in last analysis has now been followed by one downwards day. It may be resolved here or it may need one more downwards day to resolve it. There is no new divergence today between price and the AD line.
DOW THEORY
The S&P500, DJIA, DJT and Nasdaq have all made new all time highs recently.
Modified Dow Theory (adding in technology as a barometer of our modern economy) sees all indices confirming the ongoing bull market.
The following lows need to be exceeded for Dow Theory to confirm the end of the bull market and a change to a bear market:
DJIA: 17,883.56.
DJT: 7,029.41.
S&P500: 2,083.79.
Nasdaq: 5,034.41.
Charts showing each prior major swing low used for Dow Theory are here.
Published @ 09:50 p.m. EST.
[Note: Analysis is public today for promotional purposes. Member comments and discussion will remain private.]
Okay, have spent some time this morning on the 5 minute chart looking at the recent chop and trying to make some EW sense of it…
For the alternate I can make it work and meet all rules, and mostly have the right look too.
zooming in on minute b down to the five minute level:
the biggest problem here is minuette (b) is a double zigzag, but the second zigzag hasn’t deepened the correction
but so far this is the only wave count at this level that I can see that meets all EW rules and avoids expanded flats with B waves well longer than 2X their A waves….
May I say Lara, your precise application of the rules, as well as, you’re willingness to find/interpret correct counts is fantastic.
thank you very much Chris 🙂
I prefer this count. Both SPX and QQQ can head up and close their respective gaps before resuming the downtrend. In addition, they can use the light volume this week to push it up easy, and close out the month on a high note.
What gaps are you talking about? I don’t see any gaps on SPX or NDX at the daily level.
QQQ had gapped down at 144.25 area. Doesn’t matter any more as we clearly blew past that.
updated hourly chart:
so far the base channel holds
I do not like this expanded flat for subminuette ii at all. micro B is over 3 X micro A
it doesn’t breach any EW rules, but it’s highly unusual
will now begin to look for a better wave count for this movement, but so far I’m stumped
finally a solution.
for those of you who are interested in the smaller subdivisions on the five minute chart
I had to do this exercise to see if it would all fit
that sideways chop is a horrible mess
Wow… amazing work here, Lara!
Based on Lara’s hourly chart, it appears price reach the upper edge of the Elliot channel today finally and has since bounced down a tad. Yesterday’s action saw price fall just short of the upper edge and then we got the deep decline in after hours followed by a rather steady rebound through this morning. I think Lara’s 2453 pivot remains significant going forward although I am markedly more bullish today given the strong rebound from the morning lows.
did we just boink into that upper channel line?
Not on my chart, but very, very close. $1 away.
yes, I think we did
we have a new technical term here, it’s “boinked” the upper trend line 🙂
The problems you encounter when looking at my ‘normal’ SPX chart and not the elliott chart.
https://youtu.be/28GLa9T2CtI
rofl 🙂 🙂 🙂
rofl 😀
maybe mister market was wearing a hat today,, hee hee
On my chart, yes. But we nearly hit it yesterday, and yet this morning’s lows were rejected with breadth and volume. Tomorrow should be a key pivot point.
Last wave up could have been wave c of an expanded flat
what about the alternative of i at today’s low?
I cannot see how that would work without breaking key rules (unless you mean an expanding leading diagonal?).
This move up today looks impulsive to me (so either a wave c or the start of something else)
If you post a chart I’ll check it out.
It seems when I post a chart it goes into moderation and gets delayed posting. But not necessary here, everything identical to your chart except i is under today’s low, and the push up is ii in process. What rule(s) would that violate? I don’t see any issue offhand but still learning here.
Waves 1 & 4 would hit each other in that count – but that would be ok if it were an expanded leading diagonal. Both could be right but I favour(ed) an expanded flat as this move up looked like an impulsive c wave to me.
For your count (if I understand what you are seeing correctly) we’d need an abc 3 legger back up from todays low (so if we get that without taking out the 2435 high, your count was on the money 🙂 )
TBF – the b wave of my count is more than twice that of wave a so that does reduce the probability that count is correct.
Actually I just tried to chart an expanded leading diagonal from 2454 high and I cannot get it to work. Maybe there is something I’m not seeing but I cannot make ‘i’ work at todays low atm.
Wave ‘i’ needs to be either a 5 legger (impulse) or a leading diagonal. I cannot count either from the 2454 high atm
Nice Olga! However I’m torn as both a CMT and Fund Manager, in so far the effects of the central banksters training the algos to buy and therefore it’s weakening of tried and true technical patterns, wave theory, and other such measures. I do realize that prevailing theory is that they are part of the herd, but I also respect that it is possible we are making new history here with the attempt to nationalize the markets. My half pence….
Yep – I hear ya! 😀
Algo’s are no different than human traders using formal and strict trading rules. All part of the melting pot of the market, and doesn’t change the market’s fundamental nature a whit. IMO. That said, in very light volume, some market manipulation to optimize accumulation and/or distribution strategies is probably quite achievable by the larger/largest market participants. They might even collude (implicitly, not explicitly) in doing so. But that too is within the fundamental nature of the market. Market reversal and surprises happen. The largest bull market in history takes a bit of time to break down!! It’s coming. Contrary to so many calls of “it’s different this time!” over the years…it’s not different this time.
I get what you’re saying Kevin, and my fund is 75% Algo/AI so I’ve been deep in that space since I was 22, 36 now unfortunately. I do very much agree that the low volume allows for these tortuous rising wedges all over the place, that I believe are characteristic of the market manipulation. Again, just my opinion.
Trying to rationalize the hourly main: last Friday’s high was the top of minute ii, and today’s low is the bottom of minuette i of minute iii. Yet more 1-2 structures, at finer and finer time scale. Possible. I’m extremely curious to see how the remainder of the day plays out.
That’s an awfully long b wave Lara.
you mean minuette (b) on the main hourly?
long in duration is fine, B waves are the most complicated
longer than 2X A in price isn’t fine
Lara,
How about considering the 3 wave structure down from all time high a 5-3-5 A wave. Now we are doing a 3 wave up which could take us to 2466-2479, with todays low a b wave within it. I like this better than a leading diagonal structure for A as that would take a long time to play out and would likely see primary 4 lasting longer than 8 weeks.
This count would see a high for B wave in next few days going into labour day long weekend when markets normally melt up. Then most of September would reflect C wave down. As you say there are so many possibilities including combinations but the leading diagonal for just wave A would be a long drawn out process.
I have considered it and discarded the idea at this time. Because when you look at it on the weekly chart that would mean that wave A of primary 4 lasted only two weeks and is incredibly shallow, barely has it corrected anything.
It looks too small.
think we have just finished an ABC zigzag correction – down from here hopefully!
Wild day. Not even able to make a Elliott prediction.
NK missiles over Japan, a US president with serious criminality and competency issues, the biggest natural disaster to hit the US in history…and the market RALLIES in big reversal??? I’m not buying it. Literally, not buying it. The market going back to bull mode here is inconceivable. Unless it does.
Well that’s it. Frantic buying on the Nasdaq has me convinced that P3 is not here and we will see a continued push upwards in the short term future. Is there any wave count on the hourly or daily level and makes sense with this price action? There is internal strength in RUT and the bollinger bands on SPX are tightening again. That shouldn’t happen in a primary degree correction, should it? In the very least, it seems like the P3 is at least a few weeks off, and we are seeing the hourly alternate and muddle up the daily wave count.
that’s just not enough upwards movement within one day to change the view that P4 is here
Nasdaq has been making lower lows and lower highs since 27th July
DJT since 14th July
and DJIA since 8th August
for now, for all, the trend is down for a pullback within the ongoing bull market
On the hourly alternative, I presume the low today is “b”, and now we have a “c” target that is somewhere significantly up and to the right. On the main, could the low today be the subminutte i, and this pullback is subminuette ii? Or, the low today is the bottom of minuette 3?
My hourly main take (15 minute bars here). Optimistic to the short side, I know!
Kabosh!!
This is very Banksteryyy, luckily I tagged my VIX gains late last night. Re-loading pretty soon methinks.
Lara has the downside target at 2389; over what timeframe do we expect that to unfold, and how quickly will we get the ensuing bounce? What is the potential end-of-week target? Is anyone trying to swing trade this potential whipsaw as it develops?
I’m changing the target. I’m removing the one for minor 3, and adding one for minute iii
2,362 is the new target, it may now be met in another 8 sessions if minute iii lasts a Fibonacci 13 sessions total
lol!
I am becoming the perfect contrarian indicator for when an anticipated decline is about to unfold. Closed my short SPY put happily. Today should be a good day for those of us who patiently waited… ç:)
Overnight futures down 0.6%. Hopefully we can forget about pennants and triangles and breaks upward and get on with some good old fashion high impulse action here. I’m in and I’m hungry.
Cashed my entire short position 30 seconds after open guessing a significant bounce was coming. And bought back in 2x on the stall at the top. Guessing again (!!??) that the remaining SPX gap will not get filled…until a few months from now when wave 5 come roaring back up! We’ll see. If it’s filled now , eh, I have a longer term short hold…more 4 wave MUST be coming!!! And my third guess is that the big/smart money was and is also waiting for this bounce to start unloading more aggressively today. Hoping so!!
The low this morning is a very reasonable bottom of subminuette 3. Subminuette 2 took almost 3/4 of a trading day to complete, assuming we are now in subminuette 4. So perhaps late today, we see subminuette 5 push down. Note that if the main hourly stays correct, this push back up can’t exceed yesterday’s low (subminuette 1) at 2439.16
The size (in price) of the low to high so far today (subminuette 4 I believe) is exactly the size at this point of subminuette 2. May not hold but symmetry is so incredibly common.
Ooops. Short squeeze!!! And back into the “consolidation zone”. It’s a jumbled mess now.
Ha!
you were beaten by Ronald by 15 minutes 🙂
hi