
Another small sideways day completes a Shooting Star candlestick pattern.
Summary: The bigger picture sees the S&P now in a primary degree pullback to last a minimum of 8 weeks and find support at the maroon channel on the weekly chart.
For the short term, divergence at the end of this week between price and inverted VIX and the AD line is bearish. This supports the idea of downwards movement Monday and / or Tuesday at least.
The short term target for a third wave down is still at 2,389.
If price moves above 2,474.93, then use the alternate hourly chart.
Trading Advice:
Use bounces as an opportunity to enter the downwards trend. Always use a stop. For shorts, at this time it may be either just above the upper edge of the base channel on the main hourly chart, or just above the all time high (this for members with a higher risk appetite who may be prepared to hold underwater positions for a few days).
To manage risk invest only 1-5% of equity on any one trade. And always use a stop.
New updates to this analysis are in bold.
Last monthly and weekly charts are here. Last historic analysis video is here.
ELLIOTT WAVE COUNT
WEEKLY CHART
Click chart to enlarge.
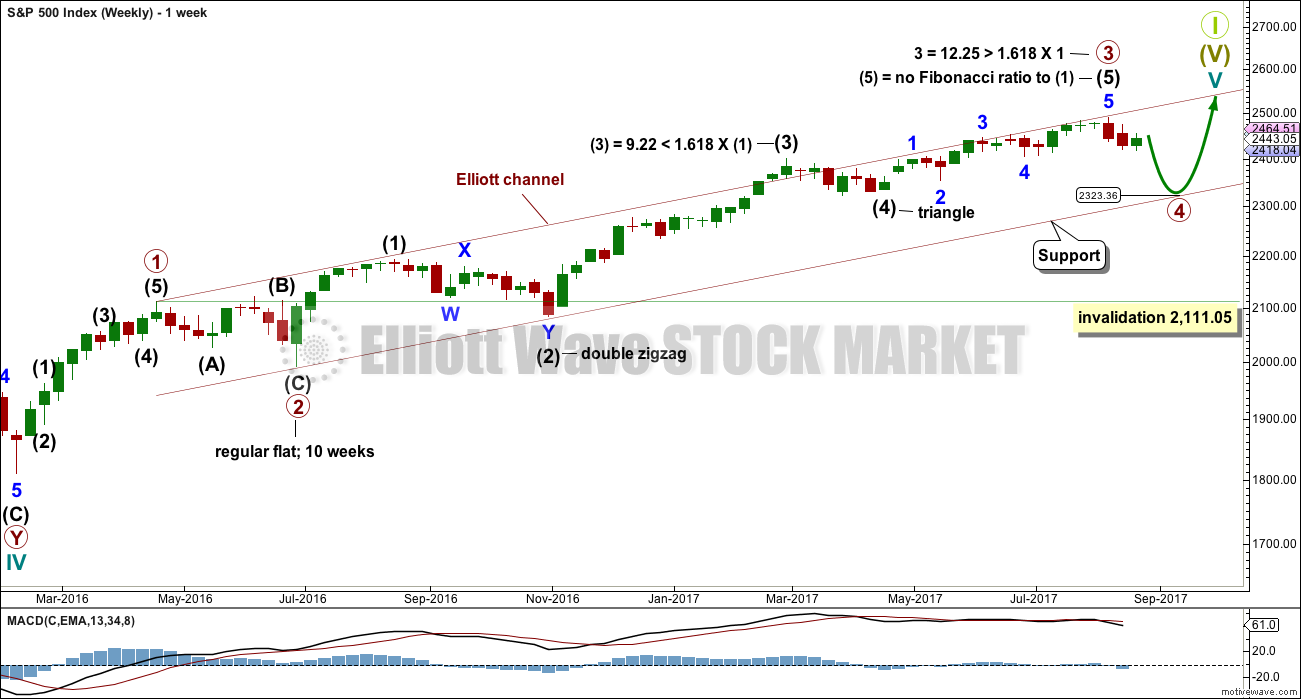
Primary wave 3 now looks complete. Further and substantial confidence may be had if price makes a new low below 2,405.70, which is the start of minor wave 5 within intermediate wave (5). A new low below 2,405.70 may not be a second wave correction within an extending fifth wave, so at that stage the final fifth wave must be over. Fibonacci ratios are calculated at primary and intermediate degree. If primary wave 3 is complete, then it still exhibits the most common Fibonacci ratio to primary wave 1.
Primary wave 4 may not move into primary wave 1 price territory below 2,111.05.
Primary wave 4 should last about 8 weeks minimum for it to have reasonable proportion with primary wave 2. It is the proportion between corrective waves which give a wave count the right look. Primary wave 4 may last 13 or even 21 weeks if it is a triangle or combination. So far it has lasted only two weeks.
If primary wave 4 reaches down to the lower edge of the Elliott channel, it may end about 2,325. This is within the range of intermediate wave (4); fourth waves often end within the price territory of the fourth wave of one lesser degree, or very close to it.
The final target for Grand Super Cycle wave I to end is at 2,500 where cycle wave V would reach equality in length with cycle wave I. If price reaches the target at 2,500 and either the structure is incomplete or price keeps rising, then the next target would be the next Fibonacci ratio in the sequence between cycle waves I and V. At 2,926 cycle wave V would reach 1.618 the length of cycle wave I.
DAILY CHART
Click chart to enlarge.
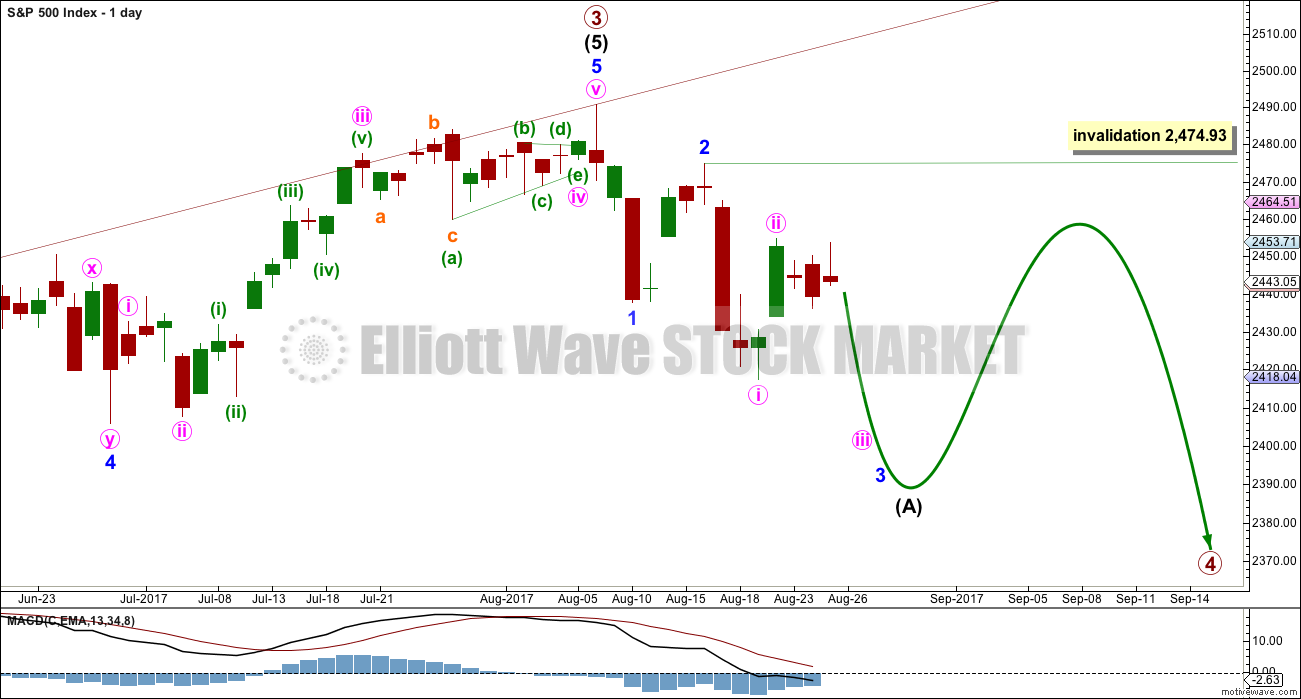
The daily chart will now focus in on the unfolding structure of primary wave 4.
Primary wave 2 was a regular flat correction lasting 10 weeks. Given the guideline of alternation, primary wave 4 may most likely be a single or double zigzag. Within both of those structures, a five down at the daily chart level should unfold. At this stage, that looks incomplete.
While primary wave 4 would most likely be a single or double zigzag, it does not have to be. It may be a combination or triangle and still exhibit structural alternation with primary wave 2. There are multiple structural options available for primary wave 4, so it is impossible for me to tell you with any confidence which one it will be. It will be essential that flexibility is applied to the wave count while it unfolds. Multiple alternates will be required at times, and members must be ready to switch from bear to bull and back again for short term swings within this correction.
While intermediate wave (A) is labelled as an unfolding impulse, it may also be a diagonal. Both structures are considered at the hourly chart level.
Intermediate wave (A) may also be a zigzag if primary wave 4 is to be a triangle. So far it is possible a zigzag downwards could be complete, but it is not deep enough for wave A of a triangle when it is viewed on the weekly chart. And so that possibility will not be considered at this time.
MAIN HOURLY CHART
Click chart to enlarge.
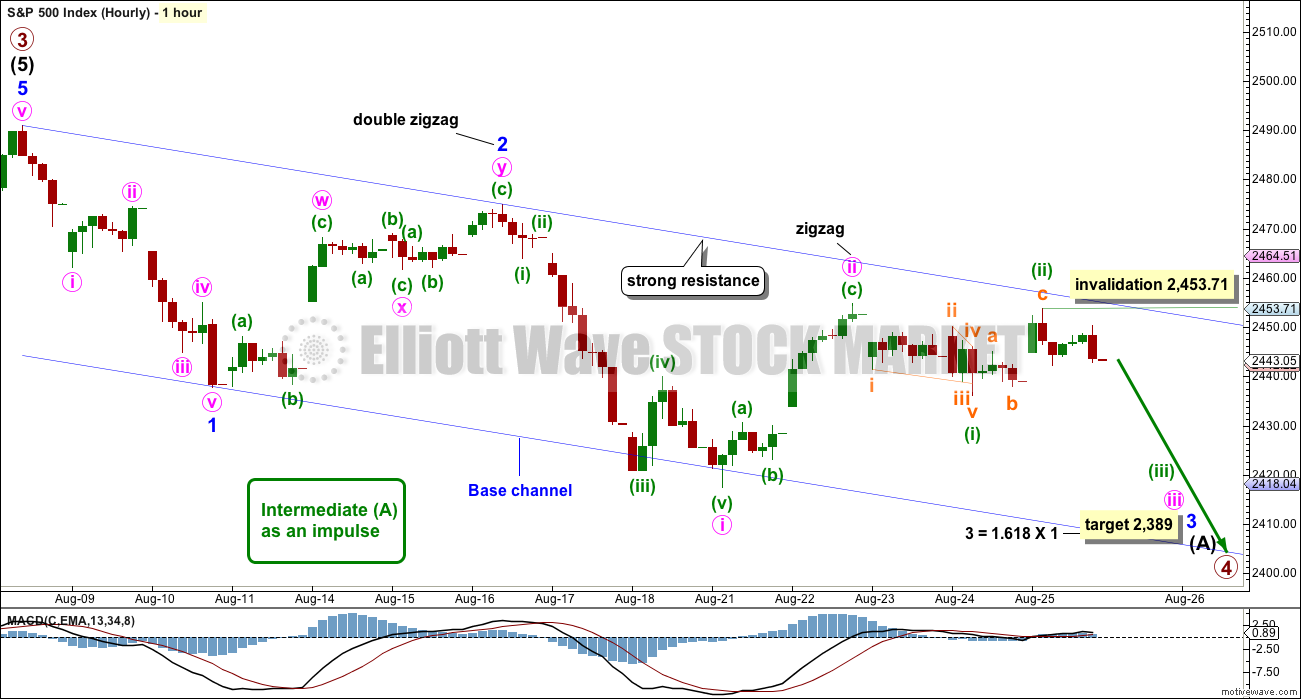
Minor wave 1 downwards looks very clear as a five wave structure.
Minor wave 2 upwards ended just above the 0.618 Fibonacci ratio. Minor wave 3 downwards has now made a new low below the end of minor wave 1, meeting the Elliott wave rule.
Minor wave 3 now exhibits slightly stronger momentum than minor wave 1. A further increase in downwards momentum would be expected.
Within minor wave 3, the wave count is adjusted today back to see minute wave ii over as a zigzag lasting just over one session. Thereafter, minute wave iii may have begun.
Minuette wave (i) will fit as a leading contracting diagonal. Minuette wave (ii) may now be a completed deep zigzag.
This wave count now expects to see an increase in downwards momentum next week.
If price moves higher above the upper edge of the base channel, then the alternate below should be preferred as soon as that trend line is breached and before the invalidation point is passed.
The target expects minor wave 3 to be an extension. When third waves extend, they do so both in price and time. They often show their subdivisions at higher time frames, which is why minute waves ii and iv may show up on the daily chart.
Minute wave iii may also be extending; it is common for the middle of third waves to extend and be stretched out. With minute wave iii extending, it too may show its subdivisions at the daily chart level. So far minuette wave (ii) now may be showing up as a spike for the Shooting Star candlestick of Friday’s session.
ALTERNATE HOURLY CHART
Click chart to enlarge.
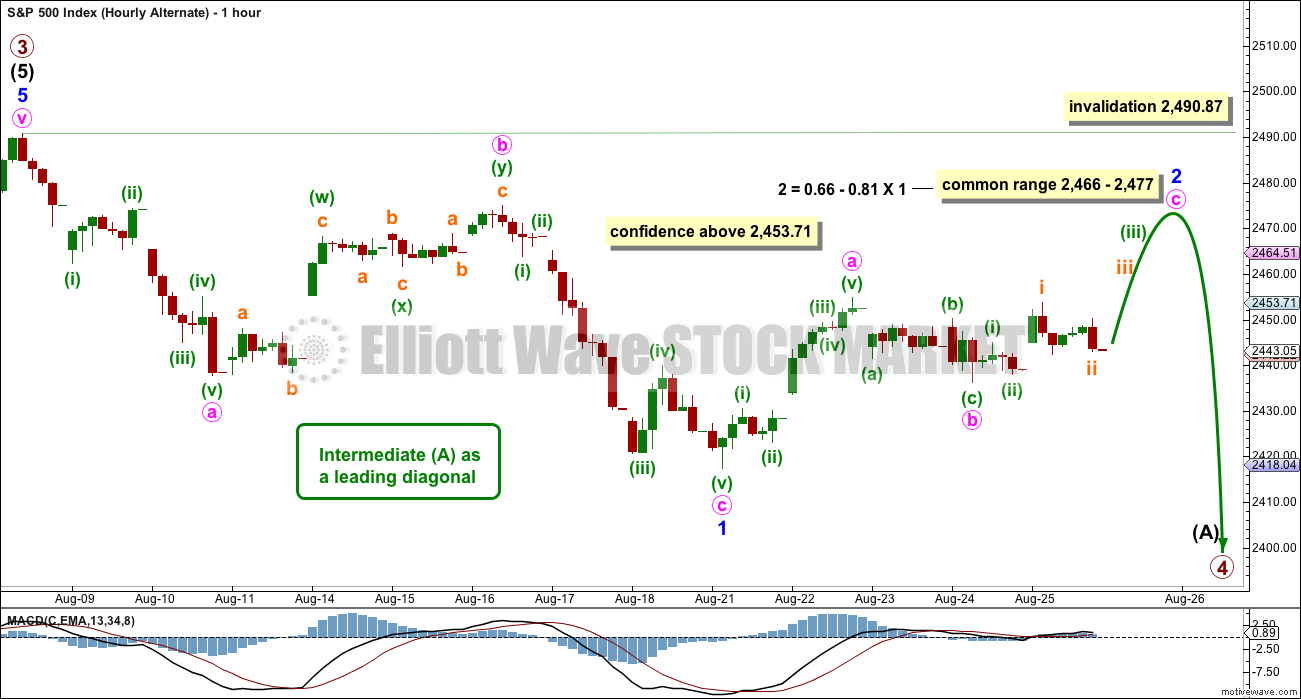
If the base channel on the main hourly chart is breached by upwards movement, use this alternate.
The other possible structure for intermediate wave (A), if it is to be a five, would be a leading diagonal. These are not as common as impulses, so this must be an alternate wave count judged to have a lower probability than the main wave count. However, low probability does not mean no probability. All possibilities should be considered.
Within leading diagonals, the first, third and fifth waves are most commonly zigzags. They may also appear to be impulses. Here, minor wave 1 will fit as a zigzag.
Second and fourth waves must be zigzags. Minor wave 2 may not move beyond the start of minor wave 1 above 2,490.87.
Second and fourth waves within diagonals are usually very deep; a range is given for the common depth.
Minor wave 3 would have to move below the end of minor wave 1 at 2,417.35. Minor wave 3 downwards of a leading diagonal should still exhibit an increase in downwards momentum and should still have support from volume.
TECHNICAL ANALYSIS
WEEKLY CHART
Click chart to enlarge. Chart courtesy of StockCharts.com.
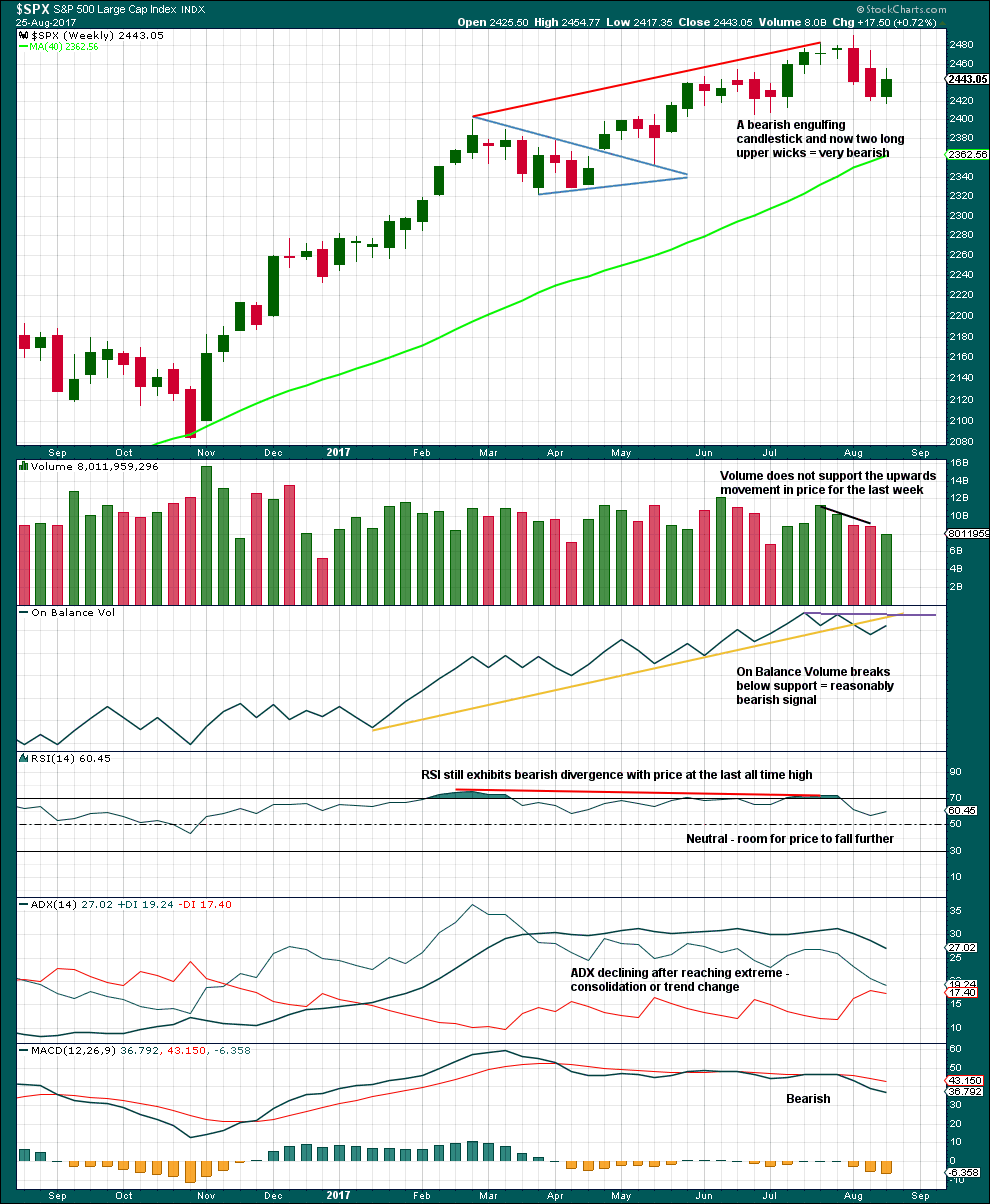
This week has made a lower low and lower high, but the candlestick closed green and the balance of volume was upwards. Lighter volume does not support the rise in price during this week.
ADX had been extreme for a long time and is now declining. The black ADX line is now declining but has not yet been pulled down below both directional lines, so the consolidation or pullback may be expected to continue.
DAILY CHART
Click chart to enlarge. Chart courtesy of StockCharts.com.
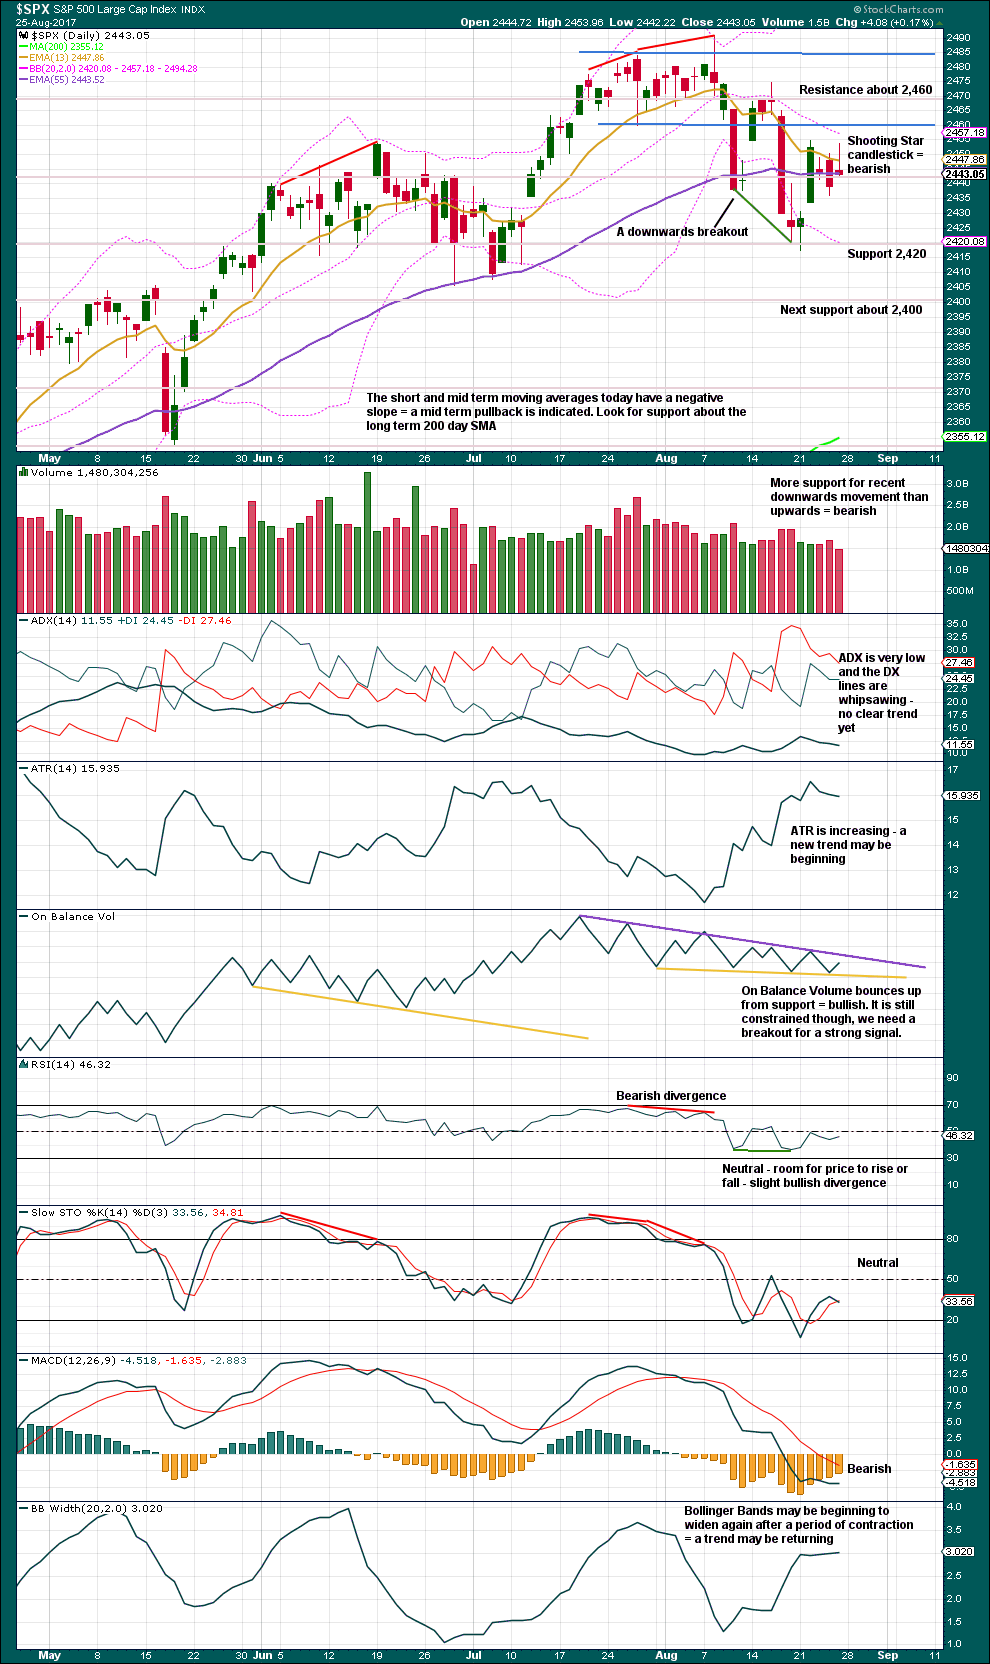
After a small bounce lasting about four sessions, Friday completes a Shooting Star candlestick pattern. This is bearish.
Overall, this chart remains bearish. Watch the trend lines on On Balance Volume very carefully next week; a breakout there may precede the next direction for price. If On Balance Volume breaks out downwards, then strong confidence may be had in the Elliott wave count.
VOLATILITY – INVERTED VIX CHART
Click chart to enlarge. Chart courtesy of StockCharts.com.
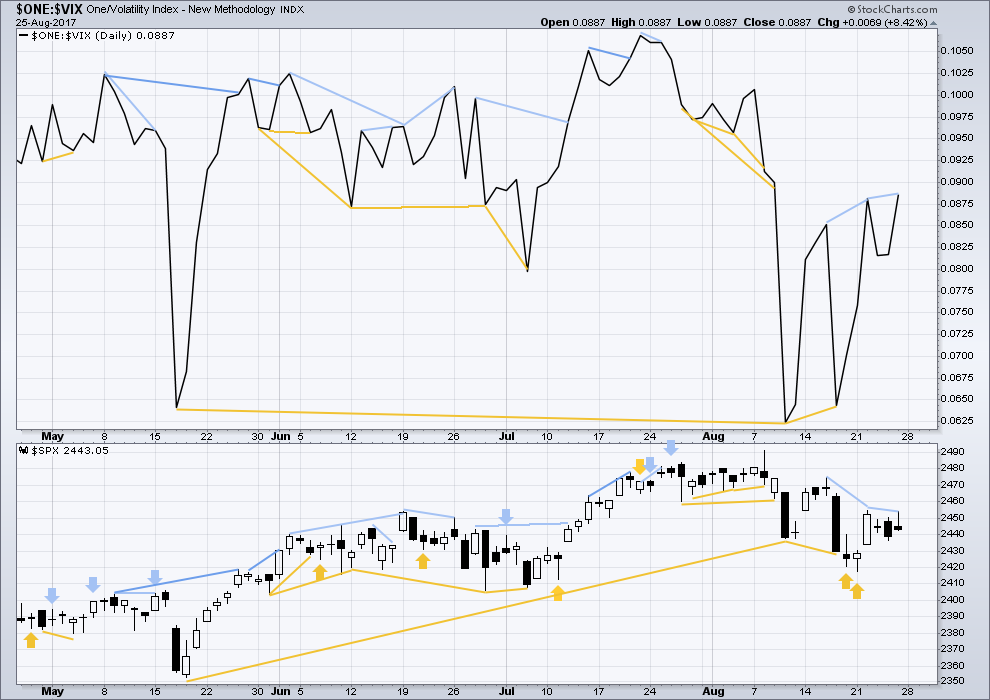
Normally, volatility should decline as price moves higher and increase as price moves lower. This means that normally inverted VIX should move in the same direction as price.
Inverted VIX has made a slightly higher high today, above the high three sessions ago, but price has made a slightly lower high. This divergence is bearish, but it is weak.
BREADTH – AD LINE
Click chart to enlarge. Chart courtesy of StockCharts.com.
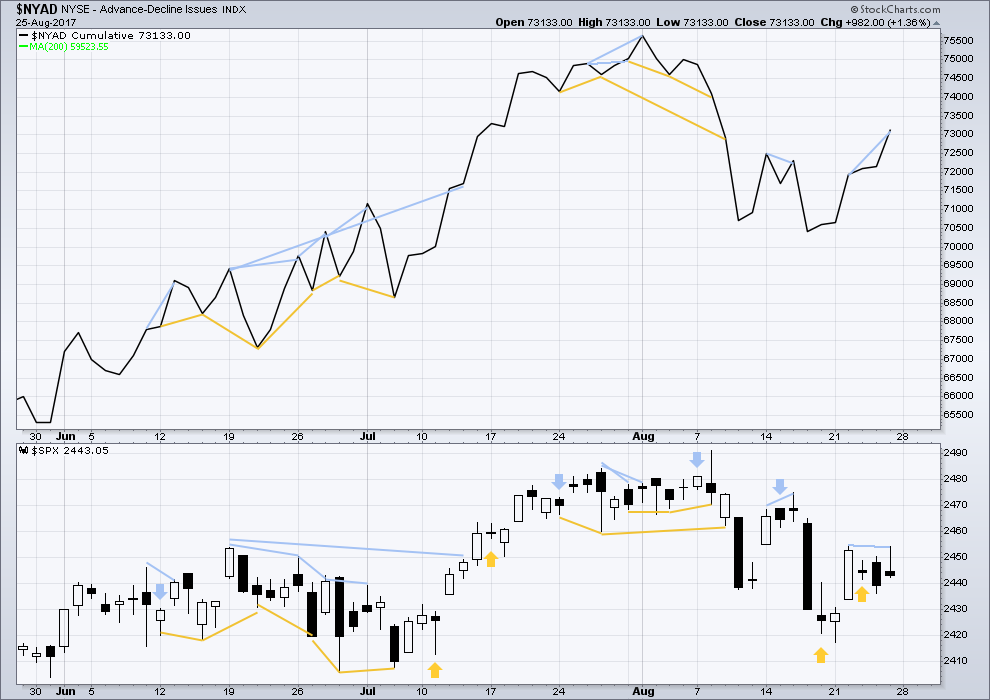
With the last all time high for price, the AD line also made a new all time high. Up to the last high for price there was support from rising market breadth.
There is normally 4-6 months divergence between price and market breadth prior to a full fledged bear market. This has been so for all major bear markets within the last 90 odd years. With no divergence yet at this point, any decline in price should be expected to be a pullback within an ongoing bull market and not necessarily the start of a bear market.
There is new short term divergence today between price and market breadth: the AD line has made a reasonable new high above the prior high of three sessions ago, but price has slightly failed to make a new high. This is hidden bearish divergence and indicates weakness within price.
DOW THEORY
The S&P500, DJIA, DJT and Nasdaq have all made new all time highs recently.
Modified Dow Theory (adding in technology as a barometer of our modern economy) sees all indices confirming the ongoing bull market.
The following lows need to be exceeded for Dow Theory to confirm the end of the bull market and a change to a bear market:
DJIA: 17,883.56.
DJT: 7,029.41.
S&P500: 2,083.79.
Nasdaq: 5,034.41.
Charts showing each prior major swing low used for Dow Theory are here.
Published @ 02:27 a.m. EST on 27 August, 2017.
Nk shooting rockets toward Japan,, there you have some impedus for a down move
Yep. The banksters are feverishly trying to arrest the plunge…we may yet get that third…should we thank Mr. Kim?
Another leading diagonal 1?? Maybe. (Ooops, Lara beat me to it!)
Main hourly chart updated:
Another leading contracting diagonal? Price to find resistance at the upper blue trend line?
If it does and reacts there this wave count would still be favoured.
This is looking more likely as I see it. Perhaps though where I have iii it should be i, and where I have iv it should be ii? At any rate, the evidence continues to indicate the beat downward goes on. So far.
Nope…
I am afraid it looks to be one more session of irresolution.
A very frustrating market indeed. No option but to patiently wait for Mr Market to make his intentions clearer. I am setting a few alerts and off to more interesting matters than watching paint dry!
Tada! 🙂
LOL! Is that what it takes?
A bullish trade to prompt some action on the part of Mr Market?
Close to breaking that 2440 pivot….
If the market moves down from here…this??
I am actually going to take a short trade to the upside. What we are seeing is consolidation plain and simple, as much as we would prefer otherwise. I certainly don’t mind being wrong about that call, but in the meantime, opening a bullish SPY 240/242.50 credit spread expiring Friday for credit of 0.35 per contract. Will close short 242.50 leg with any break of 2440.00
last move down looks more like a 3 unfortunately. I think Olga could be right here. Those pesty Banksters!!!!!
I’m still hoping for non-domination by the banksters some day.
While there isn’t yet high momentum down, there is definitely NOT momentum up either, and the market is inexorably getting squeezed against the approaching upper main channel line. Also, we have a growing set of lower swing highs and lower swing lows over the last two sessions. Anything is possible, but I continue to think the preponderance of evidence indicates an approaching 3 of 3 type impulse move downward. A news event could certainly kick it off, and there’s lots of potential there!!
Seems very soon Mr M will either need to finish his business or get off the pot
Yeah…I’ve got some nice chilled prune juice in case Mr. Market is in need of a bit of assistance with that pot business…. 🙂
Minor relief but hey, Mr. Market has what, 15 months of backup??? We’ll gonna have to order take out for Mr. Market, he ain’t going nowhere for weeks, even if there are long lulls. Took 1/2 my morning short, second 1/2 holding for the bottom-ish of the overall 4 wave down. My approach now is to keep doing this: add a fresh short at 2 units, take short term profit on one unit, add the second unit to the longer term hold bank, and thereby both get my short term profit itch scratched and try to make some more serious coin as well.
Now those two trend lines getting tested from the underside, this should be interesting!
Here’s hoping you are right. I am keeping some powder dry as in principle I am very much in agreement with the bearish argument. Nonetheless, this market continues to defy logic! 🙂
Covered my USO short. I think we next get a brief bounce that should offer a chance to get short for the sweet spot to the downside…
and the correlation is gold shooting up
I still think we are 1,2 ing, 1,2 ing
I have to say it does make me smile when I think of all the ways over the years that we have tried to explain why what we think is a third wave is taking so long to manifest. Ultimately the correct explanation always turns out to be the same! 🙂
Look like another side way market today, so far.
It is sure starting to look like the market is in some kind of sideways consolidation instead of an impulsive decline to the downside. This morning’s gap up was a stark departure from the last two times this month we had shooting star candles, and even on those prior occasions that resulted in gap down openings, the decline was more or less retraced. If we do not break 2440 today I think we are going higher from these levels.
What was it you said we should all remember, about two weeks ago or so Verne?
This snoozefest doesn’t look right to me – I’m starting to favour the alternate. Maybe a triangle in progress or a series of 1,2’s as per Lara’s count
Chart….
If we break below 2436 I’ll take more interest.
Crude is again taking a good beating.
Yep! I will probably exit my USO short today after a nice triple!
I think we have a lot more downside but I will wait to re-enter after an over-sold bounce. Actually I am eyeing DRIP on the next pull-back for a rocket-fuel trade on the next plunge toward 35 or thereabouts! 🙂
I’m not yet giving up on the main. If the little channel I drew in holds, anyway!! But I agree, it looks awfully limp for the start of a 3 of a 3 down.
dat wabbit thinks he was first! ha ha
Way to go Ronald!
O.K. Buster! I demand a re-match!