
A small doji for Wednesday’s session saw price move sideways in a very small range. The Elliott wave count is only changed for the very short term at the hourly chart level, and only slightly.
Summary: The bigger picture sees the S&P now in a primary degree pullback to last a minimum of 8 weeks and find support at the maroon channel on the weekly chart.
For the short term, a bounce may continue slightly higher to find strong resistance at the upper edge of the base channel on the main hourly chart.
The short term target for a third wave down is still at 2,389.
If price moves above 2,474.93, then use the alternate hourly chart.
New updates to this analysis are in bold.
Last monthly and weekly charts are here. Last historic analysis video is here.
ELLIOTT WAVE COUNT
WEEKLY CHART
Click chart to enlarge.
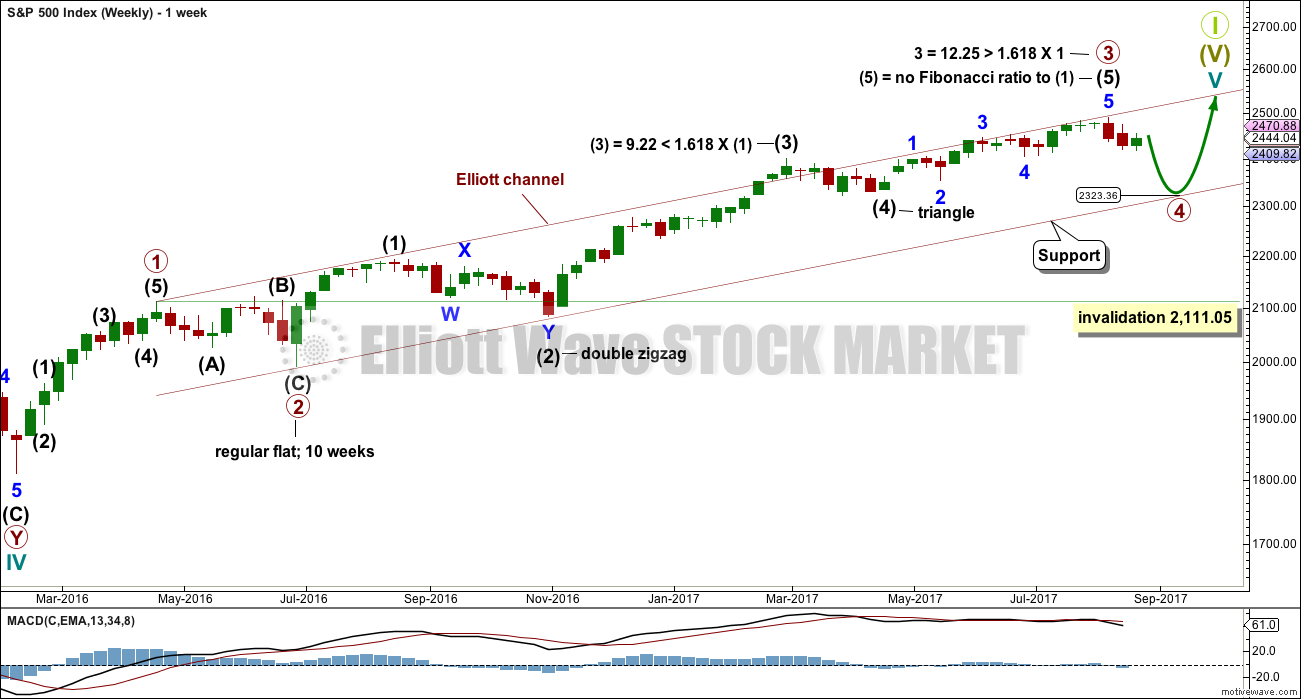
Primary wave 3 now looks complete. Further and substantial confidence may be had if price makes a new low below 2,405.70. Fibonacci ratios are calculated at primary and intermediate degree. If primary wave 3 is complete, then it still exhibits the most common Fibonacci ratio to primary wave 1.
Primary wave 4 may not move into primary wave 1 price territory below 2,111.05.
Primary wave 4 should last about 8 weeks minimum for it to have reasonable proportion with primary wave 2. It is the proportion between corrective waves which give a wave count the right look. Primary wave 4 may last 13 or even 21 weeks if it is a triangle or combination. So far it has lasted only one full week.
If primary wave 4 reaches down to the lower edge of the Elliott channel, it may end about 2,325. This is within the range of intermediate wave (4); fourth waves often end within the price territory of the fourth wave of one lesser degree, or very close to it.
The final target for Grand Super Cycle wave I to end is at 2,500 where cycle wave V would reach equality in length with cycle wave I. If price reaches the target at 2,500 and either the structure is incomplete or price keeps rising, then the next target would be the next Fibonacci ratio in the sequence between cycle waves I and V. At 2,926 cycle wave V would reach 1.618 the length of cycle wave I.
DAILY CHART
Click chart to enlarge.
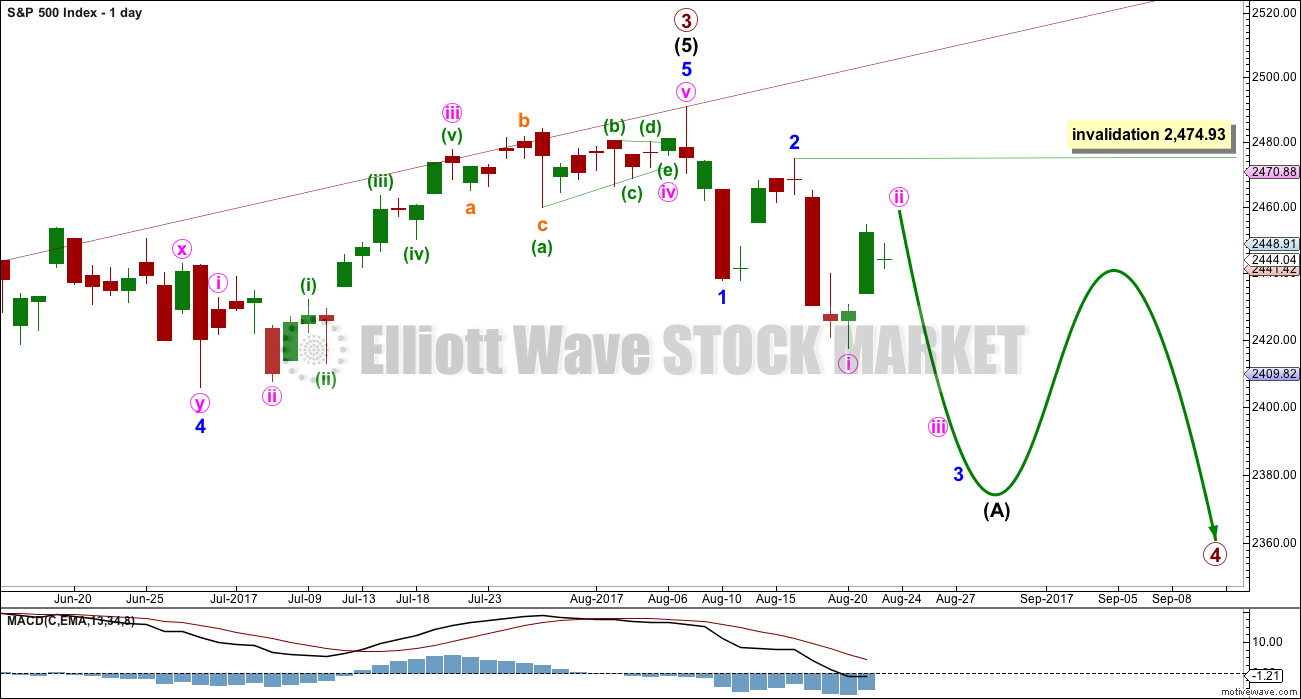
The daily chart will now focus in on the unfolding structure of primary wave 4.
Primary wave 2 was a regular flat correction lasting 10 weeks. Given the guideline of alternation, primary wave 4 may most likely be a single or double zigzag. Within both of those structures, a five down at the daily chart level should unfold. At this stage, that looks incomplete.
While primary wave 4 would most likely be a single or double zigzag, it does not have to be. It may be a combination or triangle and still exhibit structural alternation with primary wave 2. There are multiple structural options available for primary wave 4, so it is impossible for me to tell you with any confidence which one it will be. It will be essential that flexibility is applied to the wave count while it unfolds. Multiple alternates will be required at times, and members must be ready to switch from bear to bull and back again for short term swings within this correction.
Members with a longer term horizon for their trading may wait for primary wave 4 to be complete to purchase stocks or enter the index long.
While intermediate wave (A) is labelled as an unfolding impulse, it may also be a diagonal. Both structures are considered at the hourly chart level.
Intermediate wave (A) may also be a zigzag if primary wave 4 is to be a triangle. So far it is possible a zigzag downwards could be complete, but it is not deep enough for wave A of a triangle when it is viewed on the weekly chart. And so that possibility will not be considered at this time.
MAIN HOURLY CHART
Click chart to enlarge.
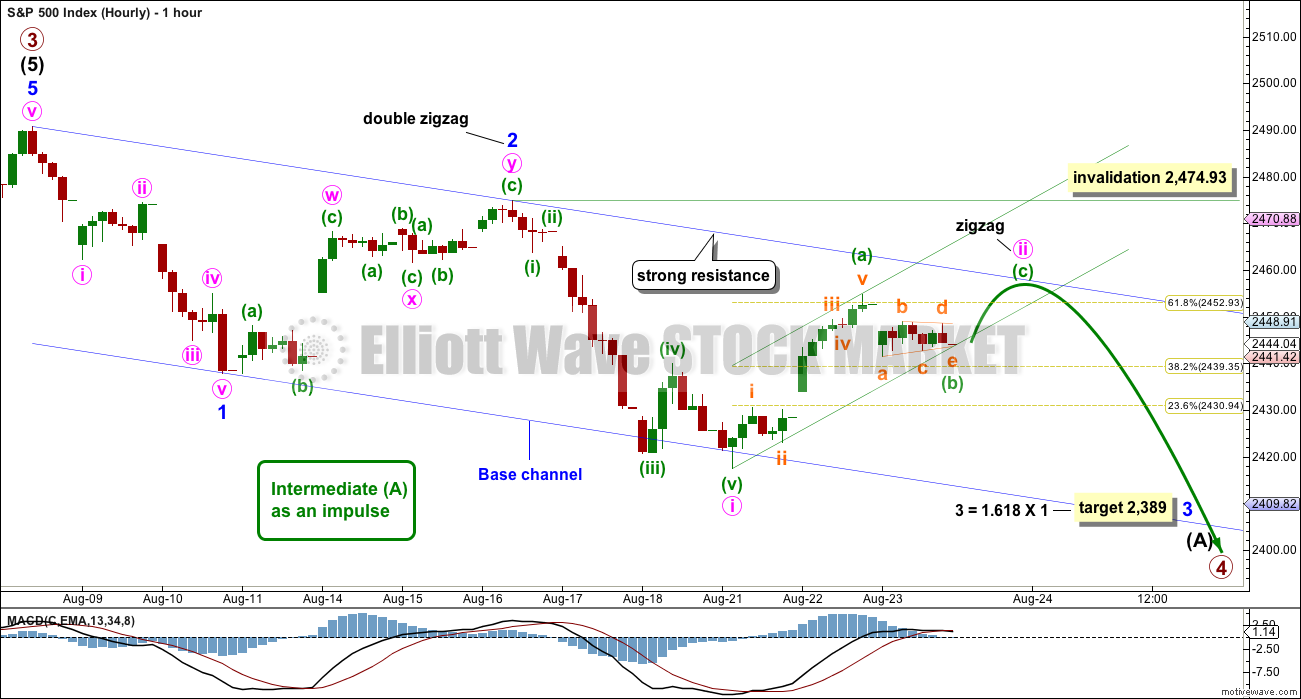
Minor wave 1 downwards looks very clear as a five wave structure.
Minor wave 2 upwards ended just above the 0.618 Fibonacci ratio. Minor wave 3 downwards has now made a new low below the end of minor wave 1, meeting the Elliott wave rule.
Minor wave 3 now exhibits slightly stronger momentum than minor wave 1. A further increase in downwards momentum would be expected.
Within minor wave 3, minute wave ii now shows up on the daily chart as a two green candlesticks so far. The structure of minute wave ii today is changed to see it as a zigzag. So far it has reached just above the 0.618 Fibonacci ratio. It may move a little higher to test the upper edge of the base channel.
A small channel is drawn about minute wave ii. If minuette wave (b) is complete now, then it would fit as a small barrier triangle. But minuette wave (b) may certainly morph into a combination and continue further sideways for another session. If it does, then the green channel must be redrawn. At this stage, the green channel may not be used to indicate an end to this bounce.
After a little upwards movement, which may be considered minuette wave (c), then the green channel may have some purpose. At that stage, a breach of the lower edge of the channel would provide earliest indication that minute wave ii may be over and a third wave down may be underway.
If price moves higher above the upper edge of the base channel, then the alternate below should be preferred as soon as that trend line is breached and before the invalidation point is passed.
The target expects minor wave 3 to be an extension. When third waves extend, they do so both in price and time. They often show their subdivisions at higher time frames, which is why minute waves ii and iv may show up on the daily chart.
Use bounces as an opportunity to enter the downwards trend. Always use a stop and invest only 1-5% of equity on any one trade.
ALTERNATE HOURLY CHART
Click chart to enlarge.
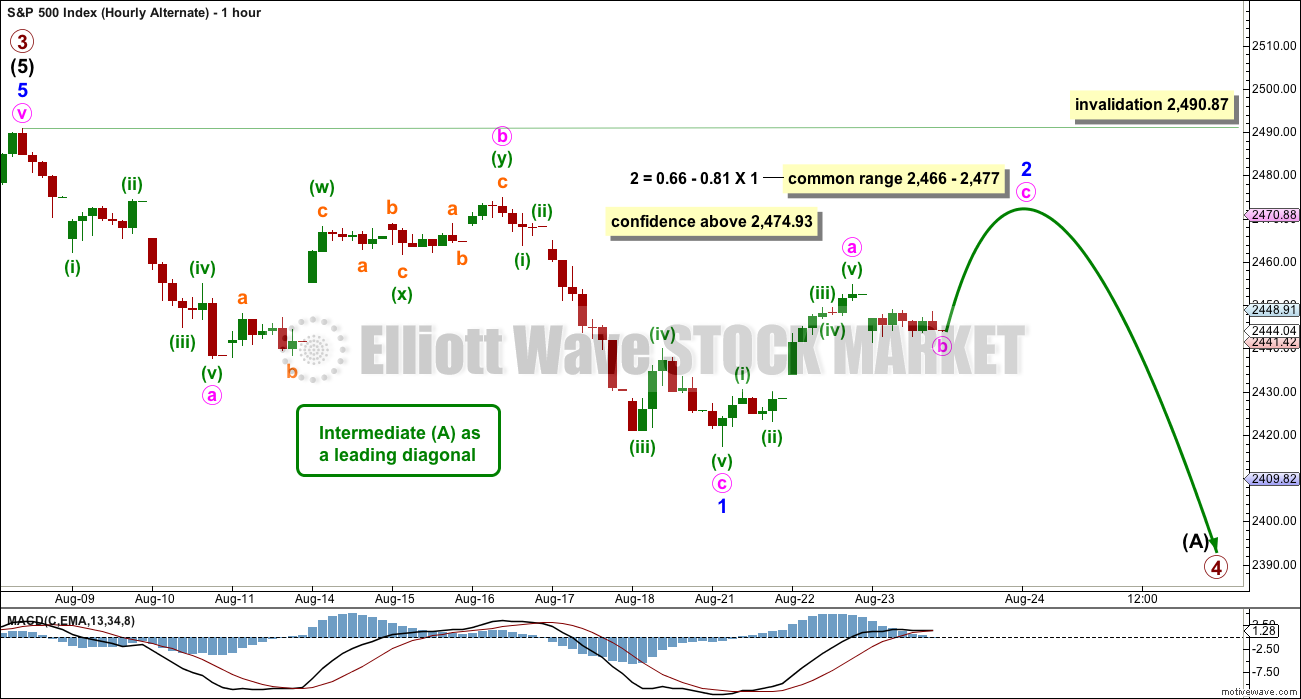
The other possible structure for intermediate wave (A), if it is to be a five, would be a leading diagonal. These are not as common as impulses, so this must be an alternate wave count judged to have a lower probability than the main wave count. However, low probability does not mean no probability. All possibilities should be considered.
Within leading diagonals, the first, third and fifth waves are most commonly zigzags. They may also appear to be impulses. Here, minor wave 1 will fit as a zigzag.
Second and fourth waves must be zigzags. Minor wave 2 may not move beyond the start of minor wave 1 above 2,490.87.
Second and fourth waves within diagonals are usually very deep; a range is given for the common depth.
Minor wave 3 would have to move below the end of minor wave 1 at 2,417.35. Minor wave 3 downwards of a leading diagonal should still exhibit an increase in downwards momentum and should still have support from volume.
TECHNICAL ANALYSIS
WEEKLY CHART
Click chart to enlarge. Chart courtesy of StockCharts.com.
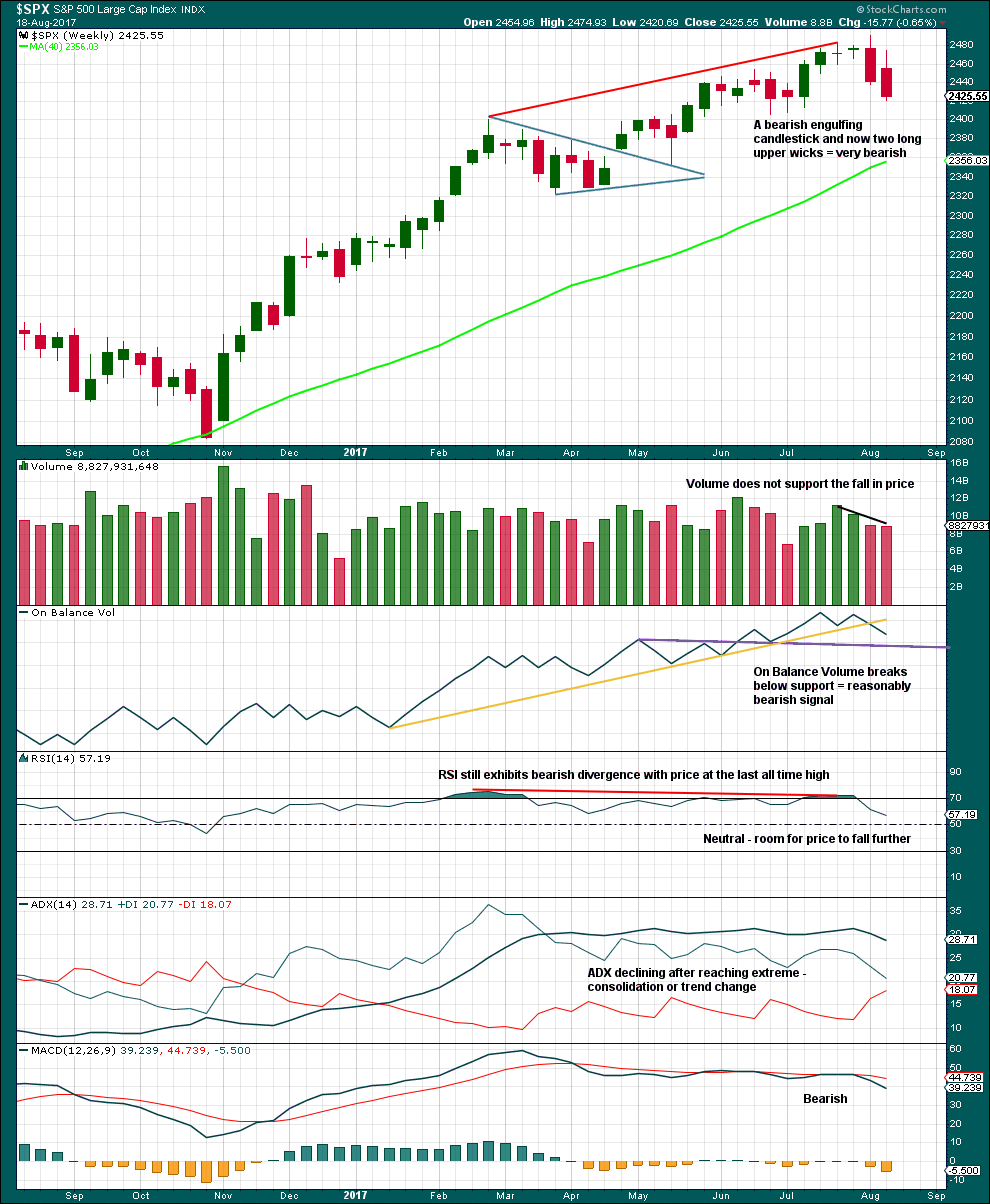
Another red weekly candlestick is very bearish. Long upper wicks now on two weekly red candlesticks are bearish. A Bearish Engulfing pattern is the strongest reversal pattern.
On Balance Volume has given an important bearish signal with a break below the yellow support line. This line has been tested five times before and is long held, but it has a reasonable slope. This is a reasonable bearish signal, not a very strong one.
RSI, ADX and MACD all remain bearish.
This weekly chart offers stronger support to the Elliott wave count.
DAILY CHART
Click chart to enlarge. Chart courtesy of StockCharts.com.
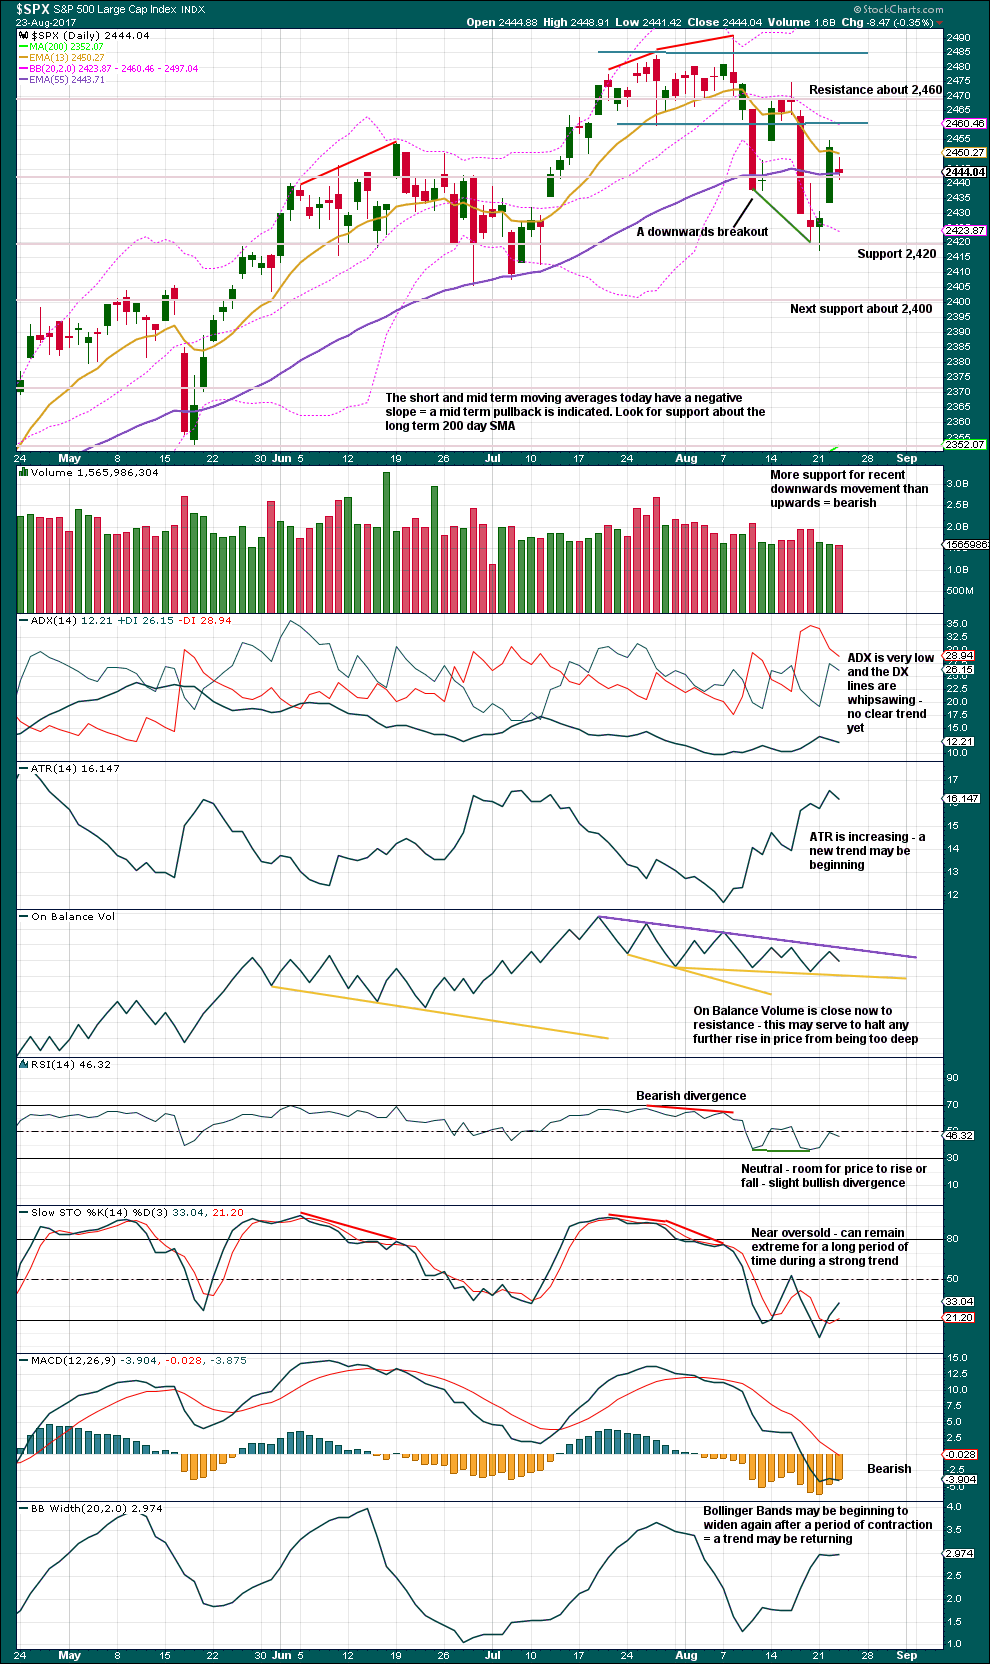
A small red doji today indicates a balance between bulls and bears, and indecision. The balance of volume was downwards and volume shows a very slight decline. This may be read as slightly bullish, but in conjunction with a doji it is not overly bullish. My judgement will be to read it as neutral.
Recently, there is still more support for downwards days than upwards. The short term volume profile is still slightly more bearish than bullish.
Each trend line on On Balance Volume has now at least three tests, and the resistance line may have five. The support line is almost horizontal. These lines now have good technical significance. A breakout here may precede price. If that happens, we may have some confidence in what price may do next.
This chart still remains more bearish than bullish.
VOLATILITY – INVERTED VIX CHART
Click chart to enlarge. Chart courtesy of StockCharts.com.
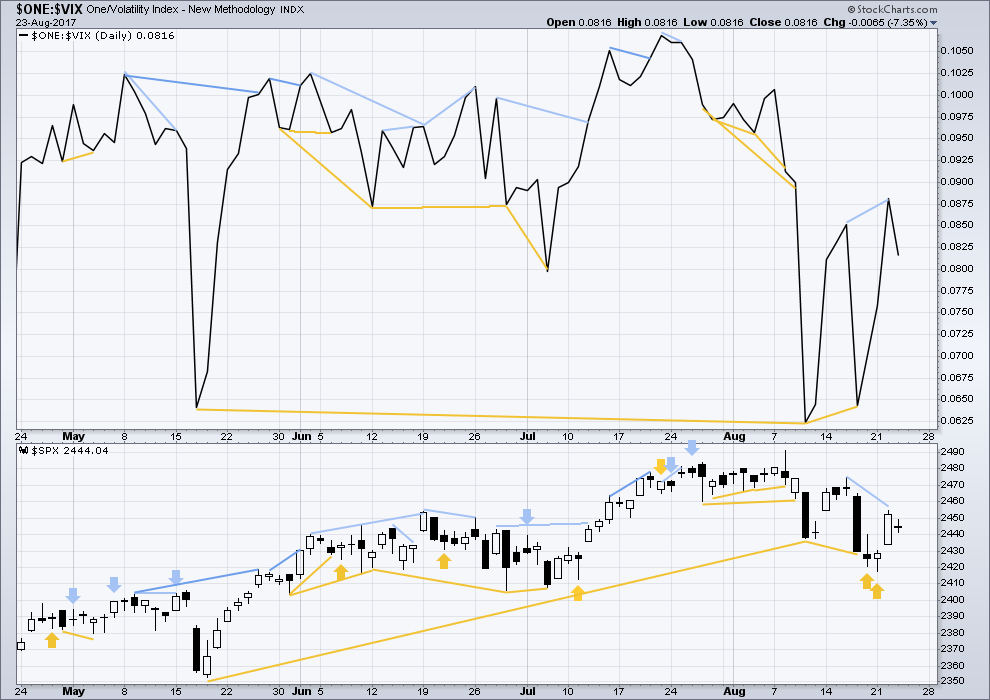
Normally, volatility should decline as price moves higher and increase as price moves lower. This means that normally inverted VIX should move in the same direction as price.
Short term bearish divergence noted in yesterday’s analysis has now been followed by a small red candlestick. It may now be resolved here, or it may need one more red daily candlestick to resolve it. There is no new divergence today between price and inverted VIX.
BREADTH – AD LINE
Click chart to enlarge. Chart courtesy of StockCharts.com.
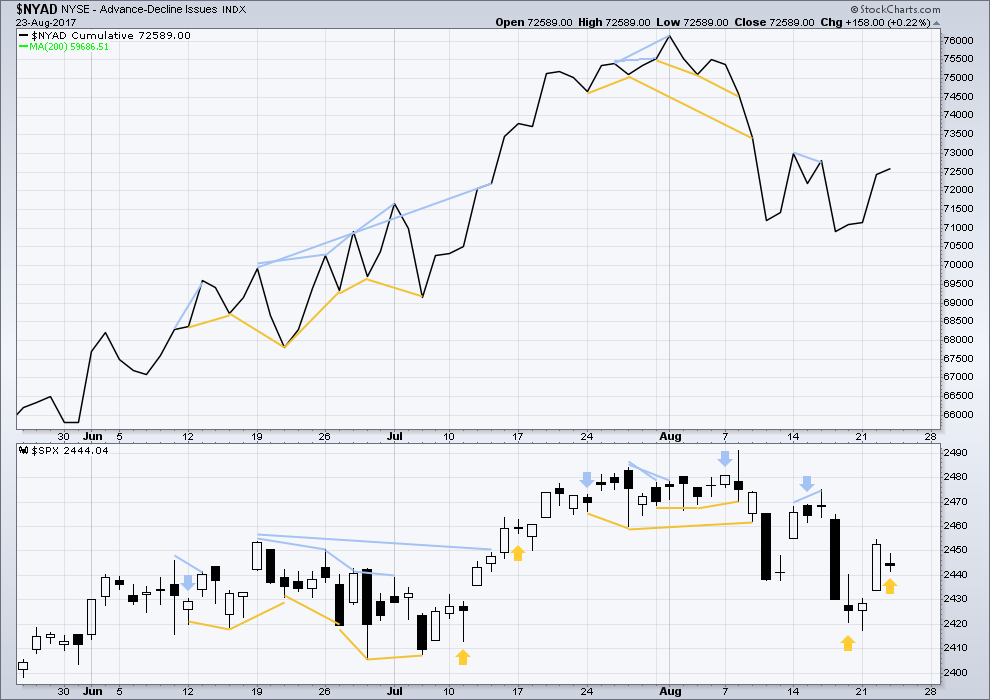
With the last all time high for price, the AD line also made a new all time high. Up to the last high for price there was support from rising market breadth.
There is normally 4-6 months divergence between price and market breadth prior to a full fledged bear market. This has been so for all major bear markets within the last 90 odd years. With no divergence yet at this point, any decline in price should be expected to be a pullback within an ongoing bull market and not necessarily the start of a bear market.
Price moved sideways today with a balance of volume downwards and a red candlestick printed. Downwards movement during the session today does not come with a normal decline in market breadth, the AD line moved higher. This is interpreted as weakness today within price and is bullish. This offers a little support to the hourly Elliott wave count for the very short term.
DOW THEORY
The S&P500, DJIA, DJT and Nasdaq have all made new all time highs recently.
Modified Dow Theory (adding in technology as a barometer of our modern economy) sees all indices confirming the ongoing bull market.
The following lows need to be exceeded for Dow Theory to confirm the end of the bull market and a change to a bear market:
DJIA: 17,883.56.
DJT: 7,029.41.
S&P500: 2,083.79.
Nasdaq: 5,034.41.
Charts showing each prior major swing low used for Dow Theory are here.
Published @ 08:46 p.m. EST.
Sorry everybody about getting the wrong Friday for Non Farm Payroll. It’s next week, not tomorrow.
Minute ii still looks incomplete. I’ll still expect it to end when price touches the upper edge of the base channel.
Another stab at current action which will no doubt soon be invalidated 😀
Actually a-c doesn’t make sense as labelled so scrap that.
In any case the whole structure looks corrective to me so I’m still expecting it to be resolved upwards atm.
Might we have a leading diagonal minute 1 of minor 3, where the high at the end of the day two days ago was the top of minor 2?
Or, looking at the whole thing with fresh eyes…I can easily count a 1, 2, 3 up starting at the low of minor 2, and all this mess for the last day and half is a good sized 4.
I still favour this being a B wave. I’m guessing we’re gonna go sideways for the rest of the session with fireworks for NFP tomorrow.
I’m expecting an upwards jump to complete (c) tomorrow, which will be quickly retraced and really get minor 3 going.
That’s the way I’m going to play it, unless I see something else happening beforehand.
Yes, something like this perhaps (sorry for my simplistic labelling. Also, I use brackets to replace a circle). It would continue the symmetry with the last overall cycle 1-2 weeks ago: a final push up before the large drop.
Yep – I’m thinking of labelling more like this but the end result is the same.
I see we have another IB TWS user in the house 🙂
Yes, and it (the trader workstation) occasionally does give me Irritable Bowel Syndrome!!! To many charts/too much data and the newest version degrades to inoperable within 90 minutes, and I have to restart. My solution has been to (a) cut back in how many charts I’d like instantly available and (b) use the old 4.0 version of TWS!! That combo is now surviving the day session for me, at least.
I believe NFP is next week, Lara updated this earlier, might have updated it on the gold sight. There is the meeting in Jackson hole with the fed possibly speaking tomorrow
Ah ok – many thanks
Oil is taking a beating atm for anyone interested 🙂
Maybe (b) is was over at this mornings lows as a zig zag? If we break out of the upper channel containing (b) that idea may work.
Chart…
My “main” has minor 2 complete, now. That little blue trendline is blown away, the 38% retrace fibo support is blown away, and despite multiple tries, the Mr. Market keeps getting pounded down to lower lows. Could be wrong but the evidence is there.
You might be right, but b waves are a nightmare to analyse in real time so I’m waiting to see a bit more of Mr M’s hand before acting.
Last 2 drops lower do look impulsive but still a long way off what I would expect from a 3rd wave at 2 (high) degrees.
Price needs to drop out of the channel shown on my chart for a start.
Price bounced off the 50% fibo retrace, and is now pushing against the blue lower channel line from beneath and the 38% fibo, where they now act as resistance. If price moves down from here again to new lows, this suddenly looks very impulsive to me as well.
What blue channel are you looking at?
The only blue channel I can see on Lara’s charts is the minor 1,2 base channel.
I can see the 50% fib retrace (which happens to also be the bottom channel on my chart above – I would expect price to bounce off that in a corrective structure, so it is doing as expected as far as I can see atm)
Sorry I guess it’s green. The channel line that connects the two lows on the 21st. As of this moment, still not broken through from the underside. Yes, a break of the A-C downchannel line on your chart would (will?) be Significant. The 50% fibo that price went down to almost and turned is at 2436.05 or so.
Trying to upload a chart (first time, excuse me if it’s messed up)…okay, hope this clarifies.
chart above invalidated as labelled – price still in (b) channel – (b) possibly still in progress (if it is (b))
SPX has bounced off the trendline drawn under the two Aug 21 lows (Lara’s low green channel line on the main hourly), very slightly penetrating the 38% retrace of the Aug 21 low to Aug 22 high move. A very strong support zone, obviously. Any later push down to new lows and I dramatically add to my pilot short. However, I suspect price today is just going to stay in the established range, now. What’s happening right this moment sure looks like a bit of a short squeeze…
Of course there’s always the option of adding to your short position on a relative high…
It’s always silly to ascribe reasons and drivers of what the market is doing, because no one knows given the millions of participants. That said, it’s still fun. My view: the big/smart money pushes the market up a bit overnight (easy for them in the light volume), then distributes hard early in the session…then stops at the support zone, because they don’t want a panic yet. The retail crowd rushes in to “buy the dip” and buy the bounce off the fibo. And now big/smart money starts distributing again. So the cycle goes. Eventually, big/smart money stops propping up the market, and away we go. Could be all wrong but that’s what it looks like to me.
Hi Lara. Thanks again for the update.
“If price moves higher above the upper edge of the base channel, then the alternate below should be preferred as soon as that trend line is breached”
Re the main hourly count, isn’t it expecting too much of (c) to be that small if it is to fit below the upper channel?
If (c) is 0.618 (a) at 2467.13 then that gives a normal EW ratio between (c) and (a) and even though it would be above the upper channel, it would still be below the upper line of the small green channel and of course not violate 2474.93?
Cycle #2 of pump/dump by the big and smart money (“the bankers”) is about to enter the deflate phase, again, at a lower high than last week’s cycle of course. And this right as EW says we should be getting some 3 of 3 down type of price movement. And this when the market is so severely overdue for a spike in volatility that it’s even making business news headlines. I’m working my short plan, particularly in the area of what to do in case of extremely rapid downward price movement…there won’t be time to think when it’s happening!! Being prepared never hurt anyone.
Foist!