
Downwards movement has continued for Friday exactly as the Elliott wave count and classic technical analysis expected.
On Balance Volume gives important signals at the end of this week.
Summary: Look out for a green daily candlestick for Monday. A small bounce may end about 2,441 or 2,454.
The short term target for a third wave down is at 2,389.
A deeper pullback may be expected to last at least 8 weeks and may end about 2,320.
New updates to this analysis are in bold.
Last monthly and weekly charts are here. Last historic analysis video is here.
ELLIOTT WAVE COUNT
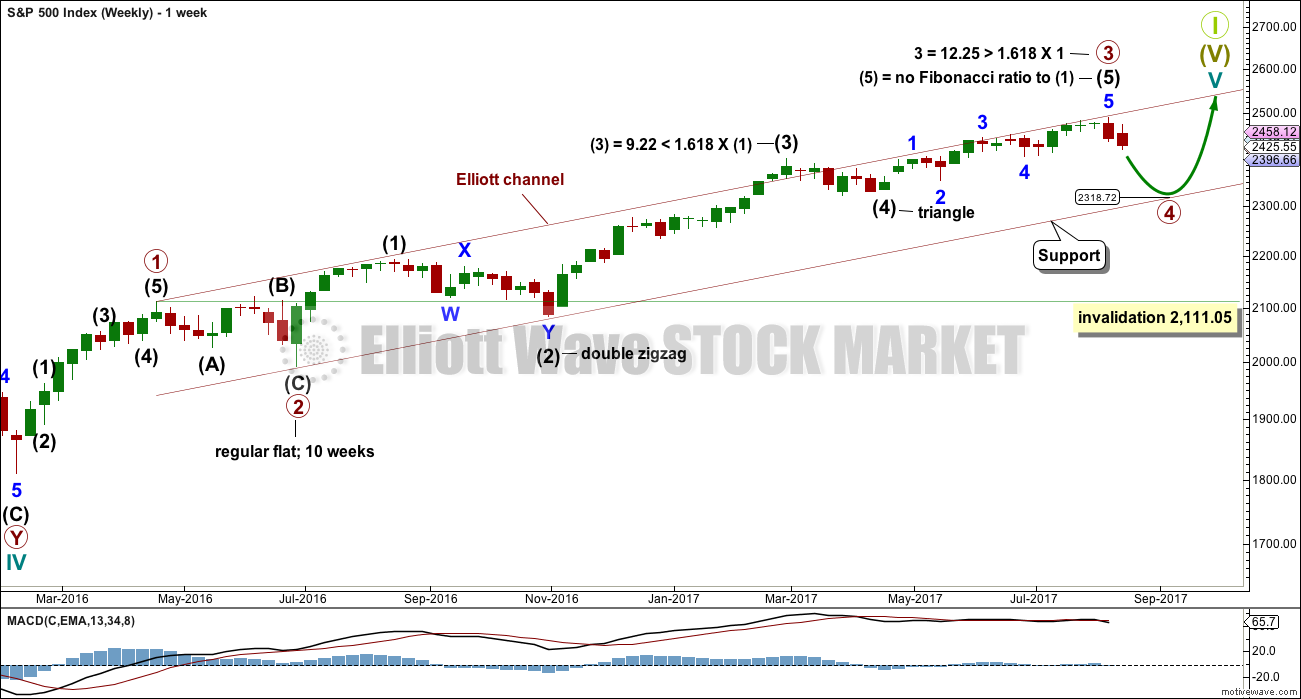
WEEKLY CHART
Click chart to enlarge.
Primary wave 3 now looks complete. Further and substantial confidence may be had if price makes a new low below 2,405.70. Fibonacci ratios are calculated at primary and intermediate degree. If primary wave 3 is complete, then it still exhibits the most common Fibonacci ratio to primary wave 1.
Primary wave 4 may not move into primary wave 1 price territory below 2,111.05.
Primary wave 4 should last about 8 weeks minimum for it to have reasonable proportion with primary wave 2. It is the proportion between corrective waves which give a wave count the right look. Primary wave 4 may last 13 or even 21 weeks if it is a triangle or combination. So far it has lasted only one full week.
If primary wave 4 reaches down to the lower edge of the Elliott channel, it may end about 2,320. This is very close to the lower range of intermediate wave (4); fourth waves often end within the price territory of the fourth wave of one lesser degree, or very close to it.
The final target for Grand Super Cycle wave I to end is at 2,500 where cycle wave V would reach equality in length with cycle wave I. If price reaches the target at 2,500 and either the structure is incomplete or price keeps rising, then the next target would be the next Fibonacci ratio in the sequence between cycle waves I and V. At 2,926 cycle wave V would reach 1.618 the length of cycle wave I.
DAILY CHART
Click chart to enlarge.
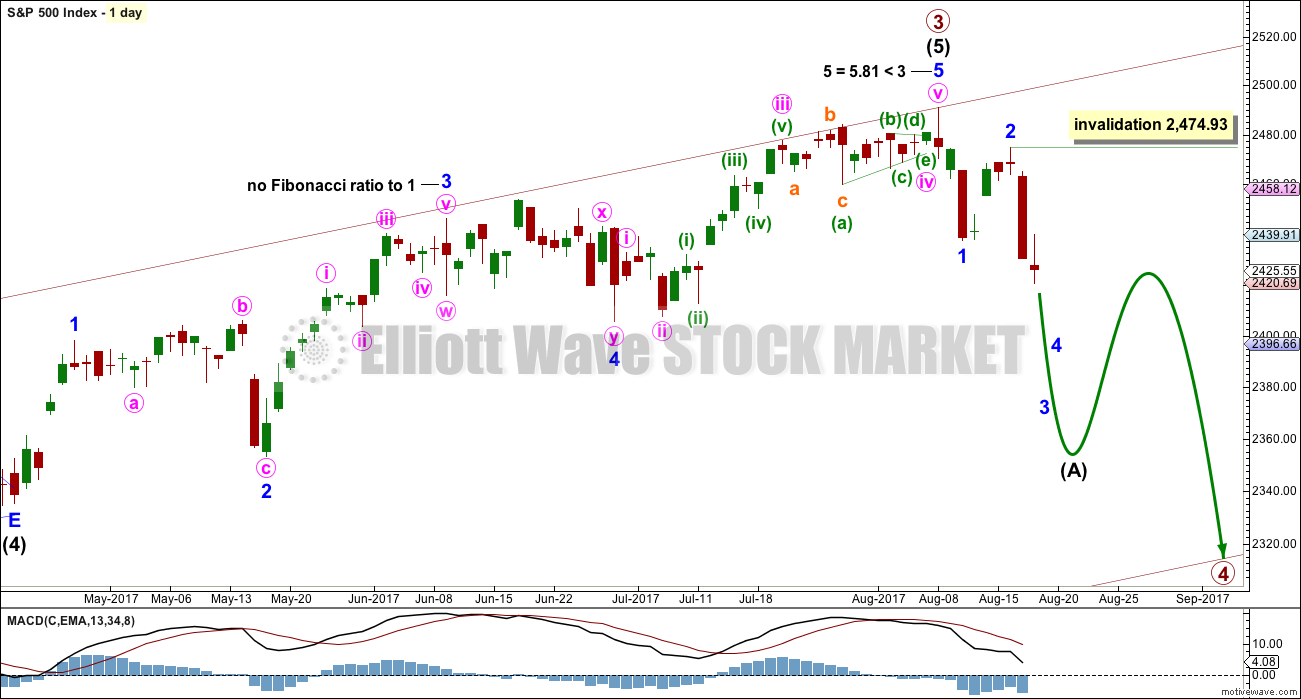
The daily chart shows only the structure of intermediate wave (5); this structure is an impulse.
Primary wave 2 was a regular flat correction lasting 10 weeks. Given the guideline of alternation, primary wave 4 may most likely be a single or double zigzag. Within both of those structures, a five down at the daily chart level should unfold. At this stage, that looks incomplete.
While primary wave 4 would most likely be a single or double zigzag, it does not have to be. It may be a combination or triangle and still exhibit structural alternation with primary wave 2. There are multiple structural options available for primary wave 4, so it is impossible for me to tell you with any confidence which one it will be. It will be essential that flexibility is applied to the wave count while it unfolds. Multiple alternates will be required at times, and members must be ready to switch from bear to bull and back again for short term swings within this correction.
Members with a longer term horizon for their trading may wait for primary wave 4 to be complete to purchase stocks or enter the index long.
HOURLY CHART
Click chart to enlarge.
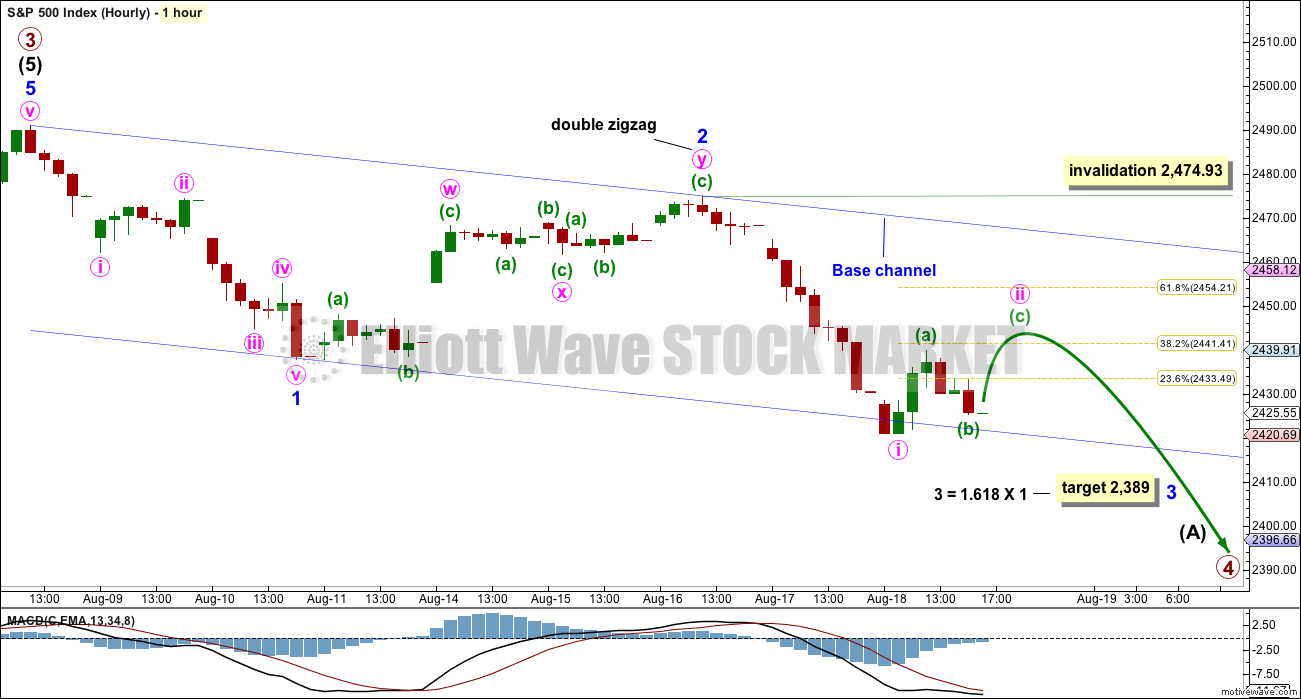
Minor wave 1 downwards looks very clear as a five wave structure.
Minor wave 2 upwards ended just above the 0.618 Fibonacci ratio. Minor wave 3 downwards has now made a new low below the end of minor wave 1, meeting the Elliott wave rule.
Minor wave 3 now exhibits slightly stronger momentum than minor wave 1. A further increase in downwards momentum would be expected.
Within minor wave 3, minute wave ii may show up on the daily chart as a green candlestick or a doji. It may not move beyond the start of minute wave i above 2,474.93. Minute wave ii should find very strong resistance at the upper edge of the blue base channel, if it gets that high.
The target expects minor wave 3 to be an extension. When third waves extend, they do so both in price and time. They often show their subdivisions at higher time frames, which is why minute waves ii and iv may show up on the daily chart.
Minute wave ii looks incomplete. When it is done, it should look like an obvious three wave structure upwards at the hourly chart level. This needs a slight new high to make it look like a three. If minuette wave (c) begins at Friday’s low, then it would reach equality in length with minuette wave (a) just above the 0.382 Fiboancci ratio of minute wave i.
Use bounces as an opportunity to enter the downwards trend. Always use a stop and invest only 1-5% of equity on any one trade.
TECHNICAL ANALYSIS
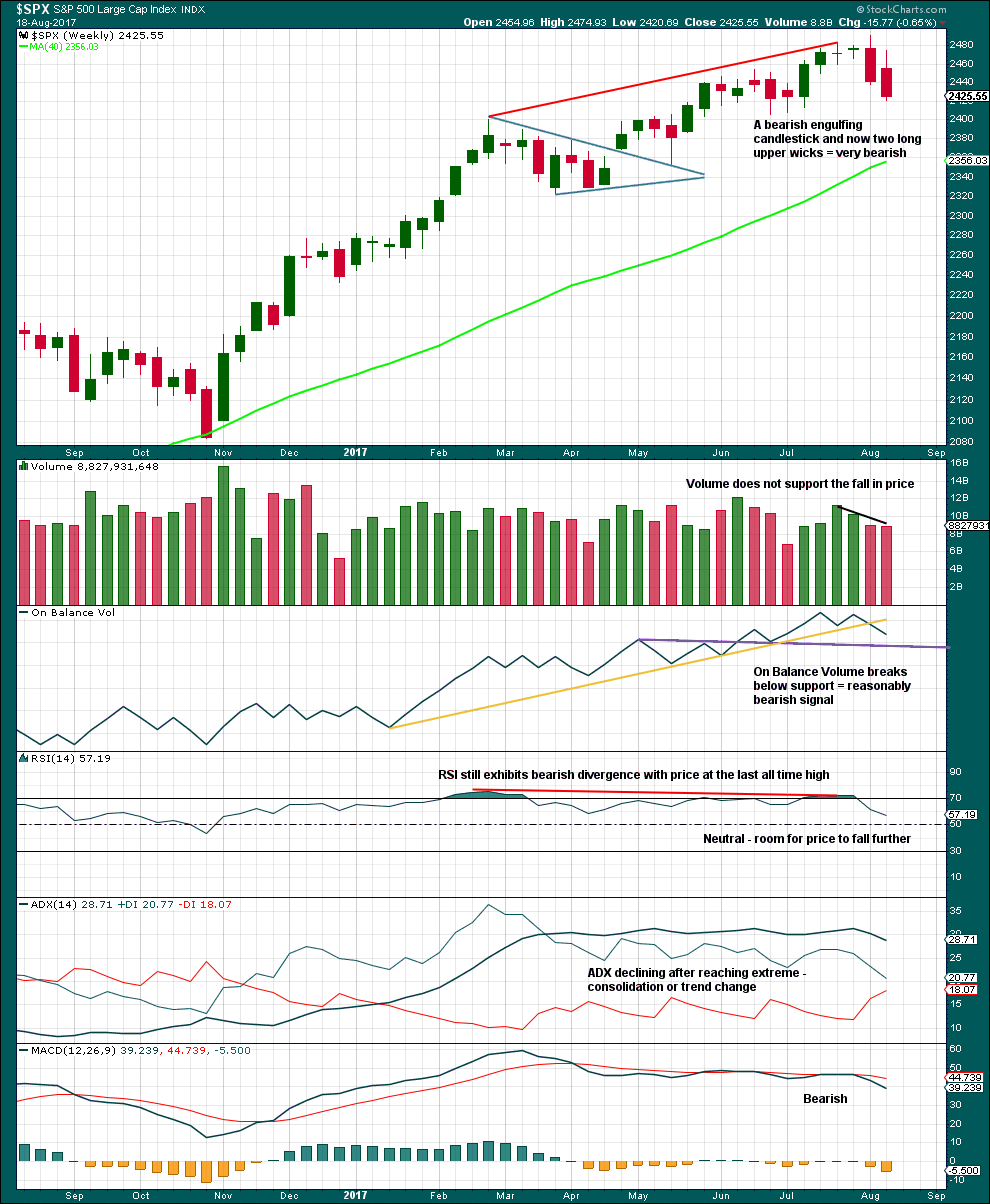
WEEKLY CHART
Click chart to enlarge. Chart courtesy of StockCharts.com.
Another red weekly candlestick is very bearish. Long upper wicks now on two weekly red candlesticks are bearish. A Bearish Engulfing pattern is the strongest reversal pattern.
On Balance Volume has given an important bearish signal with a break below the yellow support line. This line has been tested five times before and is long held, but it has a reasonable slope. This is a reasonable bearish signal, not a very strong one.
RSI, ADX and MACD all remain bearish.
This weekly chart offers stronger support to the Elliott wave count.
DAILY CHART
Click chart to enlarge. Chart courtesy of StockCharts.com.
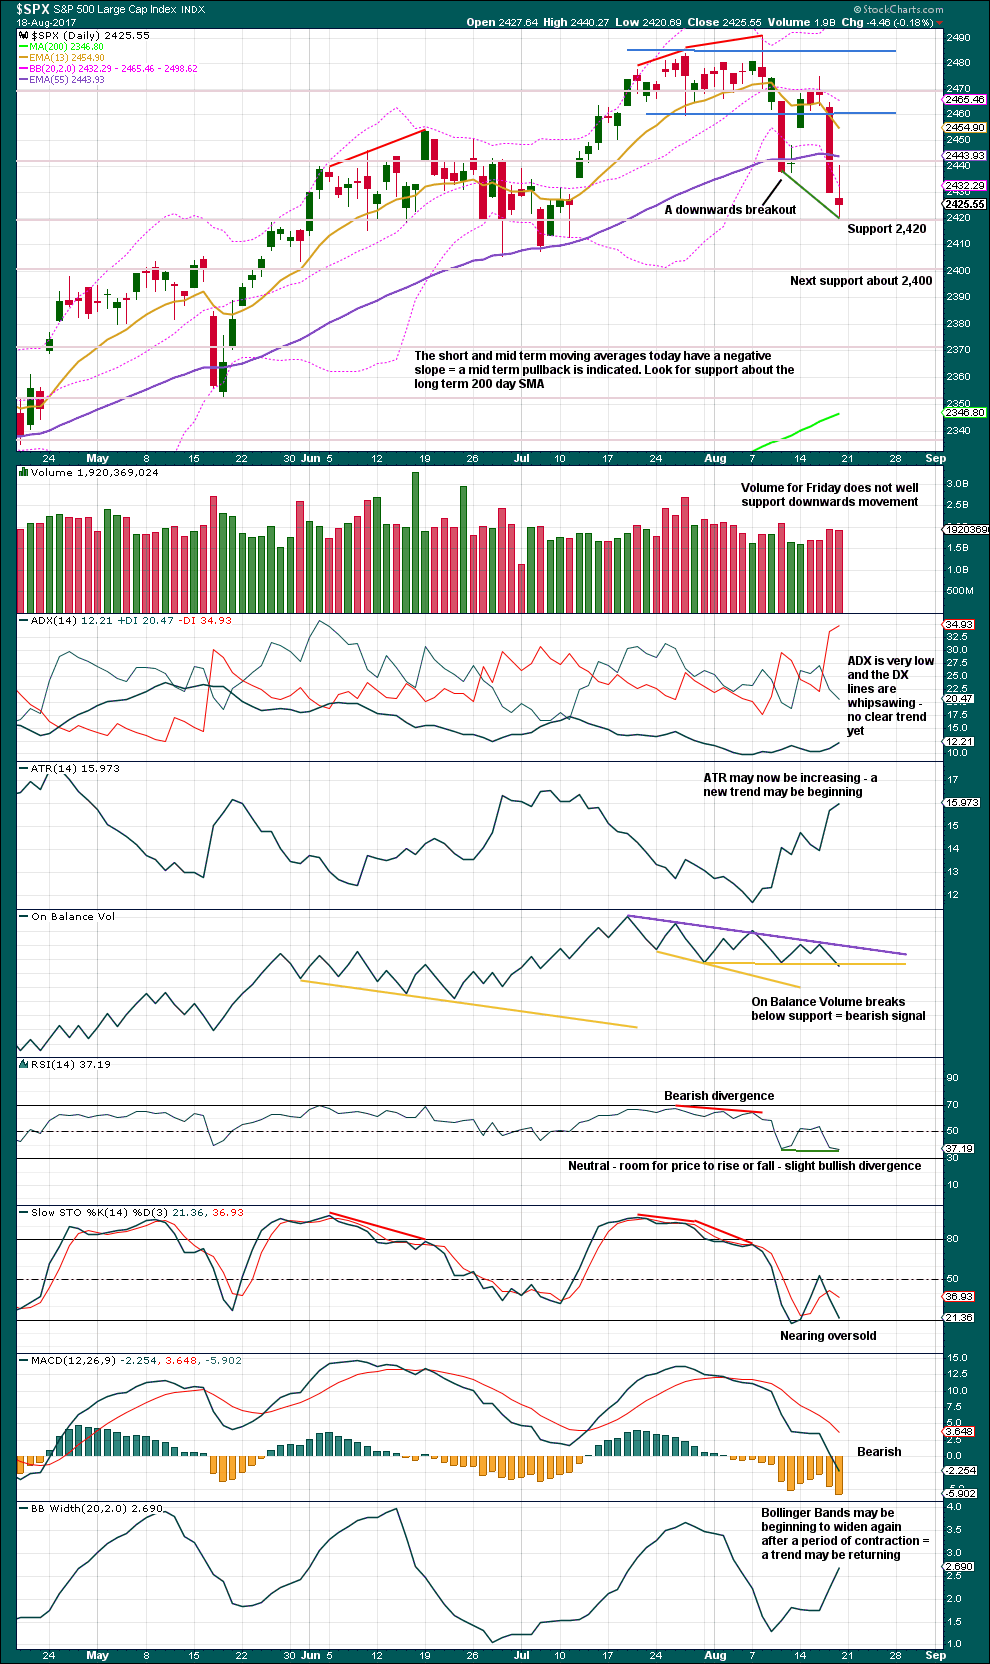
Price bounced up off support about 2,420.
The long upper wick for Friday’s candlestick is bearish.
Overall, volume is showing some increase as price falls, but Friday was slightly lighter than Thursday.
Give some weight to the bearish signal from On Balance Volume.
Bullish divergence between price and RSI is very slight. This divergence will not be given much weight.
Overall, the chart looks reasonably bearish.
VOLATILITY – INVERTED VIX CHART
Click chart to enlarge. Chart courtesy of StockCharts.com.
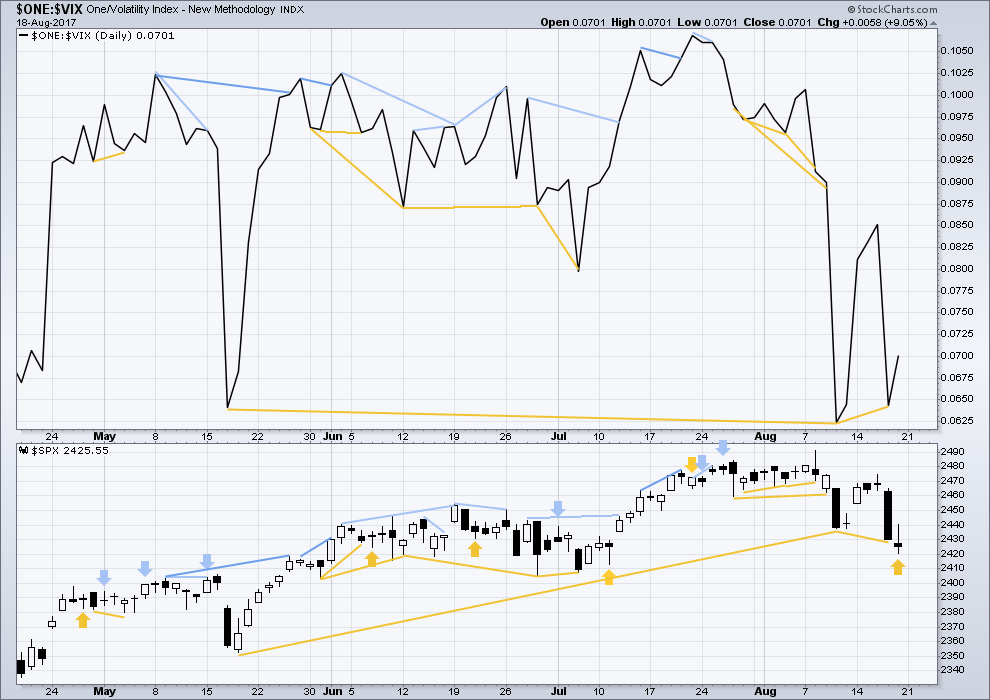
Normally, volatility should decline as price moves higher and increase as price moves lower. This means that normally inverted VIX should move in the same direction as price.
There is longer term divergence between price and inverted VIX, shown in gold lines. However, mid and long term divergence has proven to be reasonably unreliable, so it will be given no weight in this analysis.
Short term bullish divergence noted in last analysis has been followed by more downwards movement. It is considered to have failed.
For Friday there is single day bullish divergence: price moved lower, but inverted VIX moved higher. The fall in price did not come with a normal corresponding increase in volatility. This indicates weakness within price for Friday. It may be followed by a green daily candlestick for Monday and / or Tuesday to be resolved.
BREADTH – AD LINE
Click chart to enlarge. Chart courtesy of StockCharts.com.
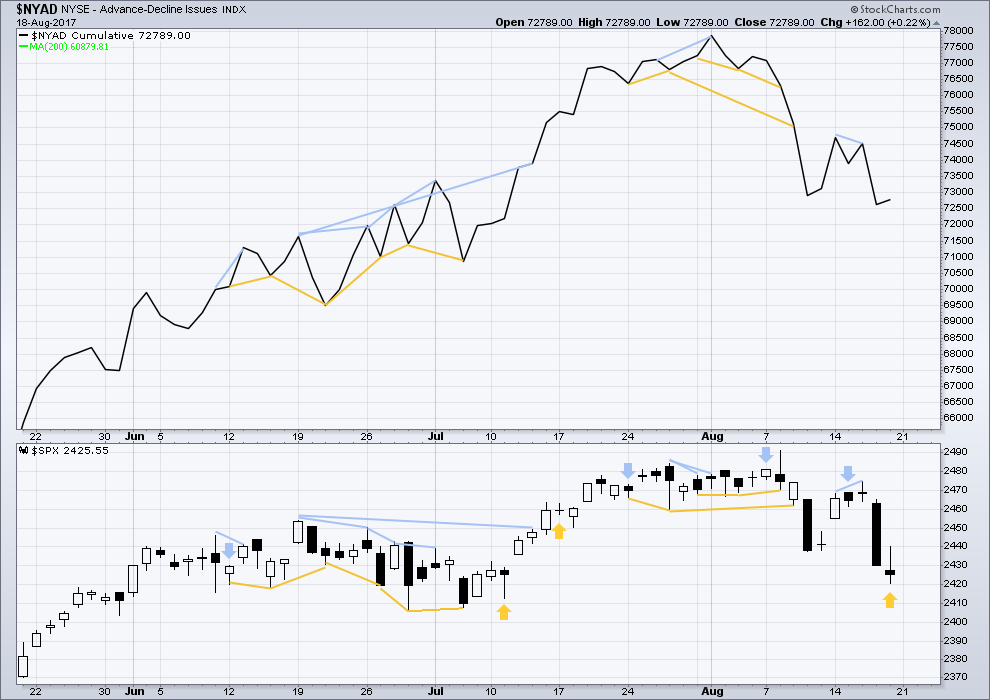
With the last all time high for price, the AD line also made a new all time high. Up to the last high for price there was support from rising market breadth.
There is normally 4-6 months divergence between price and market breadth prior to a full fledged bear market. This has been so for all major bear markets within the last 90 odd years. With no divergence yet at this point, any decline in price should be expected to be a pullback within an ongoing bull market and not necessarily the start of a bear market.
There is single day divergence for Friday between price and breadth: price moved lower, but market breadth improved. This indicates weakness within downwards movement for Friday. It may be followed by a green daily candlestick for Monday and / or Tuesday to be resolved.
DOW THEORY
The S&P500, DJIA, DJT and Nasdaq have all made new all time highs recently.
Modified Dow Theory (adding in technology as a barometer of our modern economy) sees all indices confirming the ongoing bull market.
The following lows need to be exceeded for Dow Theory to confirm the end of the bull market and a change to a bear market:
DJIA: 17,883.56.
DJT: 7,029.41.
S&P500: 2,083.79.
Nasdaq: 5,034.41.
Charts showing each prior major swing low used for Dow Theory are here.
Published @ 11:40 p.m. EST.
Hi Olga! Wonderful to see you back 🙂
I’ll be publishing the analysis early today then getting on the road back home. Have found great waves in Gizzy and seen friends.
Isn’t it?
I sure missed her! 🙂
Travel safely back…
Many thanks – you’re both very kind 🙂
Hourly chart updated:
an expanded flat looks to be completing for minute ii. and it’s not done yet.
It’s interesting to compare the move from Aug 17 to now with the move from Aug 8 to Aug 11. Then what happened on Aug 14 (which would be tomorrow in this comparison). Gap open and run up. Very consistent with this minute 2 being an expanded (expanding!) flat.
Yep! A nice pop to start the session tomorrow and let me exit those UVXY 37.00 strike calls would be picture perfect; the expanded flat is precisely what I hoped was unfolding…tricksy banksters; one of their favorites! 🙂
Price at 1.45 below 1.35 will hedge with short UVXY 37.00 strike calls…
Not stopped out but hedging with sale of 37 strike calls for 2.15 per contract just in case we have more upside….
Have a great evening everyone and see ya in the trenches tomorrow!
We are seeing a classic beat-down of volatility to try and intimidate short side trades. My suspicion is that they are going to have to unwind it sooner rather than later… 🙂
Price back down to 1.49…higher low, or stopped out in my future?
Price moved as low as 1.45 and reversed. There was a time in the old gun-slinging days at Bottarelli Research that we would have added to that order on the move down… 🙂
Getting to old for that kind of speculation…lol!
A bit more risky without a posse…
One guess at structure here is we’ve got a minute 2 XYZ in development, with an X and Y in place, and the Z has completed the A and the B of it’s zig-zag up.
Filled at 1.60 🙂
Mental stop at 1.25
Opened STC order at 2.50 GTC….
If we are ahead of a third wave, UVXY 40.00 strike calls expiring this Friday and now trading for under 1.75 is a good R/R speculative play. Buying, AS A SPECULATION, 50 contracts at 1.70 limit….I may not get filled but here goes….
Looks to me like an attempt to shake out a few cubbies.
The smash of VIX going into the close is just a tad too cute…
We saw this same kind of nerve wracking price action occurring during minor two up and most traders were so accustomed to being violently whipsawed they opted to play it safe and exit short positions, myself included. Deja Vu all over again?
As that famous philosopher well-know for his pithy pronouncements also opined: “You can observe a lot by watching!” 😀
Chris Vermuellen expects an important VIX spike date on August 23….
Wow! They sure are not going gentle, into that good night!
I guess they recognize that if that gap area falls they will not be able to hold onto 2420.00 so they are fighting for dear life. There must be quite a few long stops at the 2420 pivot….
Bulls in quite a dog-fight to keep price out of the 2425.55 area. Quite a lot of buying power expended to fill the gap now they have to keep price above it…if they can…. 🙂
I think we are going to get a sharp move either above or below this contested area….depending on who prevails in the short-term…
I think it is pretty safe to say we are seeing a correction in the current downtrend with increasing downward momentum just ahead. The banksters sure are working overtime though to keep prices propped up…..
Straddle pointing to resumption of the downtrend…
Thanks for the clues Vern. It does feel like the market is in a headlock.
🙂
Attempted VIX beat-down means suppressed option premiums but we should eventually get a directional pop if we are about to get a third wave down…it is like trying to hold an inflated ball under water…..
I’m keeping a very close eye on whether the turn just below the 61.8% retrace holds, or not. I continue to see stagnating prices in my preferred trading tickers, indicating to me that the market is going to start moving down soon. But if the 61.8 retrace falls, all bets off for me.
2425.55 is low of last Friday’s closing 15 minute candle. Perhaps a move back below will provide a directional clue?
Tug-of-war continues. Holding 215 DIA put and 217.50 call, essentially converting directional spreads to a straddle.Both in the red so far so still waiting to see which way price breaks…..”Anticipation….!!” 🙂
Yeah… I know some of you are saying, Hey Verne, what you are holding is not actually a straddle but a strangle!
You are right of course…stangles, shmangles, you get my drift! 🙂
Maybe a nice pop this afternoon to “eclipse” the day’s current high?
great to see you back Olga
Thanks Ronald 🙂
Getting a turn on VIX. Let’s see if we can re-enter green territory and get this party going…!!
Cashed in my short 217.5 puts and switched to 217.5 calls. Currently down 8.00 buckaroos so no upside follow through so far….
2431.3 is about the 61.8 retrace of Friday’s down move. There’s some symmetric support there too. A likely zone for a turn back down this morning.
We are printing a hammer today. We may get a bigger bounce than we are expecting.
Some analysts are all calling this move down an abc zig zag for a second wave of a developing ending diagonal for SPX so that possibility bears close watching….
We also tagged the lower B band this morning…
Puts up 26 buckaroos. Heading higher…for now…. 🙂
Darkness now starting to sweep across the USofA. Somehow very, very appropriate in these dark times. Maybe it’ll shift this market back into reverse too!!
Gaps from this morning in DJI and SPX filled…
This market must be really starting to get top heavy. Remember those days when the banksters would jack DJI futures up by hundreds of points and steam-roll short sellers with the market up a hundred points or more during the regular session?
We have not seen one of those maneuvers in quite sometime; I wonder why? 🙂
217.50 Diamond puts 2.00 in the green. Correction not over yet….
Dunno how that works Verne (only spread I ever put was on bread 🙂 ), but let us know when you see it turn buddy 😉
Indeed! My daughters were partial to Nutella when they were little!
I cannot believe they are now both off to the college life. We bundled off my youngest Christina to Evanston and life at Northwestern a few days ago…Sniff!
Oh dear, I commiserate with you on that one Verne. My son will be getting ready to leave in one more year…. and I’m not looking forward to it.
Diamond 217.50 puts so far holding at – 12.50 so no market maker panic yet…. 🙂
A few auto stocks are bucking the trend today of the sector’s on-going malaise, among them Auto Nation AN, Auto Zone AZO, and Herts, HTZ. The delusion will not last long I don’t think! 🙂
Hoping KSS climbs back toward 40.00 for another date…
Opened up a little canary in the coal mine in the form of a bull 215/217.50 bull diamond credit spread. Watching the action on the bids on both legs to see when the down-turn resumes in earnest….
So far short 217.50 puts down 12.50
When it hits 50.00 down we are heading lower…
I did some re-calculations on where the Unicorn is likely to trade prior to the completion of this fourth wave and based on what it did on minor 1 down with a high of 45.62, I think it would be reasonable to expect it to clear 100 prior to primary four’s completion. If it turns to to be a zig zag, that is even more likely, with a big spike coming as wave C down completes. I expect we should see at least 50-70 for minor three down.
Price has just moved above the upper channel of the move down from Friday’s high. Unless it fails pretty soon we should go higher here.
Those calculations sound good – no doubt Mr M will whipsaw us around. A zigazg would be heaven (so I’m not holding my breath!)
Maybe if we say “Pretty Please!!” ? 🙂
Verne, i get between 53-66 for my wave 3 estimate on the unicorn as well!!
Bingo! 🙂
I can count 5 waves up from this mornings lows (which might be submin 1 of minuette (c) ) – hopefully now a small submin 2 down then blast off upwards for submin 3 of minuette (c).
Below today’s lows that idea is toast and I’ll be watching the 2400 mark to see if minuette (b) is possibly still in progress – i.e. playing the usual wave b tricks on me.
Below 2400 (or near 2440) it’s ‘game on’ for me.
Comparing Friday’s pullback to the minute ii of the minor 1 (aug 9-10), I see this is larger in price moved, and a tad shorter in time. But overall, it looks “nominal” to me as a complete minute ii. It has a clean 3 wave structure up from Friday’s low. Now we have a 5 wave down that has pushed to a new low. That sure looks like minuette i of minute iii to me, and now minuette ii is in play, with minuette iii of minute iii of minor iii just around the corner. Could be all wrong but…my cannon is loaded.
If you are right, we should get a VIX moon-shot in the next hour or so before price starts back down….if that happens I am backing up the 18-wheeler….!! 🙂
Bid on spread up to 2.50, moving like molasses. I know they are NOT happy with the size of that order…lol!
Scalped the Unicorn for a quick 25% pop this morning. In at 3.90 on 40 strike calls, out at 4.80….looking for re-entry…
Yeah – I’ve also been messing around with small scalps of ‘the beast’ the last couple of sessions (though with shares of course – not your voodoo stuff lol 🙂 )
Hoping for a bounce to 2440+ so can get back on board.
I am trading the bounce with a “stink bid” on September 1 215/220 bear diamond credit spread. I am asking the ridiculous credit of 3.10 per contract, currently bid at 2.32.
Let see if the bullish mania pushes price up to get me filled… 🙂
Corrective bounce underway. Time to load the cannons people…. 🙂
We might be finishing off subminuette (c) of minuette (b) with minuette (c) up still to go. As noted below, price is finding support at the lower base channel atm.
Below 2400 minuette (b) would be twice the size of minuette (a) so I’d discard that idea.
There is currently a small RSI div on the 3 min chart
Hi Olga!
So delighted to see you! 🙂
Hey Verne – likewise buddy 🙂
Hello Olga. I was just thinking Saturday, “It would be nice to have Olga back for at least a while.” Nice to hear from you again.
Cheers Rodney – I’m usually lurking in the background.
I’m stuck in a hotel in Budapest today (and done the tourist thing 10 times already here) so thought I’d login and see what tricks Mr Market was getting up to.
Lol!
Indisputable change of trend notwithstanding, they are still trying to juice equities price with a short vol trade. Talk about full blown insanity…!!!!
DAX down over 1% and we have been following their lead of late, so it will be probably be a listless drift down all day, thanks to bankster largesse.
Prior resistance area of 2420 offering some support. A bounce from here is probable. A close below and it’s anchors away! 🙂
With the SPX breaking to the downside of 2420, it looks to me like the correction of Friday is completed. We now have 5 waves down from 2440. We may also be entering a series of 4-5’s to complete Minor 3.
We are at the bottom channel line. Lara has noted while this presents some resistance, it is usually penetrated during a third wave. Lets see if downside pressure has the power to do so and to accelerate.
I suppose we could also be seeing an ‘a’ wave completed on Friday at ~2440 with today’s current low at wave ‘b’. What would be needed now is a ‘c’ wave to complete minute ii up near 2440 or so.
What’s that famous third wave song:
“I just want to penetrate…!”
Or was that celebrate…? Either way one begets the other in this instance no? 🙂
This looks a weird start to minute II so far!
Maybe minute ii is cooked, and this is minuette i of the emerging minute iii. A climb here that stays below friday’s high would then be minuette ii of minute iii. And if so, some serious downside momentum should be headed our way Real Soon Now! I also note that all my short list of usual high flyer issues that I like to trade are all dogging it, nothing is moving significantly. Nada.
Thanks Lara. Very bearish weekly candlesticks indeed.
Have a great weekend. I intend to do so myself.
Oh, by the way, I am in t he #1 poll spot for the weekend. Great!
well done Rodney,, what happened to that doc guy? watch out for eclipse chasers this weekend,, I guess the traffic is weird already.
I live just miles from the direct path of the best / full view. We have people from all over the US invading our little hamlet. Gasoline prices went up 20 cents per gallon for the week.
I am sure Doc is around. He comes and goes. But he usually doesn’t like it when I take his spot as #1. Do ya Doc?