
The first hour of the session saw a break below the channel on the hourly Elliott wave charts. At that stage, downwards movement was expected, and an increase in downwards momentum was also expected. So far price is fulfilling those expectations.
Summary: The short term target for a third wave is at 2,389. Use the base channel on the hourly chart; look for support initially, and after price breaks below it look for a back test to resistance.
Any upwards bounces here should find strong resistance at the upper edge of the base channel.
A deeper pullback may be expected to last at least 8 weeks and may end about 2,320.
New updates to this analysis are in bold.
Last monthly and weekly charts are here. Last historic analysis video is here.
ELLIOTT WAVE COUNT
WEEKLY CHART
Click chart to enlarge.
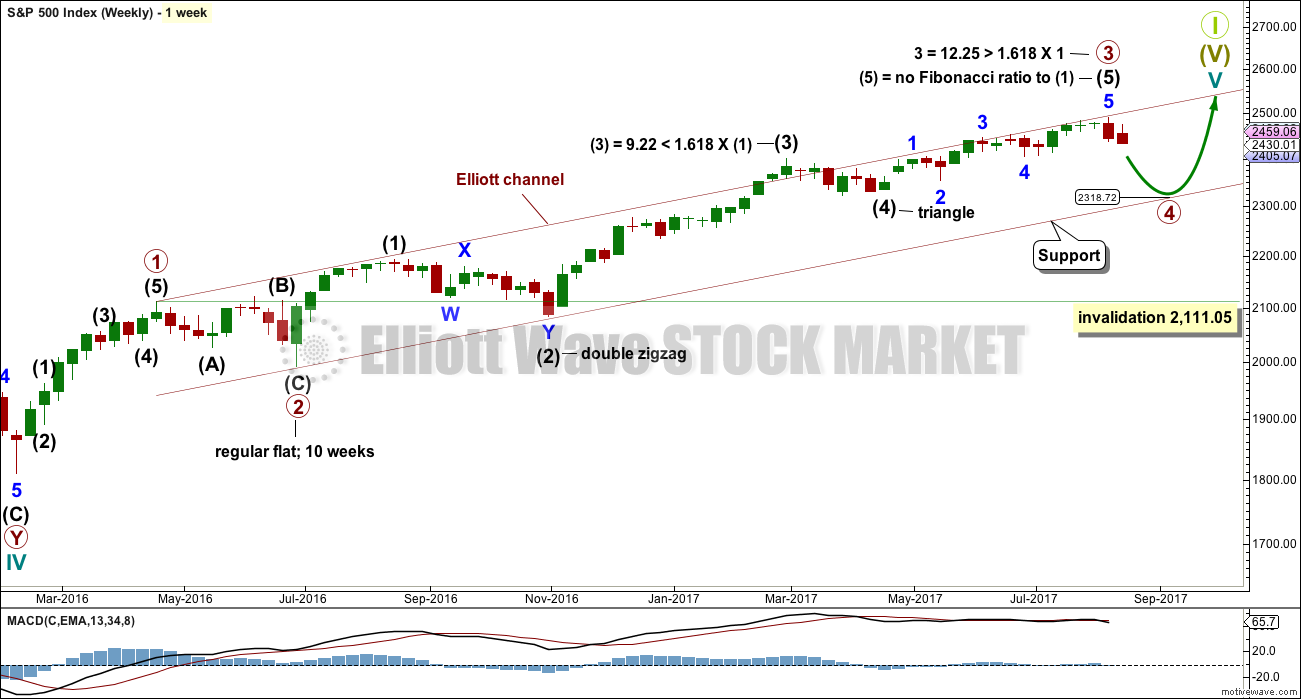
Primary wave 3 now looks complete. Further and substantial confidence may be had if price makes a new low below 2,405.70. Fibonacci ratios are calculated at primary and intermediate degree. If primary wave 3 is complete, then it still exhibits the most common Fibonacci ratio to primary wave 1.
Primary wave 4 may not move into primary wave 1 price territory below 2,111.05.
Primary wave 4 should last about 8 weeks minimum for it to have reasonable proportion with primary wave 2. It is the proportion between corrective waves which give a wave count the right look. Primary wave 4 may last 13 or even 21 weeks if it is a triangle or combination.
If primary wave 4 reaches down to the lower edge of the Elliott channel, it may end about 2,320. This is very close to the lower range of intermediate wave (4); fourth waves often end within the price territory of the fourth wave of one lesser degree, or very close to it.
The final target for Grand Super Cycle wave I to end is at 2,500 where cycle wave V would reach equality in length with cycle wave I. If price reaches the target at 2,500 and either the structure is incomplete or price keeps rising, then the next target would be the next Fibonacci ratio in the sequence between cycle waves I and V. At 2,926 cycle wave V would reach 1.618 the length of cycle wave I.
DAILY CHART
Click chart to enlarge.
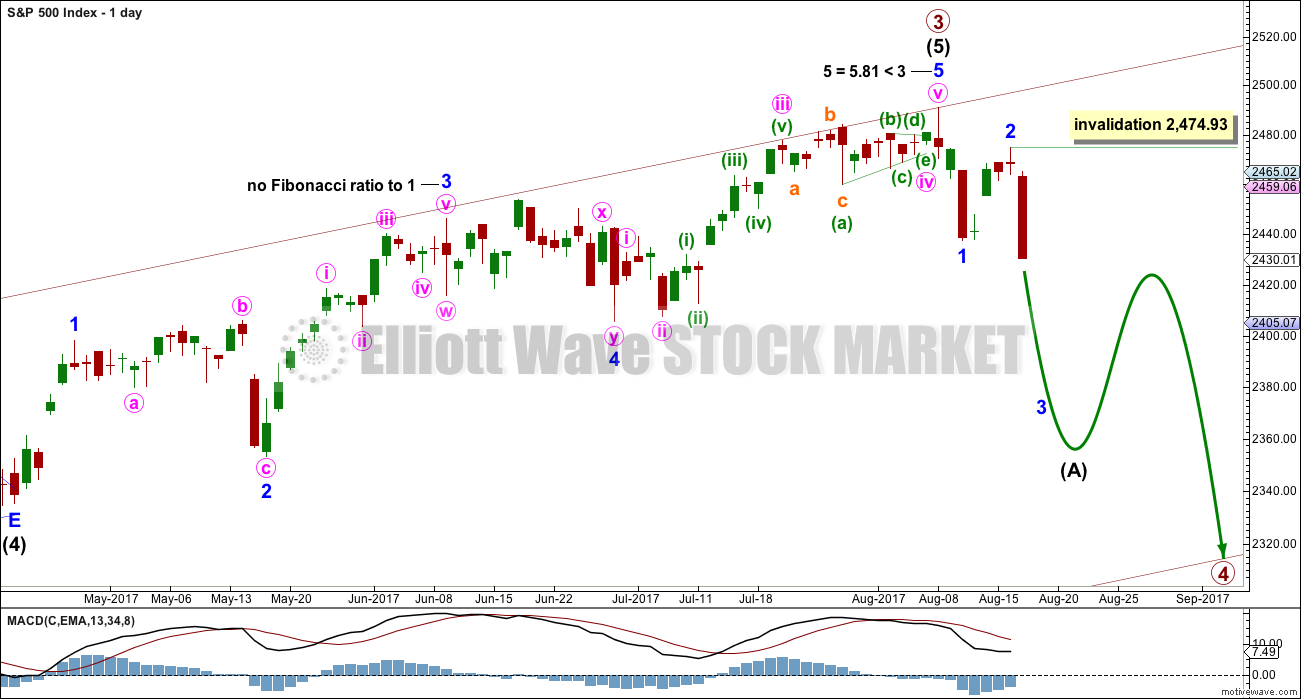
The daily chart shows only the structure of intermediate wave (5); this structure is an impulse.
Primary wave 2 was a regular flat correction lasting 10 weeks. Given the guideline of alternation, primary wave 4 may most likely be a single or double zigzag. Within both of those structures, a five down at the daily chart level should unfold. At this stage, that looks incomplete.
While primary wave 4 would most likely be a single or double zigzag, it does not have to be. It may be a combination or triangle and still exhibit structural alternation with primary wave 2. There are multiple structural options available for primary wave 4, so it is impossible for me to tell you with any confidence which one it will be. It will be essential that flexibility is applied to the wave count while it unfolds. Multiple alternates will be required at times, and members must be ready to switch from bear to bull and back again for short term swings within this correction.
Members with a longer term horizon for their trading may wait for primary wave 4 to be complete to purchase stocks or enter the index long.
HOURLY CHART
Click chart to enlarge.
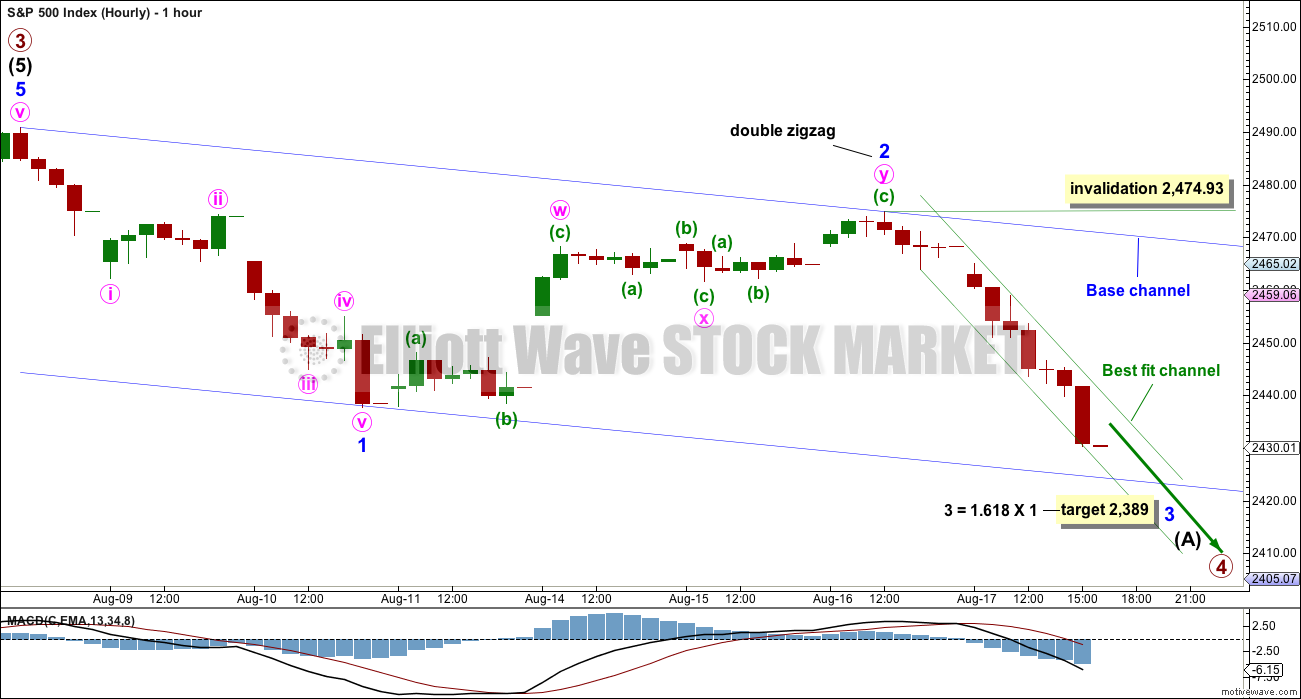
Minor wave 1 downwards looks very clear as a five wave structure.
Minor wave 2 upwards ended just above the 0.618 Fibonacci ratio. Minor wave 3 downwards has now made a new low below the end of minor wave 1, meeting the Elliott wave rule.
Minor wave 3 does not yet exhibit stronger momentum than minor wave 1, so a further increase in downwards momentum would be expected.
But look out, it is possible that there may be another bounce. Minor wave 3 may only subdivide as an impulse. Within minor wave 3, minute wave ii may show up on the daily chart as a green candlestick or a doji. It may not move beyond the start of minute wave i above 2,474.93. Minute wave ii should find very strong resistance at the upper edge of the blue base channel, if it gets that high.
Use the narrow best fit channel as a guide tomorrow. Expect price to keep falling while price remains within it. If price breaks above the upper edge, then look out for another bounce which would then be labelled minute wave ii.
The target expects minor wave 3 to be an extension. When third waves extend, they do so both in price and time. They often show their subdivisions at higher time frames, which is why minute waves ii and iv may show up on the daily chart.
Use bounces as an opportunity to enter the downwards trend. Always use a stop and invest only 1-5% of equity on any one trade.
TECHNICAL ANALYSIS
WEEKLY CHART
Click chart to enlarge. Chart courtesy of StockCharts.com.
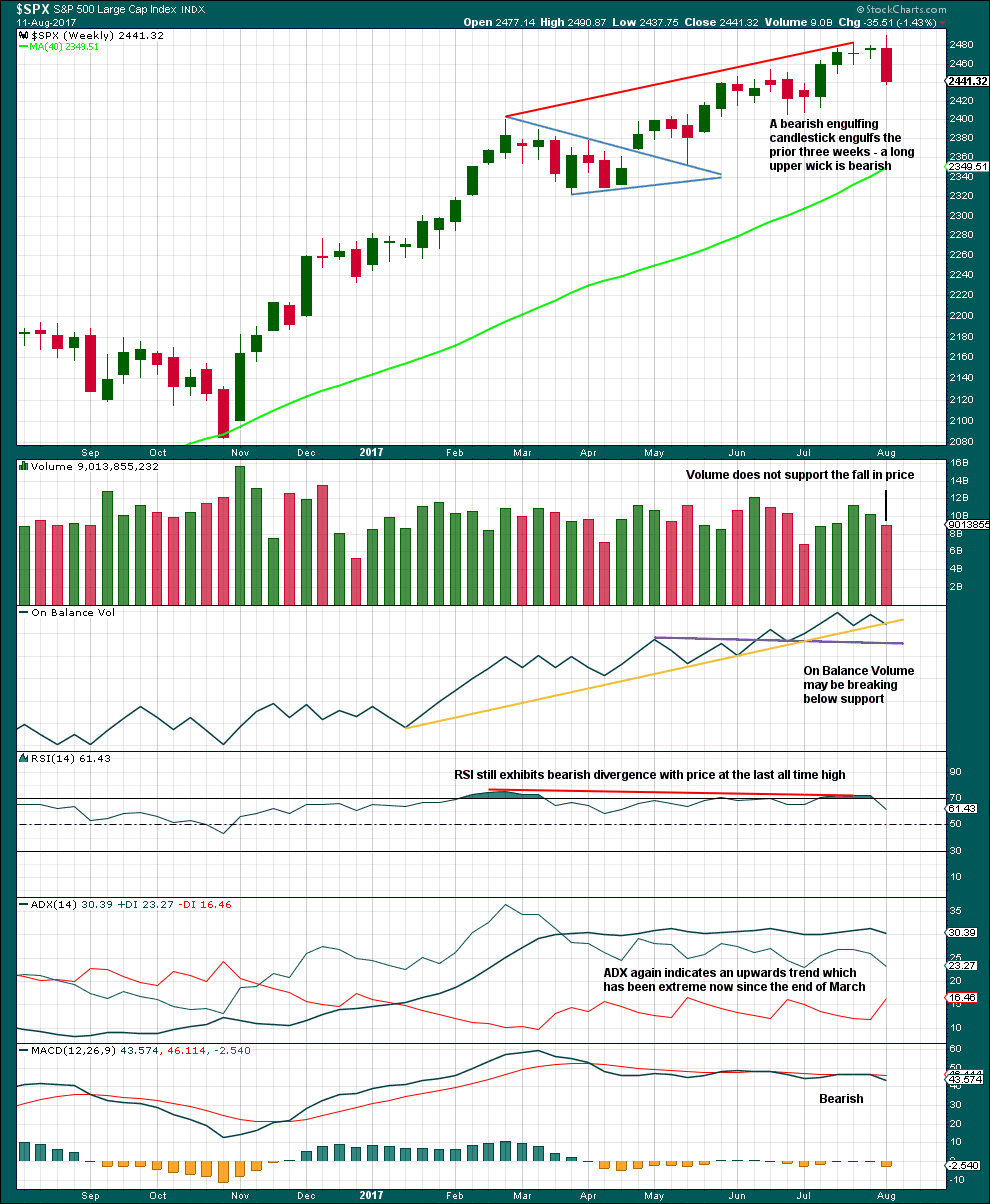
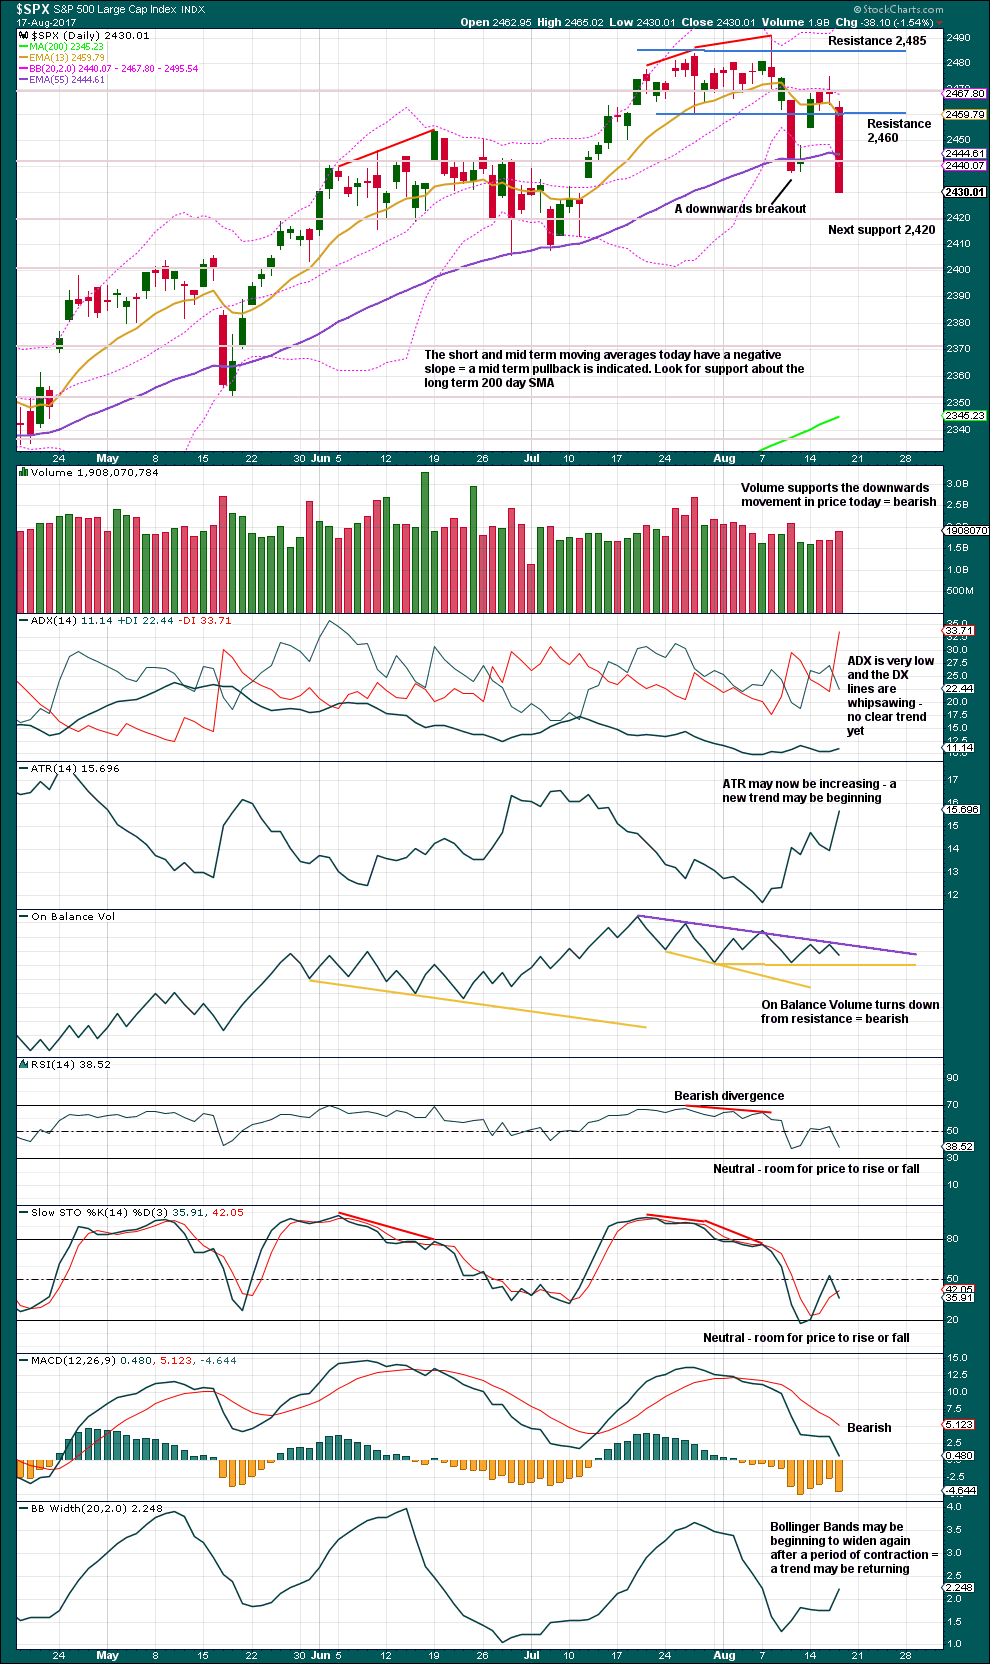
This weekly candlestick is very bearish. A Bearish Engulfing pattern is the strongest reversal pattern.
If this week also moves price lower, then On Balance Volume would give an important bearish signal. For now it may offer some support and assist to initiate a bounce here.
RSI, ADX and MACD all remain bearish.
This weekly chart offers good support to the Elliott wave count.
DAILY CHART
Click chart to enlarge. Chart courtesy of StockCharts.com.
Give some reasonable weight today to the bearish signal from On Balance Volume. The purple resistance line has now been tested five times and has a shallow slope. It offers reasonable technical significance. That line may now assist to halt any bounce from being too deep or long lasting if it continues to offer resistance.
While ADX still does not indicate a downwards trend, ATR indicates a returning trend and Bollinger Bands agree.
With RSI and Stochastics neutral, there is still room for price to fall lower. Look for next support about 2,420. If price falls through that, then next support is about 2,400.
VOLATILITY – INVERTED VIX CHART
Click chart to enlarge. Chart courtesy of StockCharts.com.
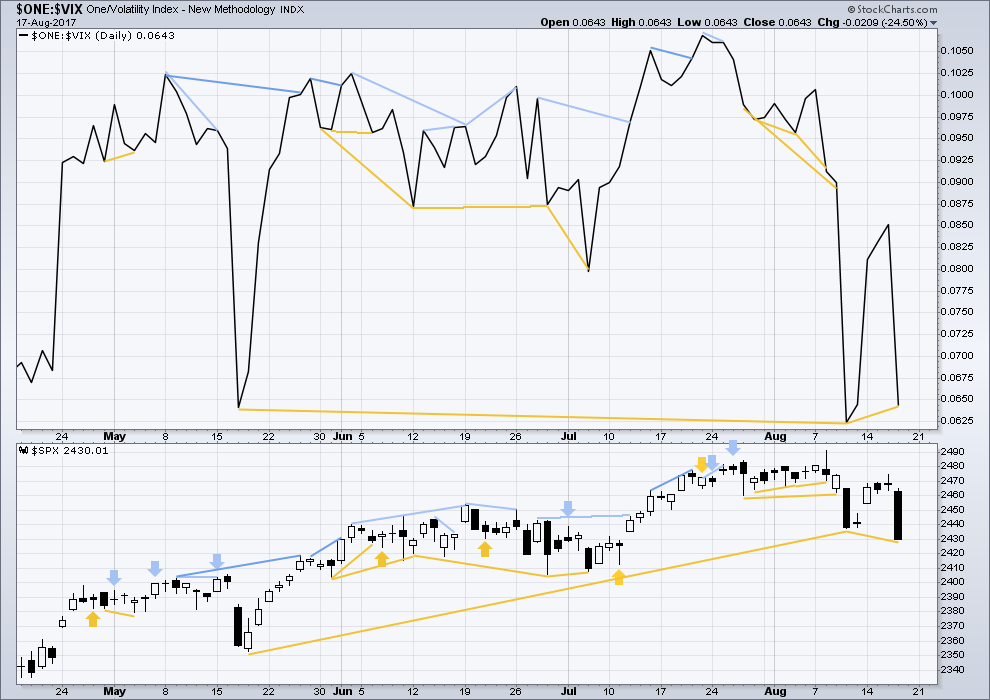
Normally, volatility should decline as price moves higher and increase as price moves lower. This means that normally inverted VIX should move in the same direction as price.
There is longer term divergence between price and inverted VIX, shown in gold lines. However, mid and long term divergence has proven to be reasonably unreliable, so it will be given no weight in this analysis.
There is short term bullish divergence today between price and inverted VIX: price has made a slightly lower low from the last low five sessions ago, but inverted VIX has not. This indicates some weakness today within downwards movement from price. However, because there is no similar divergence today between price and the AD line, very little weight should be given to this divergence between price and VIX; it may just disappear tomorrow.
BREADTH – AD LINE
Click chart to enlarge. Chart courtesy of StockCharts.com.
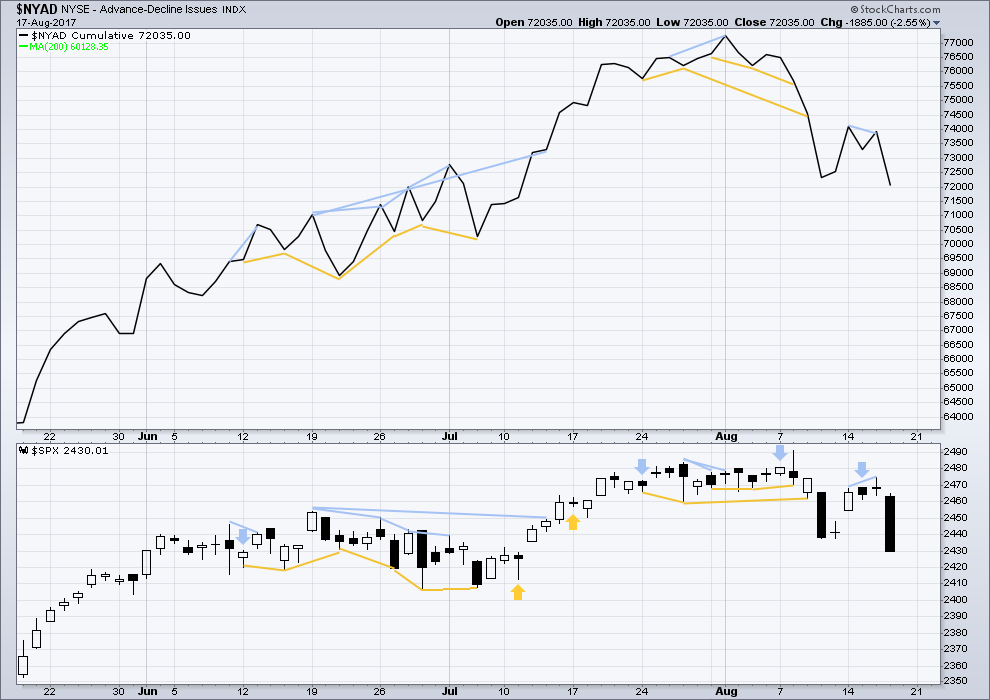
With the last all time high for price, the AD line also made a new all time high. Up to the last high for price there was support from rising market breadth.
There is normally 4-6 months divergence between price and market breadth prior to a full fledged bear market. This has been so for all major bear markets within the last 90 odd years. With no divergence yet at this point, any decline in price should be expected to be a pullback within an ongoing bull market and not necessarily the start of a bear market.
There is no divergence today between price and market breadth. The fall in price today has support from a corresponding fall in breadth.
DOW THEORY
The S&P500, DJIA, DJT and Nasdaq have all made new all time highs recently.
Modified Dow Theory (adding in technology as a barometer of our modern economy) sees all indices confirming the ongoing bull market.
The following lows need to be exceeded for Dow Theory to confirm the end of the bull market and a change to a bear market:
DJIA: 17,883.56.
DJT: 7,029.41.
S&P500: 2,083.79.
Nasdaq: 5,034.41.
Charts showing each prior major swing low used for Dow Theory are here.
Published @ 06:41 p.m. EST.
Updated hourly chart:
I’d expect minor 3 to extend, and so to be stretched out and show its subdivisions at the daily chart level. So minute ii should show up at the daily chart level. So far today may close green, which would see it showing up as one green candlestick.
I’d still look for minute ii to be an obvious three wave structure, and so it doesn’t look done yet. Looking now for the 0.618 Fibonacci ratio to be the target.
We made a new low today towards the close but the Vix was down. This is concerning. Perhaps pence is coming back over the weekend to take over for downtrodden trump and the market rallies Monday.
My current guess is that minute 2 is OVER (the high at the 38% retrace of minute 1), and we’re seeing the initial stages of minute 3. But it may just be my bear colored glasses I’ve got on, lol!!!
I think it just might be bear coloured glasses. Or beer glasses? 🙂
Gotta be the beer goggles.
Maybe beer colored glasses for you high boozing Kiwi’s and Aussies. Us crazy California day traders often wear bud colored glasses, nice reddish tint, a veeeeery bearish look!!! But calming, very calming.
I’ll drink to that! 🙂
It does not happen very often, but every now and then the position of market makers becomes so untenable that you can literally take them out back and spank them within and inch of the monetary existence. Major trend turns at option expiration dates is one such occasion…. 🙂
Now that we have seen a 38% correction of the move down from 2474, we need to break the 2420 level with acceleration to the downside. This would lend confidence that we are in Minor 3 of Intermediate A.
Clear break down through the 21 ema on 5 minute. I’m calling minute 2 over unless/until proven otherwise, and have a pilot short in place.
I have not watched this moving average until you mentioned it yesterday. I suspect you have been following it for some time. You assessment is looking good to me. I hope you are correct because I added to my short positions just a bit ago near the top of the suspected minute 2.
I always keep a Keltner channel on my chart (almost always) with a 21 period. I vary the amount of standard deviation to “best fit” the action at the time period I’m looking at. For SPY I usually have it optimized for 5 minute bar action, and for that I use a deviation factor of 2.8 (I realize different keltner channel set ups on different platforms structure the parameters differently, mine is on IBS’s trader workstation). For many, many tickers, I find the keltner channel when properly set up can really help identify extremes that enable great count-trend/range trades. And, that 21 ema can definitely help you stay in a trend, and vice versa. Best of luck. Looking like today may just go out quietly sideways, BUT…I’m a bit suspicious of what might start up right around 3:30pm. They could start heading for the exits all at once. Or as Verne suggests…they could start doing the exact opposite!! Crazier things happen regularly.
Posting here real quick so I can come back to this comment later. I am also a 5 min Keltner fan! My most common screen.
As the man said….
https://www.youtube.com/watch?v=e7qQ6_RV4VQ
We should get confirmation that the bounce is over with a VIX moon-shot as all the would-be giddy bulls go…. “Oh Uh…!” 🙂
Looking like a leading diagonal off the highs this morning. I read somewhere diagonals represent an effort to oppose a developing change in trend…ya think???!!! 🙂
I think we have at least one more push higher…
If we go back in the red today after this puny attempt to rise off the mat, well, all I can say is: “Farewell and Adieu, to you Spanish Ladies…!” 🙂
These are the moments when we as traders get to reflect on how irrational markets can be. Sometimes we forget that the vast majority of market participants are not necessarily chart watchers, and we are often stunned at how, as someone sagely said, markets can continue to be irrational longer than we can remain solvent, sometimes going on for literally years, in the face of contrary indicators. Markets move on sentiment, and sentiment is not always rational. Go bulls!! 😀
Atta boy, BTF dippers….buy, buy, buy!!!! 🙂
This looks like a flat correction, with the C wave having a 5 wave structure, and I can count 5 waves completing right where it just got darn close to the 38% retrace of minute 1. Could be over (or not, I counted the move down yesterday well short of its end point so meh! I may be doing it again). I’ll be watching for a break down through the 5 minute 21 ema for confirmation, it seems to be working well over the last day.
There are people out there among the BTF dippers, who have decided they are going to be really clever and load up over the weekend, hoping to wake up to sky-high futures Monday morning. That is the way it has always worked isn’t it?
🙂
I’m suspicious that today may go the other way. With this very weak bounce, lots of people very worried (and lots of algo’s starting to flash “sell, take profit”), sky high profits riding in general, crazy politics all over the world, they may very well want to bail or lighten considerably before the weekend. That could drive a screamin’ minute 3 down here before end of day. Or the day and week may just trickle to a close. We’ll see!
Bounce should take us to at least the middle of the channel around 2450.00 hopefully.
Here’s hoping the BTFD crowd are still prepared to give us all better entry positions… 🙂
Lara did mention that 2420 could act as resistance (the bottom of the base channel), which seems to have played out shortly after the open. I am rather skeptical of any movement (in either direction) this morning since it seems to have come at relatively low volume. The international markets did not sell off as hard as last week, but according to all momentum indicators, both Asia and Europe began their slowdown sooner than the U.S., so I expect them to lose considerable ground in the next several weeks. Now that this morning’s gap has been filled I think we get another quick acceleration to the downside and then a healthy bounce for minor 4.
Minor 4?? Hmm. We are in a minor 3 (down), and we’ve only completed (most likely) minute wave 1 of the minor 3. The action is probably in the minute wave 2 bounce now. We’ve got a minute 2, 3, 4 and 5 to get through before we are at a minor 4. Many days away. The next significant move down should be the minuette 1 of the minute 3, after this minute 2 completes it’s push up (possibly today, possibly Monday). I don’t expect any fresh significant downward push in the very short term (next few hours), I expect this minute 2 to get at least 38% of the way back up minute 1. (Assuming I know what I’m talking about which is always questionable, lol!!). Also, the 2420 area resistance is due (IMO) to it being the 1.27% extension of the minor 2. One of the first things I always do in assessing up and downmoves is find the 1.27% extension of the prior countermove. Always a likely target/turn point.
Just to be clear, I was referencing the beginning of minute 3 after this bounce off the bottom of the channel (minute 2) to fill the gap and retrace somewhere to the middle of the channel. It’s now clear that minute 2 has started. Based on the action we saw for minor 1, I would expect minute 3 of minor 3 to begin at the end of the day today or Monday. We have already made it to the .38 Fib retrace but the length doesn’t fit very well and stochastics has a ways to go before we reach overbought territory. FWIW I don’t think minor 4 will begin until later next week.
Strong VIX divergence is signaling we could be in a final wave down. Look for a bounce next…
2440 would give us fib .38, 2454 fib .618 retrace. I think if we get it we may bleed off towards the end of the day. Monday will be interesting then with all the talk about Hindenburg omens, valuation, president trumps business council disembarking, maybe some more NK noise, we could have a 90 percent down day then. will president trump just say no to the working group holding up the market to punish all those CEO s who embarrassed him, nah he wouldn’t do that.
Qqqs .38 about 142. .618 143 retrace approx. qqqs leading so may give us a clue where the retrace stops provided btfd does juice the shorts to death.
Looks like the bounce is coming and a chance to add some shorts hopefully.
Hope everyone has a great weekend!
Will BTFD work today and next week as it has for 1.5 Years straight?
And for that matter… 8.5 Years straight?
Although it at times has not seemed like it the last several months Joe, the banksters, whether they know it or not, are subject to forces much larger than themselves. It would appear that such forces are now in play. They repeatedly stepped in last session to attempt to “manage” the decline which no doubt would have been more precipitous absent their intervention. Nonetheless prices continued downward and that in the absence of any significant selling pressure. Prices are falling during a time of prevailing bullish sentiment so you can imagine what comes next as fear takes hold. On the technical side, there are few things happening that we have not seen for over a year now, including some movement below key moving averages. The thing that strikes me as most significant though is the completion of rising wedge patterns across a number if indices, particularly DJI. We had the classic throw-over the wedge’s top boundary, and now a descent that has taken out its lower boundary. The measured rule strongly suggests a return to the wedge’s inception, around 20,400.00 or thereabouts. Another interesting matter is that smaller wedge also seems to have been part of a much larger rising wedge pattern. Of course the BTFD crowd and the banksters will continue to do what they have always done – that is after all all they know. Will the outcome this time be different?
I have a strong suspicion that indeed it will! 🙂
Excellent explanation Vern… I guess we shall see soon enough!
As an aside, I love the way business news is trying to pin the decline on Gary Cohen possibly leaving.
Quite frankly, he should have never been hired in the first place. I for one would be happy if he exits!
Gary Cohn. The reason for the market move down?? A GS guy leaving? My recommended solution to such nonsense: shut off the business news…forever. Proof positive that most of what is said is utter garbage by “reporters” who know virtually nothing about the markets! ps: funny coincidence, I made a quick profit on the GS price pop this morning (because “Cohn is leaving”, lol!!).
In some timeframe…it will work!! Only question is, how long you expecting until you get into profits? This time may be a bit longer than we’ve had for well over a year. Lara’s projection: 8-21 weeks before we hit bottom. We are about 1.5 weeks in. So YES…but you might want to wait a bit for the dip to dip a lot more!
I opted to scalp the initial move down which I think was the prudent thing to do until we had some additional confirmation of the larger trend change. I now want to wait for a possible minor two bounce and then I anticipate getting positioned for what I expect will be a multi-week, at the very least, persistent downside move. The relentless pumping of the market the last year so made it imperative that profits on the short side in this market be scooped up early and often, but now I think we are about to get a period where we can let downside profits ride a bit. Lock and Load! 🙂
ps. Occasionally markets start a downside move and have great difficulty managing even a small upside bounce. When if fails to “get up off the mat” so to speak, it is EXTREMELY bearish and generally means a blood-bath is imminent…
Valuable perspective Verne, thanks.
The lower tight downchannel line and the 1.27 external retrace of the minor 1 combine here around 242.25-242.40. It’s a key decision point this morning.
Yup, some kind of turn. Now, do we get another minuette 4 here or is the minute 1 down done?? I suspect done but lets see if that upper tight channel line gets busted. Which is likely to turn out to be right where price is breaking up through the 21 ema on the 5 minute chart; this is a key indicator for me. However, this could turn back down and drop quite a bit more, ala Lara’s suggestion that downward momentum might actually increase today. G’luck all!
think we’ve just had minuette iV of minute I
Futures are up. Are we buying the dip again? Is it even possible to get two straight long red candles anymore? Guess we’ll see in the morning.
Kudos to Lara for making the call on the last 2 weeks though. Regardless of where we go from here, her perception of the underlying short term bearishness as we were straddling 2475 was on point.
I’m looking to Nov 2015 – Jan 2016 as a model of what this might (generally, not specifically) look like, and it appears from that comparison that we’ve just gotten going to the downside here. If this is like that period, price volatility should jack up as we get more of these very high momentum moves, both down and up. And we should overall be moving down a lot more, in very sharp and almost violent moves, followed by sharp corrections. I suspect that minute 2 isn’t far away myself, this minute 1 looks quite extended, and the minute 2 could be quite a strong rally as the bots and the people “buy the dip”. Should be exciting!
Shorting: the market is appears stalled at the 21 ema (5 minute) which hasn’t been broken (fully) through the entire price fall from yesterday. Easy tiny loss if it does break it now; lots of downside if it doesn’t!! Fall mountain…
hello,,
What the…!!!