
A new low below 2,462.17 in the first hour of the session added confidence to the Elliott wave count which expected a deeper pullback was in the early stages. The target for it to end and the expectation for how long it may last will remain the same for now.
Summary: A second wave bounce will come and will offer an entry opportunity to join the downwards trend, but take profits quickly when they appear and manage risk diligently.
In the short term, while price remains below 2,455.05, expect it to keep falling (the trend remains the same until proven otherwise) to a short term target at 2,426. If price bounces above 2,455.05, then look for it to end about 2,470.
Primary wave 4 may be expected to last at least 8 weeks and may end about 2,320.
Alternatively, if price makes a new high tomorrow, then the target for primary wave 3 to end would be at 2,497.
New updates to this analysis are in bold.
Last monthly and weekly charts are here. Last historic analysis video is here.
ELLIOTT WAVE COUNT
WEEKLY CHART
Click chart to enlarge.
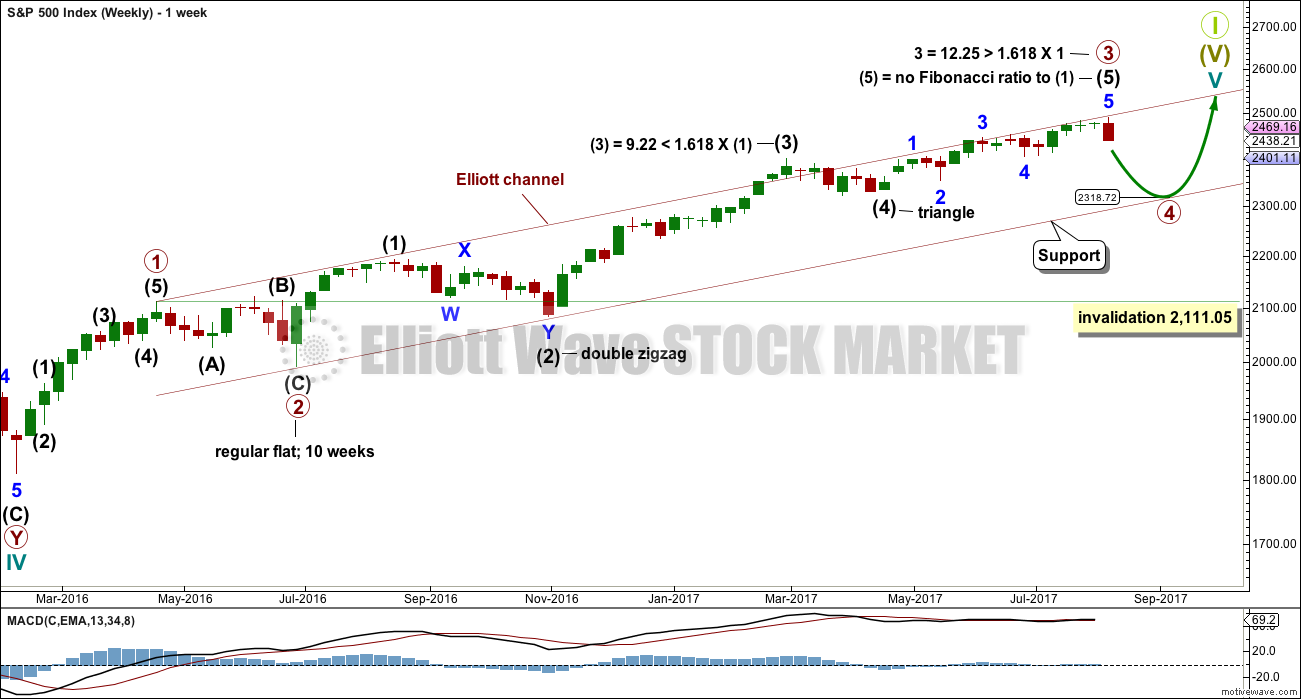
Primary wave 3 now looks complete. Further and substantial confidence may be had if price makes a new low below 2,405.70. Fibonacci ratios are calculated at primary and intermediate degree. If primary wave 3 is complete, then it still exhibits the most common Fibonacci ratio to primary wave 1.
Primary wave 4 may not move into primary wave 1 price territory below 2,111.05.
Primary wave 4 should last about 8 weeks minimum for it to have reasonable proportion with primary wave 2. It is the proportion between corrective waves which give a wave count the right look. Primary wave 4 may last 13 or even 21 weeks if it is a triangle or combination.
If primary wave 4 reaches down to the lower edge of the Elliott channel, it may end about 2,320. This is very close to the lower range of intermediate wave (4); fourth waves often end within the price territory of the fourth wave of one lesser degree, or very close to it.
If price reaches the target at 2,500 and either the structure is incomplete or price keeps rising, then the next target would be the next Fibonacci ratio in the sequence between cycle waves I and V. At 2,926 cycle wave V would reach 1.618 the length of cycle wave I.
At the end of last week, Lowry’s analysis favours the idea that primary wave 4 has begun.
DAILY CHART
Click chart to enlarge.
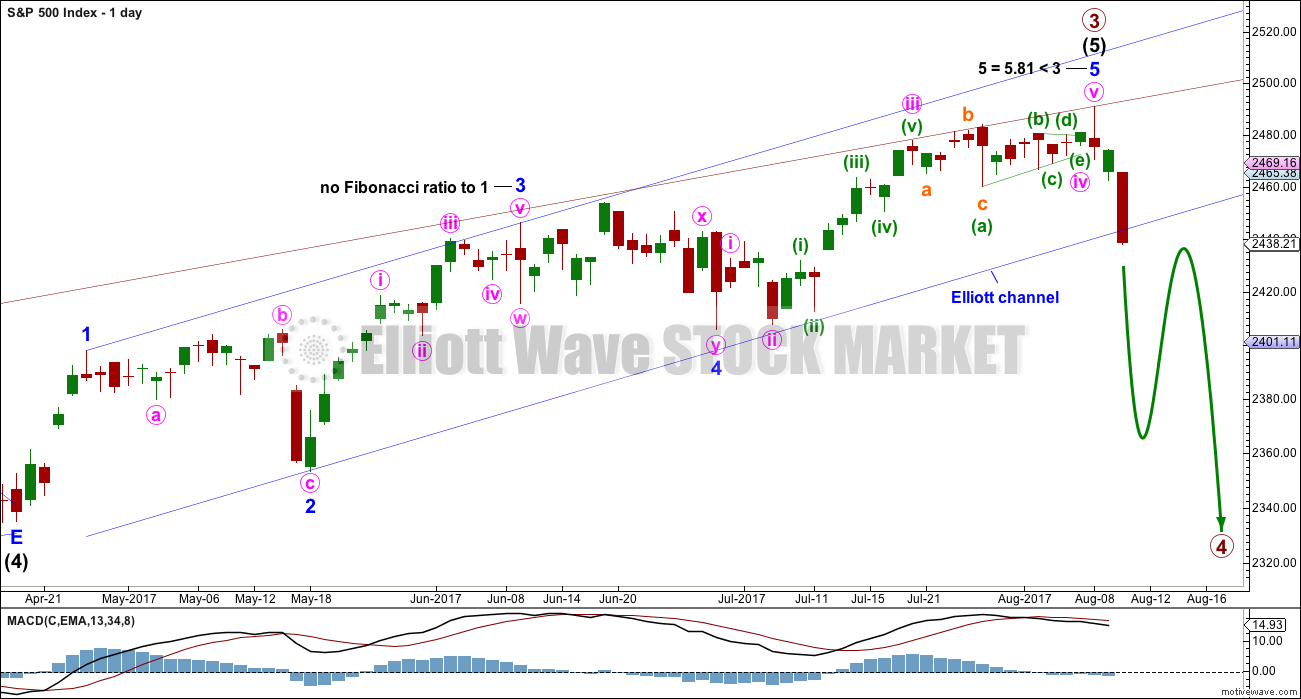
The daily chart shows only the structure of intermediate wave (5); this structure is an impulse.
An Elliott channel is drawn today about intermediate wave (5) in blue. Today’s session closed below this channel, so this is a further indication that intermediate wave (5) is over. If price continues lower tomorrow, then the lower edge of this channel may provide resistance for any upcoming bounce.
Primary wave 2 was a regular flat correction lasting 10 weeks. Given the guideline of alternation, primary wave 4 may most likely be a single or double zigzag. Within both of those structures, a five down at the daily chart level should unfold. At this stage, that looks incomplete.
While primary wave 4 would most likely be a single or double zigzag, it does not have to be. It may be a combination or triangle and still exhibit structural alternation with primary wave 2. There are multiple structural options available for primary wave 4, so it is impossible for me to tell you with any confidence which one it will be. It will be essential that flexibility is applied to the wave count while it unfolds. Multiple alternates will be required at times, and members must be ready to switch from bear to bull and back again for short term swings within this correction.
Members with a longer term horizon for their trading may wait for primary wave 4 to be complete to purchase stocks or enter the index long.
HOURLY CHART
Click chart to enlarge.
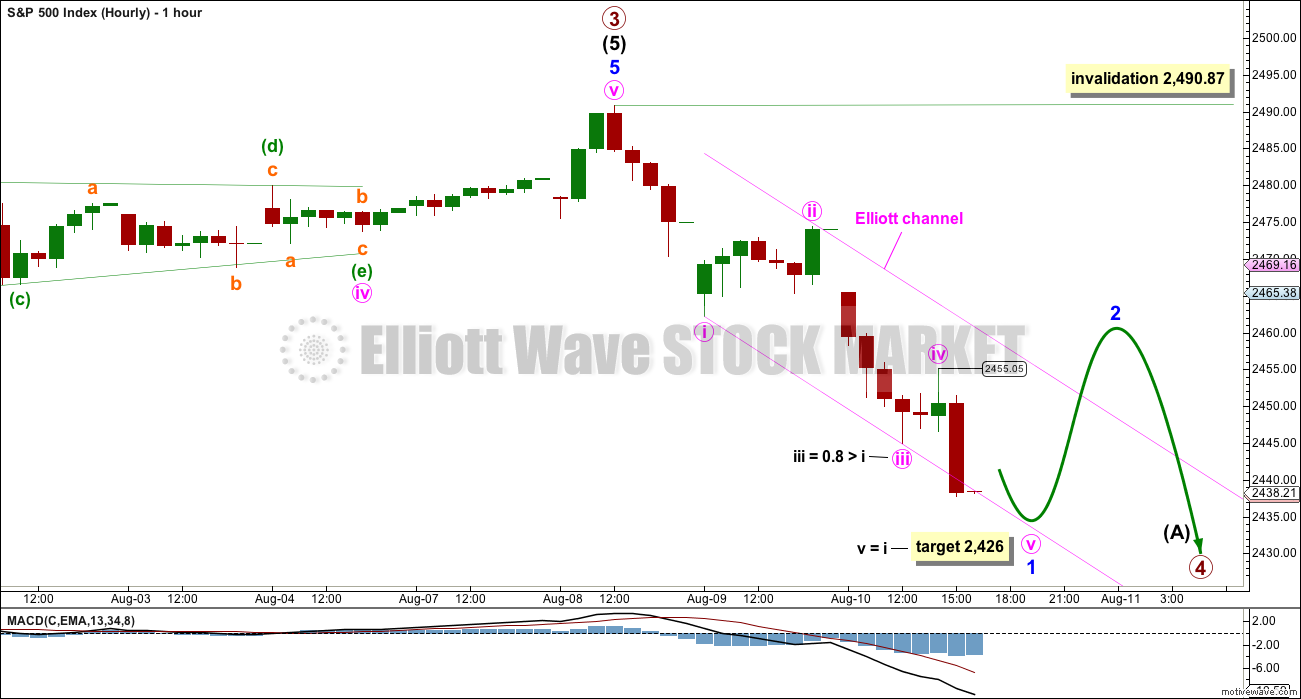
Assume the trend remains the same until proven otherwise. Assume downwards movement will continue until price tells us a bounce has arrived.
While price remains below 2,455.05, then any small bounce may be a second wave correction within minute wave v.
Minute wave iii is slightly longer than minute wave i. This means that minute wave v is not limited. The target assumes the most common Fibonacci ratio for minute wave v.
If price makes a new high short term above 2,455.05, then it cannot be a small second wave correction within minute wave v; so at that stage minute wave v would have to be over. At that stage, assume minor wave 1 is over and minor wave 2 is underway; use the alternate wave count.
ALTERNATE HOURLY CHART
Click chart to enlarge.
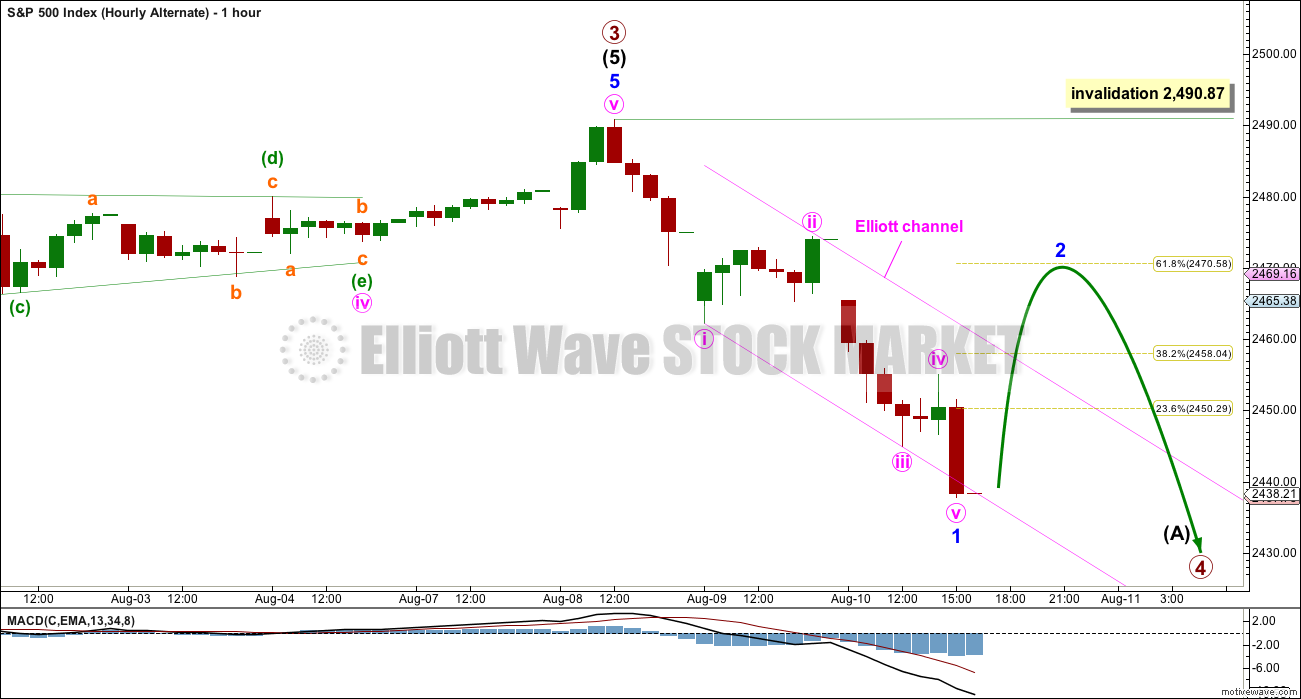
If price makes a new high short term tomorrow above 2,455.05, use this alternate wave count. If price makes a new low first, then adjust the Fibonacci retracement from the start of minor wave 1 to its end.
Look for minor wave 2 to bounce up to the 0.382 or 0.618 Fibonacci ratios, favouring the 0.618 Fibonacci ratio. Expect minor wave 2 to be choppy and overlapping, and to last about two to three sessions.
Minor wave 2 may not move beyond the start of minor wave 1 above 2,490.87.
When minor wave 2 is complete, then minor wave 3 downwards should begin and should show a strong increase in momentum.
TECHNICAL ANALYSIS
WEEKLY CHART
Click chart to enlarge. Chart courtesy of StockCharts.com.
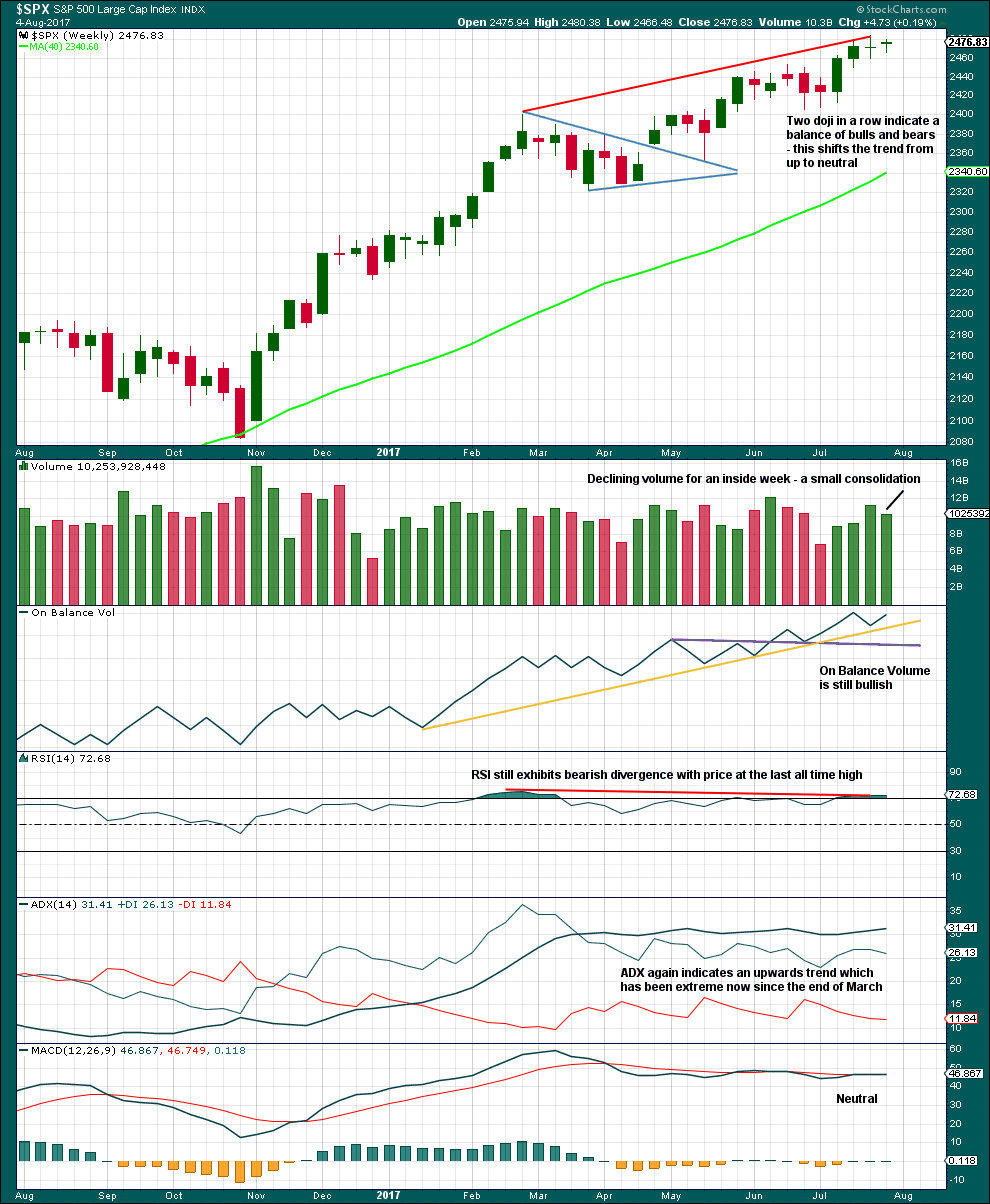
RSI, ADX and the two doji support the idea that primary wave 4 has begun.
DAILY CHART
Click chart to enlarge. Chart courtesy of StockCharts.com.
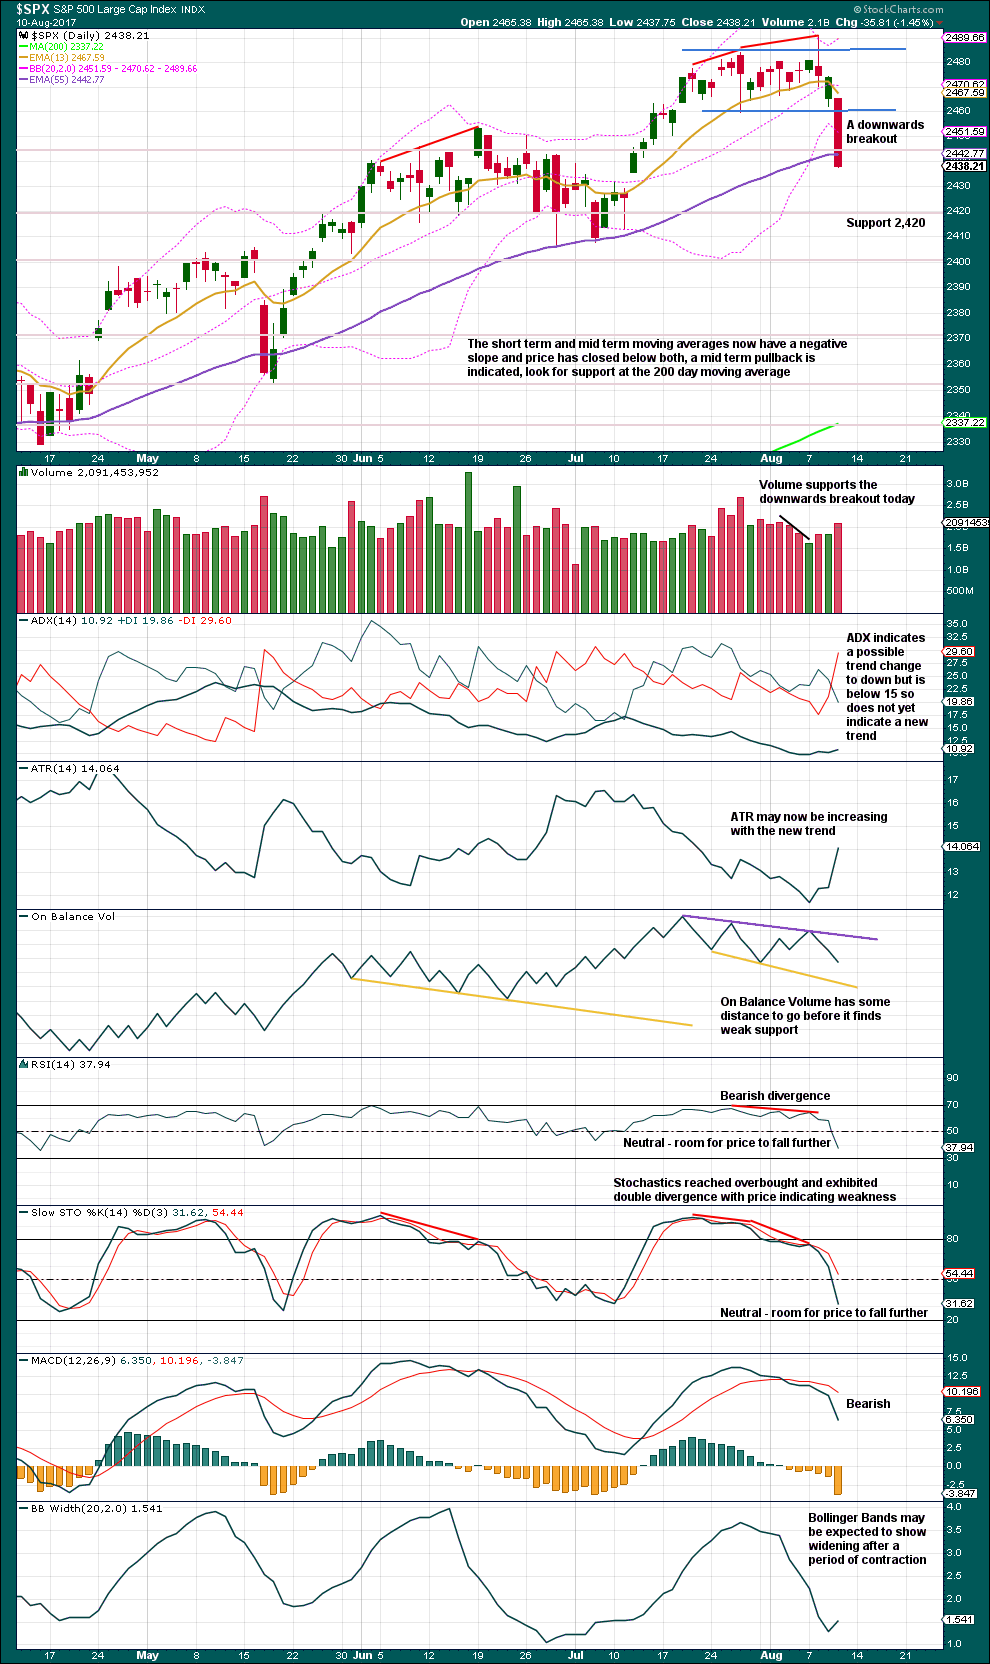
Today is a classic downwards breakout from a consolidation, with support from volume. After the breakout, expect a back test and then for price to move away from resistance. Look now for resistance about 2,460.
Bollinger Bands today widened. ATR strongly increased. ADX indicates a potential trend change to down.
There is room for price to fall further. RSI and Stochastics are not yet oversold. On Balance Volume is not yet at support.
Tomorrow may print another red daily candlestick. A bounce will come. It may end about 2,460, but it may not begin tomorrow.
VOLATILITY – INVERTED VIX CHART
Click chart to enlarge. Chart courtesy of StockCharts.com.
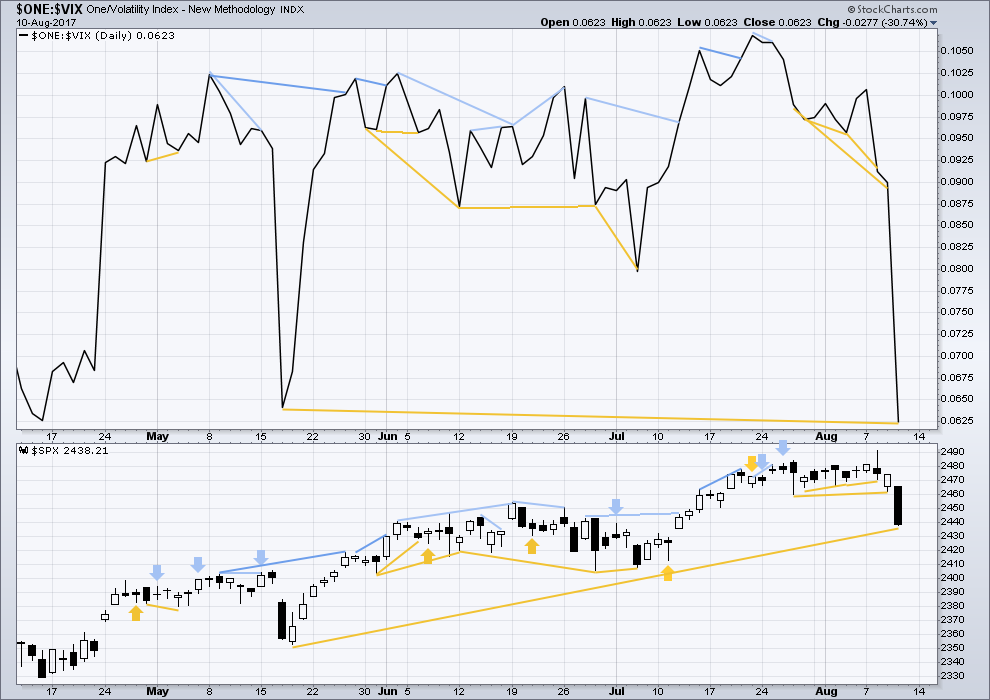
Normally, volatility should decline as price moves higher and increase as price moves lower. This means that normally inverted VIX should move in the same direction as price.
There is longer term divergence between price and inverted VIX today, shown in gold lines. However, mid and long term divergence has proven to be reasonably unreliable, so it will be given no weight in this analysis today.
BREADTH – AD LINE
Click chart to enlarge. Chart courtesy of StockCharts.com.
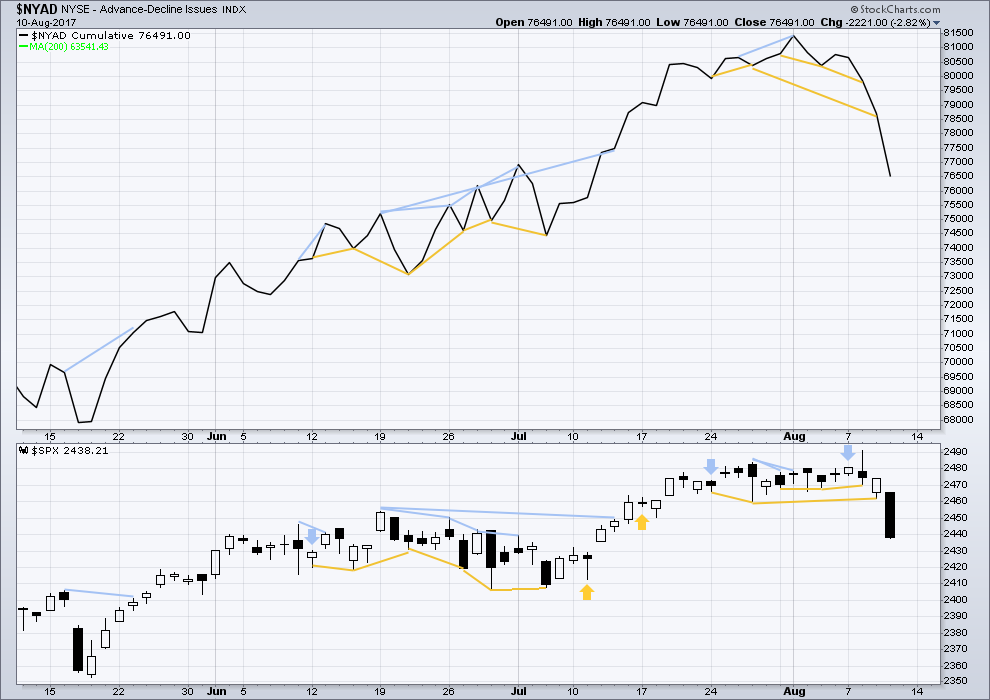
With the last all time high for price, the AD line also made a new all time high. Up to the last high for price there was support from rising market breadth.
There is normally 4-6 months divergence between price and market breadth prior to a full fledged bear market. This has been so for all major bear markets within the last 90 odd years. With no divergence yet at this point, any decline in price should be expected to be a pullback within an ongoing bull market and not necessarily the start of a bear market.
Bullish divergence noted in last analysis has simply disappeared. It is considered to have failed. There is no new divergence between price and market breadth today. Both have fallen to make new lows below prior recent lows. The fall in price today has come with a corresponding normal decline in market breadth, so the fall looks healthy.
Lowry’s measures of internal market strength and health continue to show a healthy bull market. While the bull market overall remains healthy, there are signs at the end of this week of some short term weakness which may indicate a pullback to develop here. This supports the labelling of the Elliott wave count at the daily chart level.
DOW THEORY
The S&P500, DJIA, DJT and Nasdaq have all made new all time highs within the last month.
Modified Dow Theory (adding in technology as a barometer of our modern economy) sees all indices confirming the ongoing bull market.
The following lows need to be exceeded for Dow Theory to confirm the end of the bull market and a change to a bear market:
DJIA: 17,883.56.
DJT: 7,029.41.
S&P500: 2,083.79.
Nasdaq: 5,034.41.
Charts showing each prior major swing low used for Dow Theory are here.
Published @ 11:41 p.m. EST.
Lara posted a very insightful comment on the Gold site about the importance of paying attention to volume when considering the validity of apparent break-outs from a consolidation area. I found it extremely helpful and I am hoping she posts it for the members here as well. I have been quite conflicted recently by the way VIX is acting as I use it as a gauge of what SPX is likely to to do directionally. I have never seen a strong move above the upper BB fail to presage an impending end to a decline. Every time I have ignored it because I thought the EW count called for additional downward movement the VIX signal has turned out to be correct. I recently bolted pre-maturely from some of my short trades as I was expecting the start of a new downtrend would see significant expansion of the B bands to avoid an upward penetration before the downward move had a chance to get going, and that did not happen. It turns out that price moved strongly lower the next three days after the upward initial penetration on Tuesday, instead of reversing and that was most unusual. Downward momentum increased after the long upper wick on Wednesday which was even more unexpected. This could be a very strong warning that we are about to see a dramatic change in volatility with a persistent trend higher after the extended period of low readings. SPX on Friday tagged a trend-line from December and will probably bounce early next week. Lara in her post on volume noted that the breakdown came on high volume which increases confidence that the move down will continue, in contrast to the initial upward break which came on very low volume and turned out to be a false break-out. I am therefore going to give more weight to what volume is saying than the upper BB violation by VIX. While I expect it to retreat back below the upper B bands on any second wave bounce, I suspect going forward we are gong to see VIX put in higher lows and higher highs and also BB expansion to contain price until this primary correction comes to an end. The trend-line from last December is a natural point for a second wave bounce and the next move down should decisively break it if my thesis about what is happening with VIX is correct. Just thinking out loud.
Thoughts are welcome! 🙂
Vix down uvxy up?
They expect things to get ugly more than thirty days out….
That’s the vix futures markets (a blend of which drives uvxy and xiv pricing) discounting the probable volatility/price fall in sp500 early next week.
When I play around with the chart to see minute iv continuing…. a triangle doesn’t look right. The upper trend line is either too steeply sloped or the final E wave wouldn’t see a retracement of minute iii. An expanded flat would require minute iv to strongly breach the channel.
I think this sideways move today is the start of minor 2.
Perhaps I spoke too soon. Vol suggesting we just might get that fifth wave down into the close after all….
Don’t chase this last wave down folks. We will probably get the second wave bounce starting on Monday with a great opportunity to get positioned…
Too late…and why not? We saw it coming, it’s playing out as foreseen so far, and it could (“should”) be accelerating here in the last hour. Though if not in by now, it’s the riskier phase for sure. I’ve got my BE stop already in place. Fall mountain…
We may not get the completion of this impulse until Monday morning. Looking at the five hour chart we see two clear green candles for the second wave so we could get the same for wave four with a sharp fifth down and reversal on Monday.
It is pretty clear on the 5 hr chart that we need one more wave down for a complete impulse. Good proportions with the second, and developing fourth wave so far….
Yep! It’s starting to look like some kind of triangle and probably is a fourth wave; I would guess at minute degree…
Seems to me possible that what Lara had in hourly #1 as minute wave 4 is in fact minuette wave 4 of the minute wave 3 down, minute wave 3 down ended at yesterday’s low, and now we are doing minute wave 4. Which appears likely to me to be a triangle, contrasting with the zigzag of minute wave 2 two days ago. I see a possible a and b leg so far.
If it plays out as a triangle with a break to the downside, I have multiple symmetric projections and a 76.6% fibo retrace around 242 (SPY), and that may be real close to the lower channel line around the time price might get there, making it an even more likely bottom target.
Sounds good to me…
but then minute iii would have a three wave look, not a five
it’s possible, sometimes the S&P does that
but I’d rather go with the third wave in the middle looking like a straight fall down
I think we had an expanded flat for wave four. We should get a new low….
Will the market get nervous and sell into the close fearing a weekend North Korea event or statement ? stay tuned
Very likely. You would have to have huevos of steel (pardon me ladies!)to go into a week-end long this market considering all the geo-political risks. Having said that, it is also possible we get an impulse down completing today and a brisk bounce to start the coming week.
That would be my guess if NK doesn’t do anything or say anything over the weekend. Then the options boys are at play and they have a number in mind, hard to play against big money. Perhaps they are thinking they better get out too….
looks like wave 2 is on the way up.
Still indeterminate. The small upmove so far this morning could be minuette wave 2 of the minute wave 5.
It could still be a fourth wave. I suspect we will finish the impulse down into the close with a nice bear trap ahead of the second wave move up next week. A new low would increase that possibility…unless of course the bottom drops out in a third wave down, but I do think we will see a more significant bounce around 2425.00
No worries, the S&P going to 2900. The kiss of death has spoken!
A posting on Zero Hedge…
Aug 11, 2017 9:37 AM
Gartman Stakes His Reputation That “The Bull Market Has Come To An End”
“We are indeed fearful… very… that this wondrous bull market that began in the spring of ‘09 has come to an end and we do not make this statement lightly for we know the damage that can be done to an already damaged reputation if this statement proves to be wrong.”
It is easy to understand why the talking heads would get all a twitter over the current correction. After all we have not had one all year so of course they are all going to start yelling “The sky is falling! The sky is falling! These guys are complete jokes and I am surprised that anyone still pays any attention to them. All bull markets correct. While there are some very threatening storm clouds on the horizon, the multiple Hindenburg Omens being one example, no one has any basis whatsoever for making a blanket statement that a top is in. It is a silly statement.
You would think that these hapless prognosticators would have learned something after all this time of being so hopelessly, ridiculously wrong. Nothing is wrong with giving an opinion. Making irrational proclamations and worse, staking an already tarnished reputation on the same is truly unfathomable. Just my two cents.
We can get a truncated Primary fifth wave if Trump doesn’t officially execute his tax plan or this NK issue gets worst over time, having us wondering.
Good Morning!
The gap from July 11 should act as a magnet for this first wave down. The close was 2425.53 and the day’s high 2429.3
Hi Lara,
it doesn’t make a whole heap of difference but might we not be forming minute 4 of minor 1 now as your minute 4 looks a bit short/small compared to minute 2?
Yes, that’s possible.