
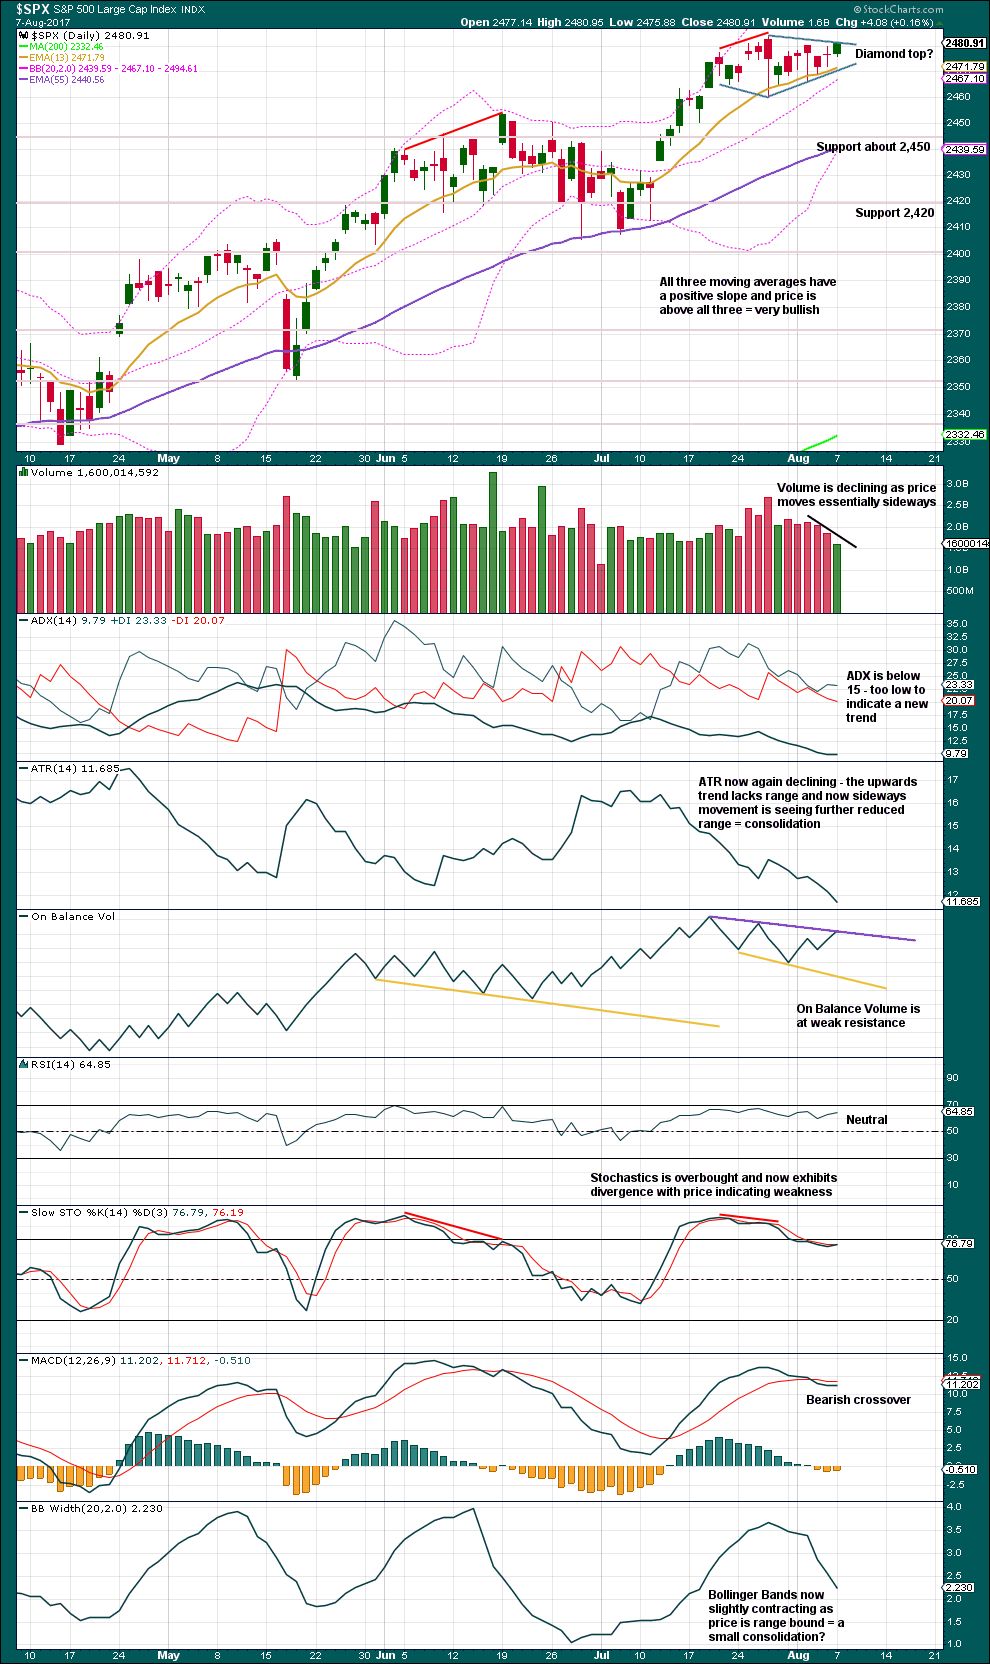
A small diamond pattern may be forming. This supports the Elliott wave count.
Summary: It looks likely now that primary wave 3 may be over and primary wave 4 may be in its very early stages. Some confidence in this view may be had if price makes a new low below 2,459.93.
Primary wave 4 may be expected to last at least 8 weeks and may end about 2,320.
Alternatively, if price makes a new high tomorrow, then the target for primary wave 3 to end would be at 2,497.
New updates to this analysis are in bold.
Last monthly and weekly charts are here. Last historic analysis video is here.
MAIN ELLIOTT WAVE COUNT
WEEKLY CHART
Click chart to enlarge.
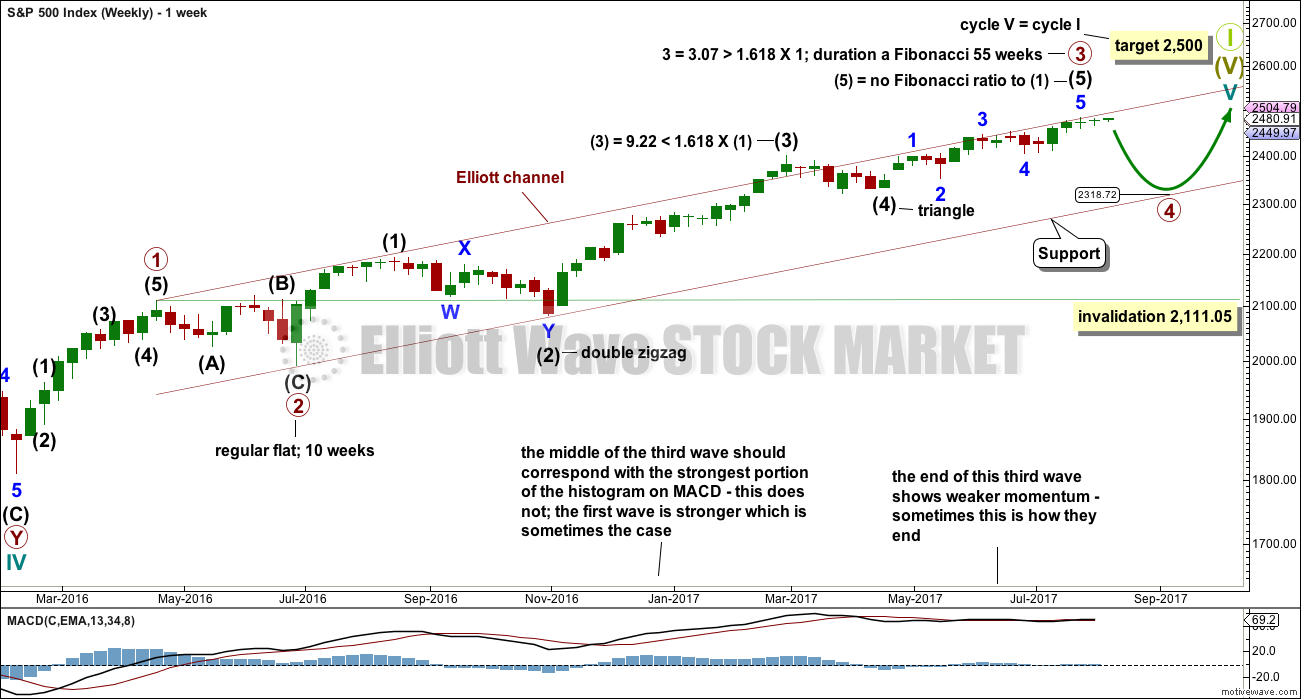
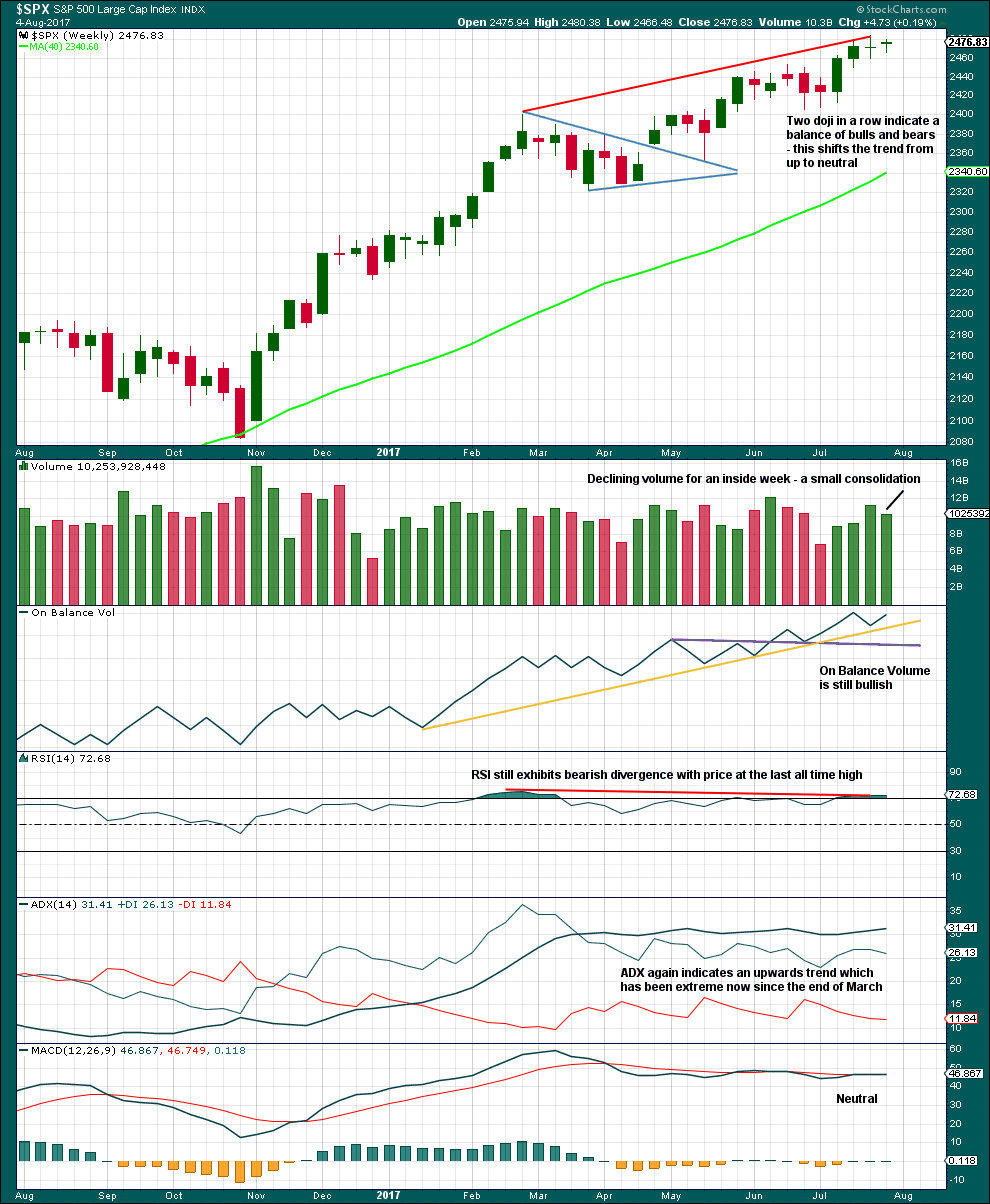
It is possible that primary wave 3 is complete. However, some confidence may be had in this view only with a new low below 2,459.93 now. Further and substantial confidence may be had if price makes a new low below 2,405.70. Fibonacci ratios are calculated at primary and intermediate degree. If primary wave 3 is complete, then it exhibits the most common Fibonacci ratio to primary wave 1. It also perfectly exhibits a Fibonacci 55 weeks duration.
Primary wave 4 may not move into primary wave 1 price territory below 2,111.05.
Primary wave 4 should last about 8 weeks minimum for it to have reasonable proportion with primary wave 2. It is the proportion between corrective waves which give a wave count the right look. Primary wave 4 may last 13 or even 21 weeks if it is a triangle or combination.
If primary wave 4 reaches down to the lower edge of the Elliott channel, it may end about 2,320. This is very close to the lower range of intermediate wave (4); fourth waves often end within the price territory of the fourth wave of one lesser degree, or very close to it.
If price reaches the target at 2,500 and either the structure is incomplete or price keeps rising, then the next target would be the next Fibonacci ratio in the sequence between cycle waves I and V. At 2,926 cycle wave V would reach 1.618 the length of cycle wave I.
At the end of last week, Lowry’s analysis favours the idea that primary wave 4 has begun.
DAILY CHART
Click chart to enlarge.
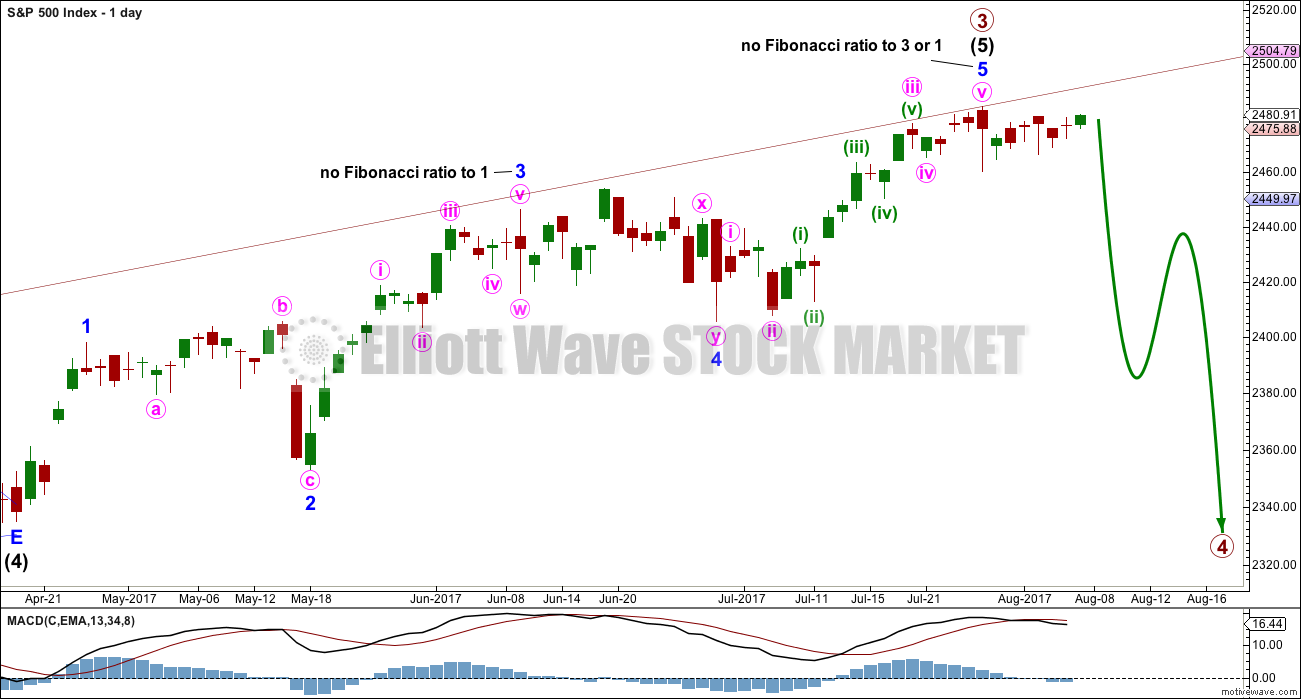
The daily chart shows only the structure of intermediate wave (5); this structure is an impulse.
There is perfect alternation between the deep expanded flat of minor wave 2 and the shallow double zigzag of minor wave 4.
There are no adequate Fibonacci ratios between minor waves 1 and 3. Minor wave 3 exhibits strongest momentum and is the longest actionary wave, so this wave count fits with MACD.
It must be accepted that it is entirely possible that primary wave 3 may not be over and may continue higher while price remains above 2,405.70.
The hourly counts will again be named “first” and “second” after the lack of an upwards breakout. With Lowry’s analysis favouring a larger pullback now underway, the wave count which sees primary wave 4 underway may be slightly favoured.
FIRST HOURLY CHART
Click chart to enlarge.
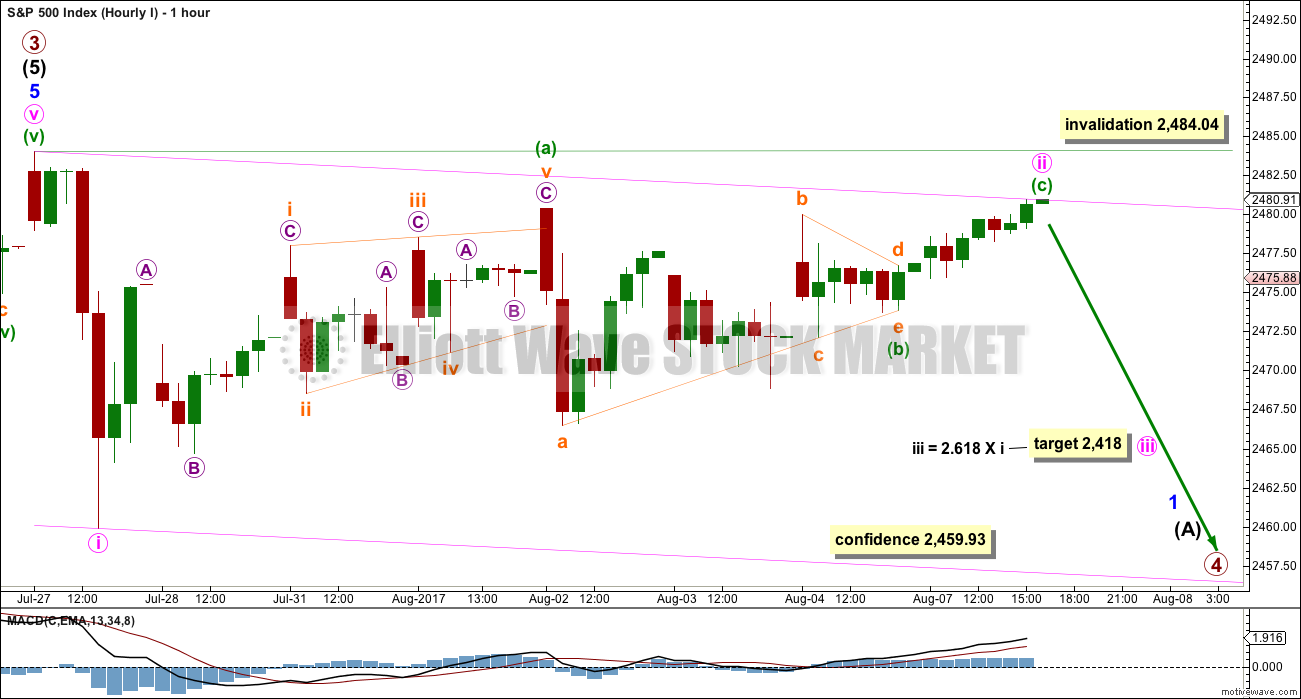
If primary wave 3 is over and primary wave 4 has begun, then minute waves i and now only ii may be complete. The first second wave correction within a new trend is often very deep.
The base channel is redrawn. If minute wave ii moves any higher tomorrow, it may not move beyond the start of minute wave i above 2,484.08. If it does move higher, then redraw the base channel.
Minute wave iii should have the power to break below support at the lower edge of the base channel. Once it has done that, the lower edge may provide resistance.
There is almost no room left for minute wave ii to move into. If this wave count is correct, then the next session should move price strongly lower.
The Fibonacci ratio applied to the target for minute wave iii is chosen because minute wave ii is very deep.
SECOND HOURLY CHART
Click chart to enlarge.
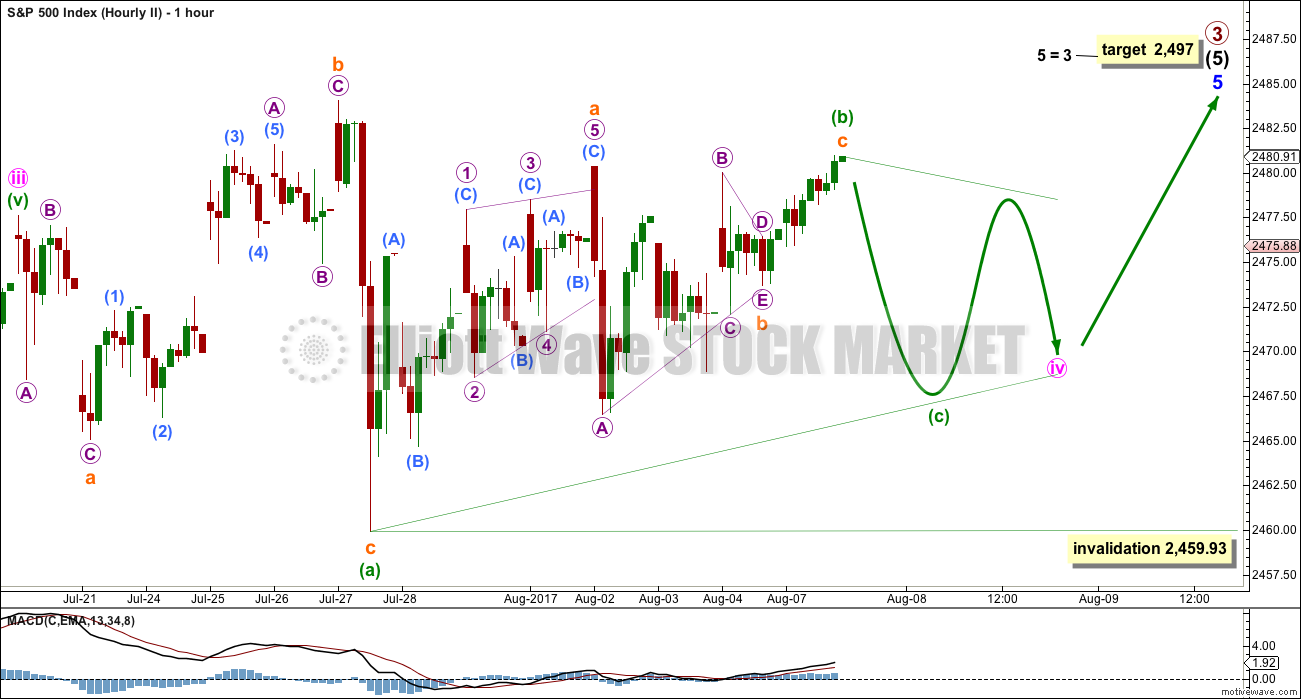
It is still possible that minor wave 5 is incomplete.
The problem of a lack of alternation is resolved if minute wave iv is a triangle.
The triangle would be a regular barrier or contracting triangle.
Four of the five sub-waves of a triangle must be zigzags or multiple zigzags. One sub-wave may be a different A-B-C structure. Here, minuette wave (a) may have been an expanded flat correction.
The triangle sub-waves are relabelled today. The triangle may be continuing even further sideways.
Minuette wave (c) may not move beyond the end of minuette wave (a) below 2,459.93.
TECHNICAL ANALYSIS
WEEKLY CHART
Click chart to enlarge. Chart courtesy of StockCharts.com.
RSI, ADX and the two doji support the idea that primary wave 4 has begun.
DAILY CHART
Click chart to enlarge. Chart courtesy of StockCharts.com.
Monday’s upwards day does not fit a pennant pattern, but it does now fit a possible diamond pattern.
From Kirkpatrick and Dhalquist (pages 321 – 322):
“Bulkowski’s figures show that around 58% of the time, the preceding price action in a diamond top was a steeply rising trend. When this occurs, the odds increase that the breakout from the diamond will be downward and will be equally as sleep, and 82% of the time, it will retrace the entire prior rise. These figures are only valid for a downwards reacts from a top, which occur 67% of the time. Upward breakouts from a diamond top have a very poor performance history and should be avoided. Thus, action should only be taken once the pattern has been identified and the downward breakout has occurred.
… As in most patterns, volume usually declines (67% of the time) during its formation, but declining volume is not necessary. Indeed, rising volume is a pause for performance after the breakout.
…The diamond formation, once properly defined, tends to have a fast-moving price run on the breakout.”
On Balance Volume and MACD suggest the pattern may be complete and a downwards breakout may be imminent.
VOLATILITY – INVERTED VIX CHART
Click chart to enlarge. Chart courtesy of StockCharts.com.
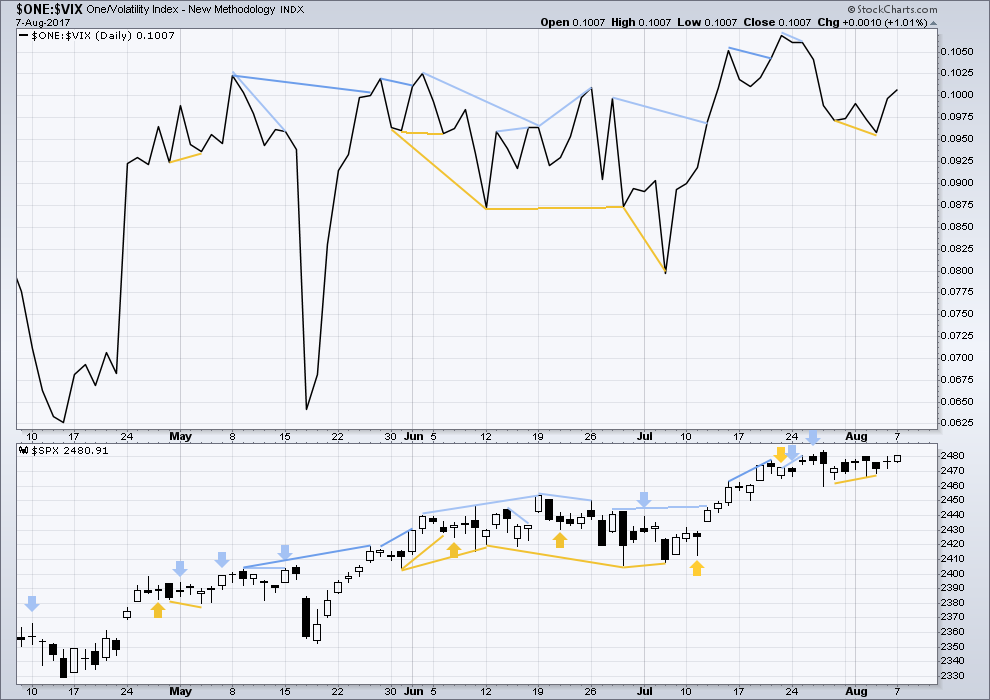
Normally, volatility should decline as price moves higher and increase as price moves lower. This means that normally inverted VIX should move in the same direction as price.
Bullish divergence noted two sessions ago has now been followed by two upwards days, so it may now be considered resolved. There is no new divergence today.
BREADTH – AD LINE
Click chart to enlarge. Chart courtesy of StockCharts.com.
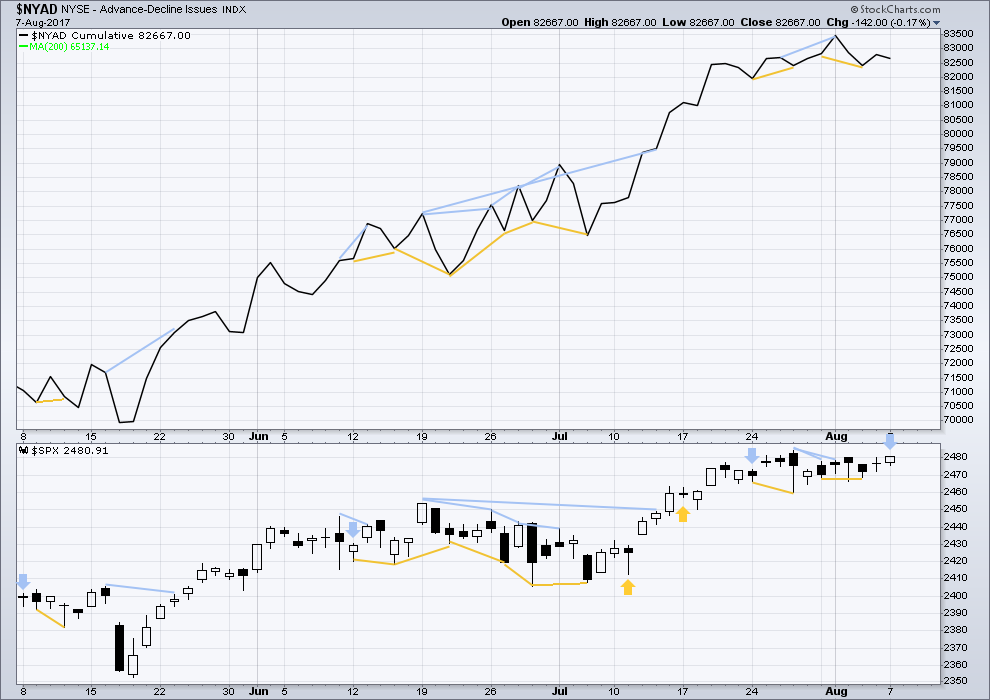
With the last all time high for price, the AD line also made a new all time high. Up to the last high for price there was support from rising market breadth.
There is normally 4-6 months divergence between price and market breadth prior to a full fledged bear market. This has been so for all major bear markets within the last 90 odd years. With no divergence yet at this point, any decline in price should be expected to be a pullback within an ongoing bull market and not necessarily the start of a bear market.
Last bullish divergence noted was followed by an upwards day, so this may now be resolved. Price moved higher today but breadth declined. This is interpreted as bearish; there was weakness today within upwards movement from price.
Lowry’s measures of internal market strength and health continue to show a healthy bull market. While the bull market overall remains healthy, there are signs at the end of this week of some short term weakness which may indicate a pullback to develop here. This supports the labelling of the Elliott wave count at the daily chart level.
DOW THEORY
The S&P500, DJIA, DJT and Nasdaq have all made new all time highs within the last month.
Modified Dow Theory (adding in technology as a barometer of our modern economy) sees all indices confirming the ongoing bull market.
The following lows need to be exceeded for Dow Theory to confirm the end of the bull market and a change to a bear market:
DJIA: 17,883.56.
DJT: 7,029.41.
S&P500: 2,083.79.
Nasdaq: 5,034.41.
Charts showing each prior major swing low used for Dow Theory are here.
Published @ 07:30 p.m. EST.
VIX broke loose from its sub ten cage. It could be a while before it revisits those comfy confines. Have a great evening everyone!
Reverting back to how I last had the triangle labelled.
Today’s candlestick is going to have a very bearish long upper wick. It’s possibly going to be a Gravestone doji… let’s see how it closes.
No, not a doji. The real body is too large. Still a very long upper wick though.
Dearest Lara:
You really are going to have to make an effort to be a little more accurate with your target calls. You were off by a whopping 8.13 SPX points!!! Tsk! Tsk!
🙂 🙂 🙂
Oh dear. Consider myself roundly told off 🙂
Lara,
The triangle structure for minor wave 4 seems to have an expanded flat for wave a, dont all the subdivisions of a triangle have to be zig zags?
Hard to believe but there is STILL very little selling pressure. It would appear the whole world remains convinced that this market has nowhere to go but up!
Are they right??!!! 😀
Well, overall for the next 1-3 years I think they’re right.
But bull markets still have corrections. And P4 is long overdue now.
I may have inadvertently discovered another clue as to what market makers think may be on the horizon.
For no apparent reason I got an early assignment this past weekend of VXX 12.00 strike short puts I was holding that did not expire until this coming week-end. That rarely happens, unless someone has determined to exercise an in the money option they expect to not be in the money in the near future. I will have to make a note to myself…! 🙂
(Not that I minded being assigned the shares mind you)
Today a good example of the facility of spread trades. I am glad I did not get greedy and exited the trade once I had a zero cost basis. At the old saying goes- bulls make money, bears make money, but pigs…well, you know…! 🙂
“Hell and Fury” Trump helping dump the market. haha
It has been quite surprising how little geo-political risk has been priced into the market. The story of NK’s suitcase nukes probably making folk nervous, as well it should. There are myriad other reasons imo…
Look for them to try and drive VIX back below 10.50. It is going to be very bad for some folk if they fail in that endavour….
Acutally, it was “Fire and Fury”.
I guess “Hell” and “Fire” could in some ways be considered synonymous…. 🙂
Well folks, there you have it. Nuff said.
They would have preferred the dump to come overnight and the fact that they could not make that happen is noteworthy. Loading rest of DIA puts.
Next line in the sand is this morning’s low at 2475.18. Move back into gap area bearish….
Below 2480.18 establishes five down three up….
The 247 strike SPY short puts I bought to close this morning should be collapsing in price in the face of the start of an impulsive move higher. Market maker are bidding them higher than what I paid to exit the position. Still not clear to me what comes next. If we make a new high I will sell premium by way of the 248 strike puts….
Again keeping in mind how unreliable so many metrics have become, long upper wicks on the indices are calling into some question the staying power of the ramp higher….let’s see how we close; it could be just a retest…or not…
I am not going to make any assumptions about this market. Usual metrics are not reliable. We have a five down from this morning’s high but lately that has not meant much so far as trend is concerned. Let’s see if we get a three up and a new low….
All I know is SPY has broken out to the upside, after 5-7 days of 4 wave consolidation, confirming that we have a new 5 wave in process, it’s moved up sharply (some kind of “1” or maybe some kind of “3” depending on how you count the consolidation mess), and it’s pulled back sharplyas expected in some kind of 2 or possibly a 4. I’m long. Larger corrections are going to wait, it appears.
I also see that this intraday pullback has a lot of symmetry (same size as) many of the pullbacks over the last week. I find symmetry a very powerful tool for determining likely move termination price ranges.
How this get modelled from an EW perspective will be interesting. I note the similarity of this late July-early August structure to the structure in the June 2-12 timeframe, for what that is worth: earlier, it was the start of a lot of whippy, sideways/down movement (a big 4). And that’s my general best guess of what’s likely here. But EW count wise, I’m pretty much lost in this mess.
There is absolutely no selling pressure so the market is falling by virtue of its own torpidity. Are the bots going to go into over-drive?
Knocking on the door of the top of that gap. It has to hold if we are going higher and we need to see a reversal in very short order….
Cost basis for 225 DIA puts at 4.65 and bid now at 4.70.
A bit conflicted about last 1/4 as not sure we are quite done. Will open buy stop at bid of 5.00 per contract just in case we are….top of gap at 2480.91 should provide support if we are going higher. Either way, upside limited….
On to the future. We’ve launched minute wave v of minor 5 and today’s action was initially minuette wave 1 of that v. And now we appear to be getting perhaps the minuette 2. I’ll be curious how this kickoff of this minute wave v relative to the minute wave iv gets counted (where exactly did it “start”?).
Adding another 1/4 September 15 DIA 25 strike puts for 4.40…
This parody of a market my well continue on to DJI 22,500.00 and SPX 2500.00 prior to a meaningful top and do so on virtually non-existent volume. It is indeed quite a sight to behold as the bots continue to work over-time to fill every little gap down. Based on what I’ve seen so far, I think it is a pretty safe bet to assume we are not going to see an intra-day reversal in this market and that is too bad as I think it is one of the most reliable ways to spot a top is in. I think this thing is going to reverse after hours and it is not going to be pretty. 🙂
Closing short leg of 246/247 bullish put spread expiring Friday. Will hold 246 puts at zero cost basis.
Looks like we are breaking from consolidation in the final move up. Looking for reversal to load remainder of short position via DIA 225 strike puts with lower cost basis…
Let’s face it, there is no “final move up”. This bull market is unstoppable. P3 is never going to end.
Sure feels like it doesn’t it?
My guess is you were not around the last two times this happened!
Nothing new under the Sun. 🙂
No sooner do I post this than SPX does a reversal and ends in the negative. Still not a ton of selling pressure as you mention. Extremely long upper wicks on all the indexes though–SPX and NDX were significantly lighter in volume than DJI and RUT. You are right, I wasn’t trading during the last two crashes 🙂 I do remember tracking the Dow a bit back in 2008 though. The repeated -5% down days were something to behold. I do also remember the August 2015 flash crash. The volume that morning was incredible, as was the following reversal throughout the rest of the day.
So close to just ripping this through ATH
SPY ATH, oddly enough SPX still 2 points away.
andddd there is ATH SPX.
Buying to open, September 15 DIA 225 strike puts at 4.90. One half full position…
Broken rising wedges everywhere. Manic moves back up, presumably to test underside…
So much for the end of primary wave 3. The bulls are not giving up easily.
What??? First again? This late?
and i published it so early too…