
A small doji at the weekly chart level now puts the trend from up to neutral, at least for the short term.
Summary: Assume the trend remains up while price remains above 2,459.93. The Elliott wave target is now at 2,497, and a classic technical analysis target is at 2,554.
A new low now below 2,459.93 would add some confidence to the view that primary wave 4 has finally arrived. Full confidence may be had if price makes a new low below 2,405.70. The target would be about 2,320. Lowry’s analysis favours the alternate hourly wave count which sees primary wave 4 begun at this time.
New updates to this analysis are in bold.
Last monthly and weekly charts are here. Last historic analysis video is here.
MAIN ELLIOTT WAVE COUNT
WEEKLY CHART
Click chart to enlarge.
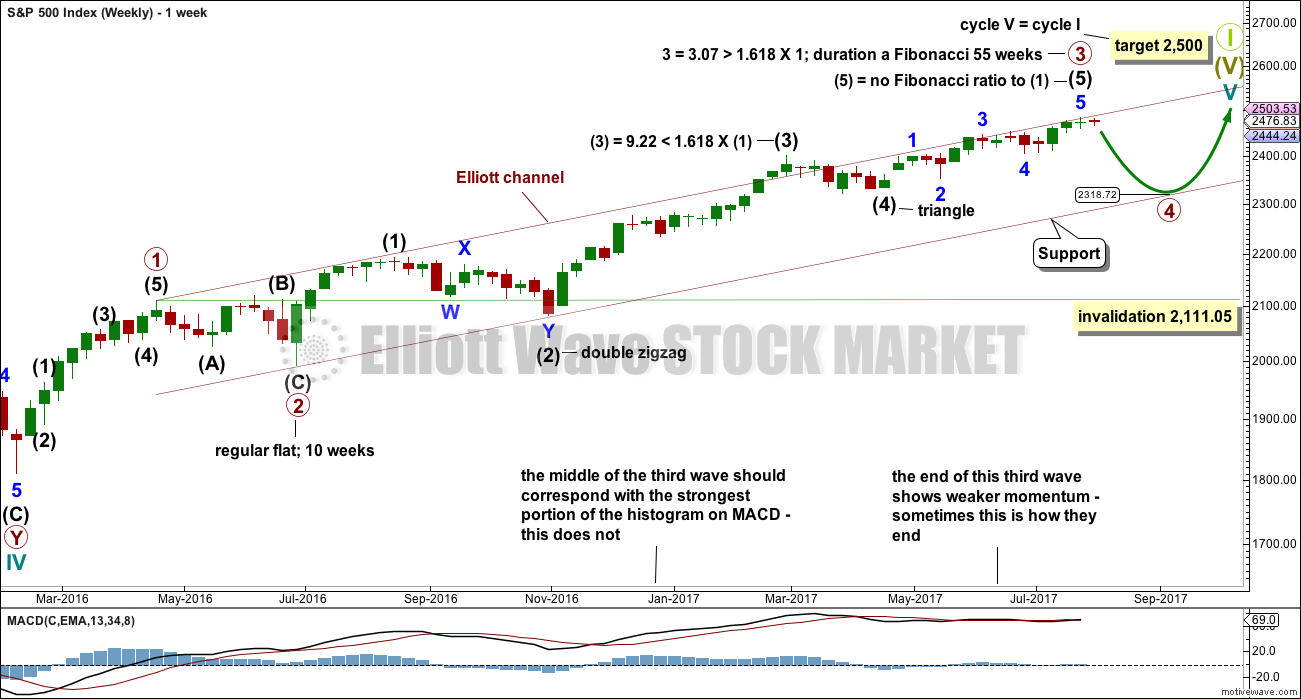
It is possible that primary wave 3 is complete. However, some confidence may be had in this view only with a new low below 2,459.93 now. Further and substantial confidence may be had if price makes a new low below 2,405.70. Fibonacci ratios are calculated at primary and intermediate degree. If primary wave 3 is complete, then it exhibits the most common Fibonacci ratio to primary wave 1. It also perfectly exhibits a Fibonacci 55 weeks duration.
Primary wave 4 may not move into primary wave 1 price territory below 2,111.05.
Primary wave 4 should last about 8 weeks minimum for it to have reasonable proportion with primary wave 2. It is the proportion between corrective waves which give a wave count the right look. Primary wave 4 may last 13 or even 21 weeks if it is a triangle or combination.
If primary wave 4 reaches down to the lower edge of the Elliott channel, it may end about 2,320. This is very close to the lower range of intermediate wave (4); fourth waves often end within the price territory of the fourth wave of one lesser degree, or very close to it.
If price reaches the target at 2,500 and either the structure is incomplete or price keeps rising, then the next target would be the next Fibonacci ratio in the sequence between cycle waves I and V. At 2,926 cycle wave V would reach 1.618 the length of cycle wave I.
At the end of this week, Lowry’s analysis favours the idea that primary wave 4 has begun.
DAILY CHART
Click chart to enlarge.
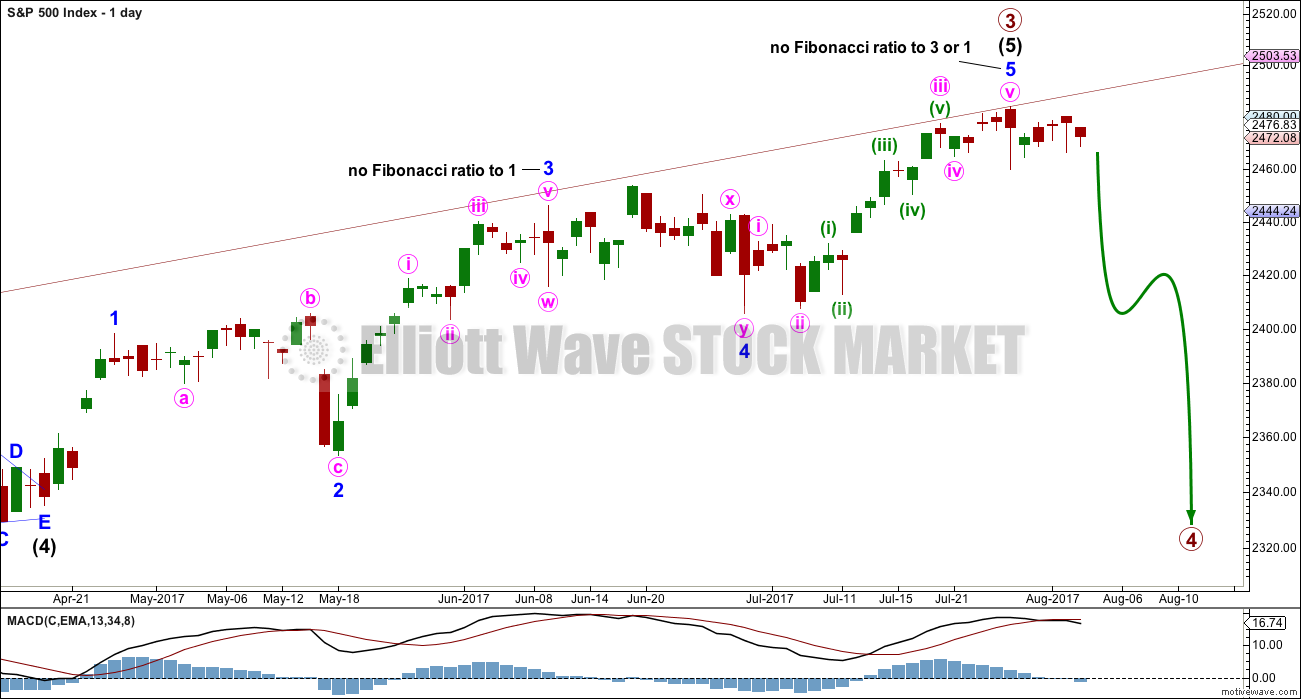
The daily chart shows only the structure of intermediate wave (5); this structure is an impulse.
There is perfect alternation between the deep expanded flat of minor wave 2 and the shallow double zigzag of minor wave 4.
There are no adequate Fibonacci ratios between minor waves 1 and 3. Minor wave 3 exhibits strongest momentum and is the longest actionary wave, so this wave count fits with MACD.
It must be accepted that it is entirely possible that primary wave 3 may not be over and may continue higher while price remains above 2,405.70.
The hourly counts will again be named “first” and “second” after the lack of an upwards breakout on Friday. With Lowry’s analysis favouring a larger pullback now underway, the wave count which sees primary wave 4 underway may be slightly favoured.
FIRST HOURLY CHART
Click chart to enlarge.
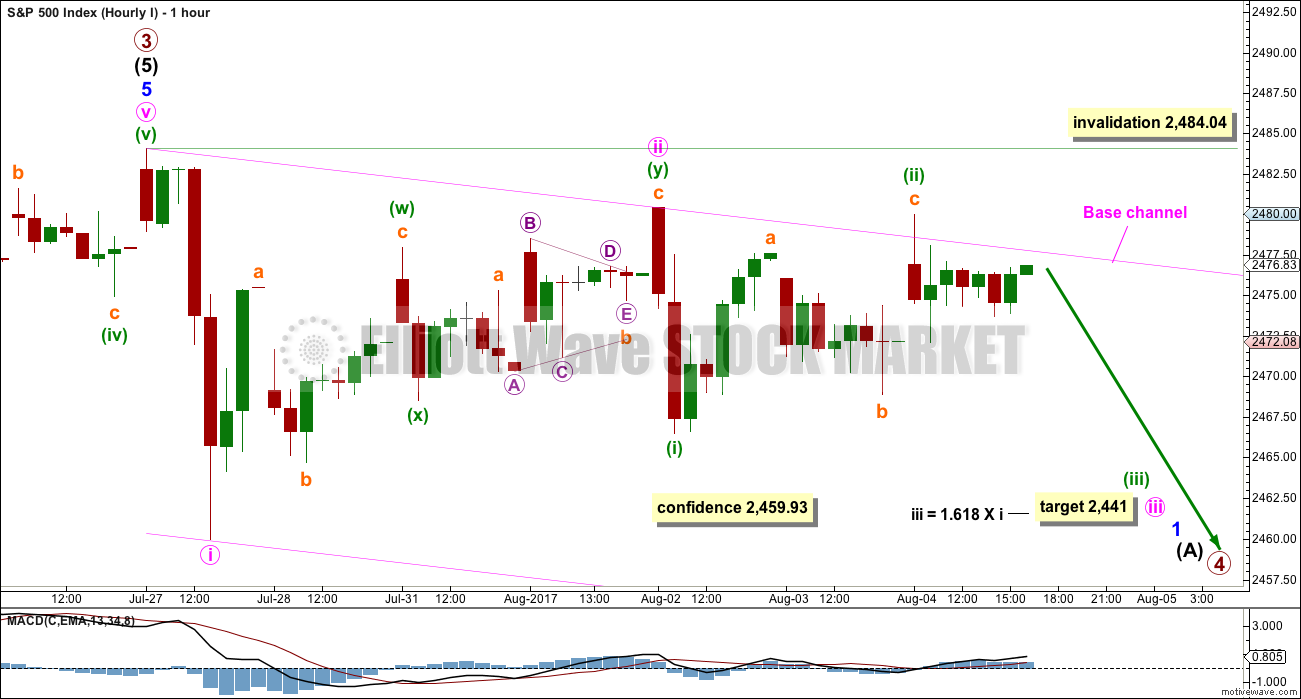
Minor wave 5 may now be a complete five wave impulse.
A base channel is added about minute waves i and ii. Lower degree second wave corrections should find resistance at the upper edge of this base channel. Small overshoots are acceptable. Breaches are not. The small overshoot during Friday’s session is acceptable.
There may now be three overlapping first and second wave corrections to begin primary wave 4 down. When third waves extend, this is sometimes how they begin. But we have been here before many times and the third wave has not eventuated. This wave count requires a new low below 2,459.93 for any confidence.
If it continues further, then minute wave ii may not move beyond the start of minute wave i above 2,484.04.
A target is now provided for minute wave iii to reach a common Fibonacci ratio to minute wave i.
SECOND HOURLY CHART
Click chart to enlarge.
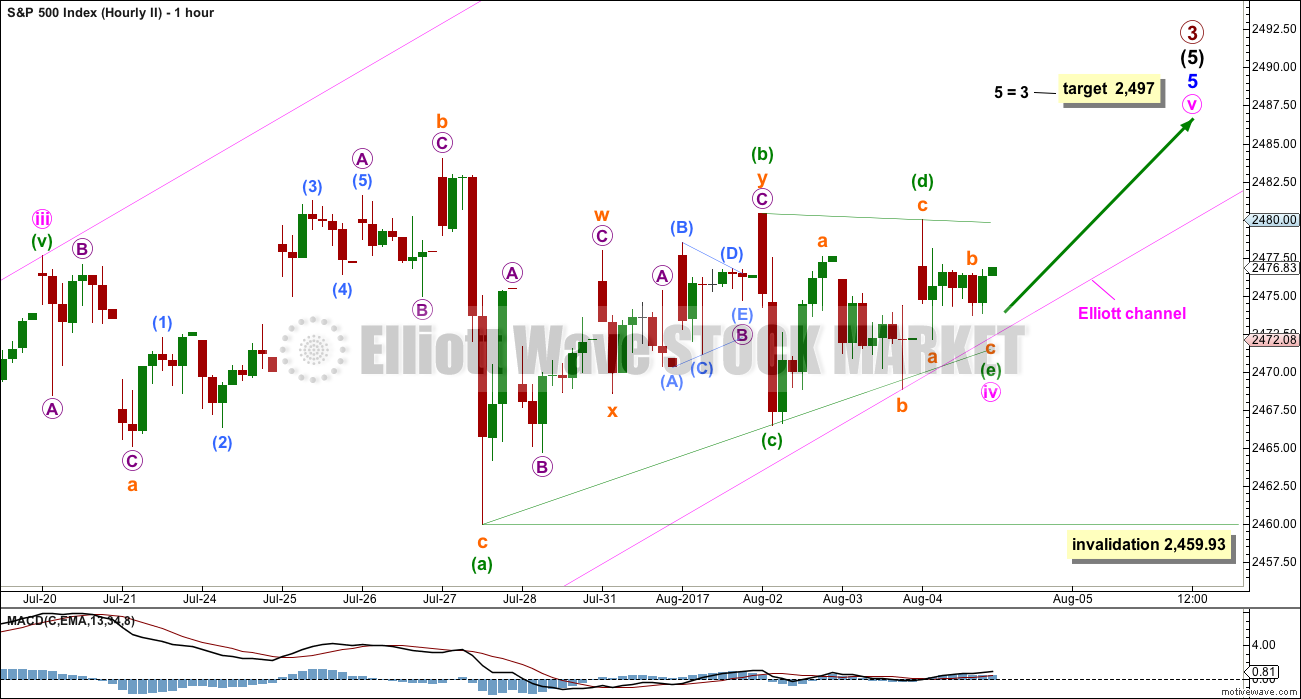
It is still possible that minor wave 5 is incomplete.
The problem of a lack of alternation is resolved if minute wave iv is a triangle.
The triangle would be a regular barrier triangle.
Four of the five sub-waves of a triangle must be zigzags or multiple zigzags. One sub-wave may be a different A-B-C structure. Here, minuette wave (a) may have been an expanded flat correction.
One triangle sub-wave may be a more complicated multiple. This may be minuette wave (b).
All remaining sub-waves must be single zigzags, as these are.
Minuette wave (e) may be incomplete and would most likely end short of the (a)-(c) trend line.
This Elliott wave triangle is analogous to the small pennant pattern noted today on the classic technical analysis chart. For both the breakout would be expected to be upwards.
The target is recalculated using the most common Fibonacci ratio for minute wave v.
Within the triangle, if minuette wave (c) continues further, then it may not move beyond the end of minuette wave (a) below 2,459.93.
TECHNICAL ANALYSIS
WEEKLY CHART
Click chart to enlarge. Chart courtesy of StockCharts.com.
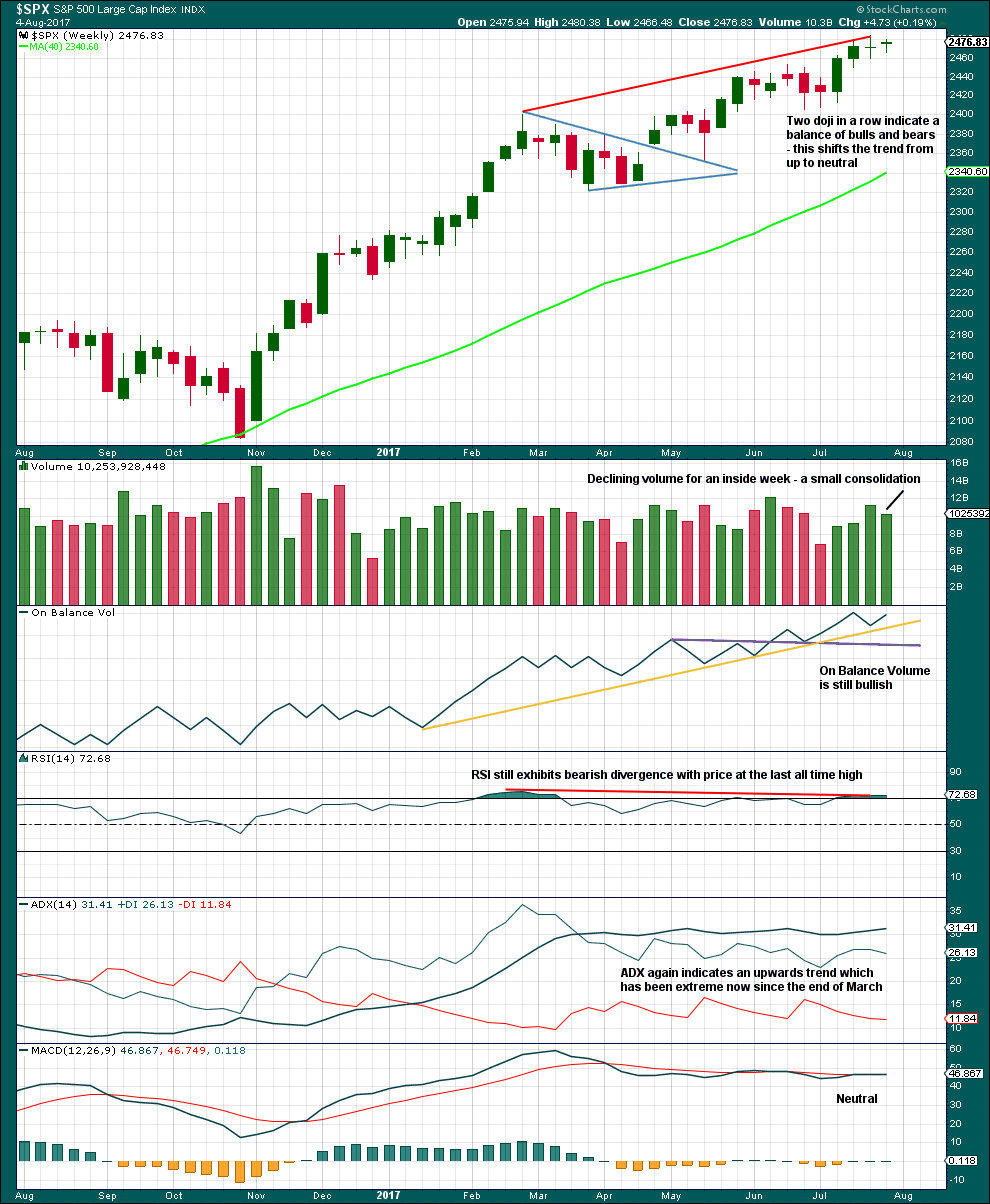
RSI, ADX and the two doji support the idea that primary wave 4 has begun.
DAILY CHART
Click chart to enlarge. Chart courtesy of StockCharts.com.
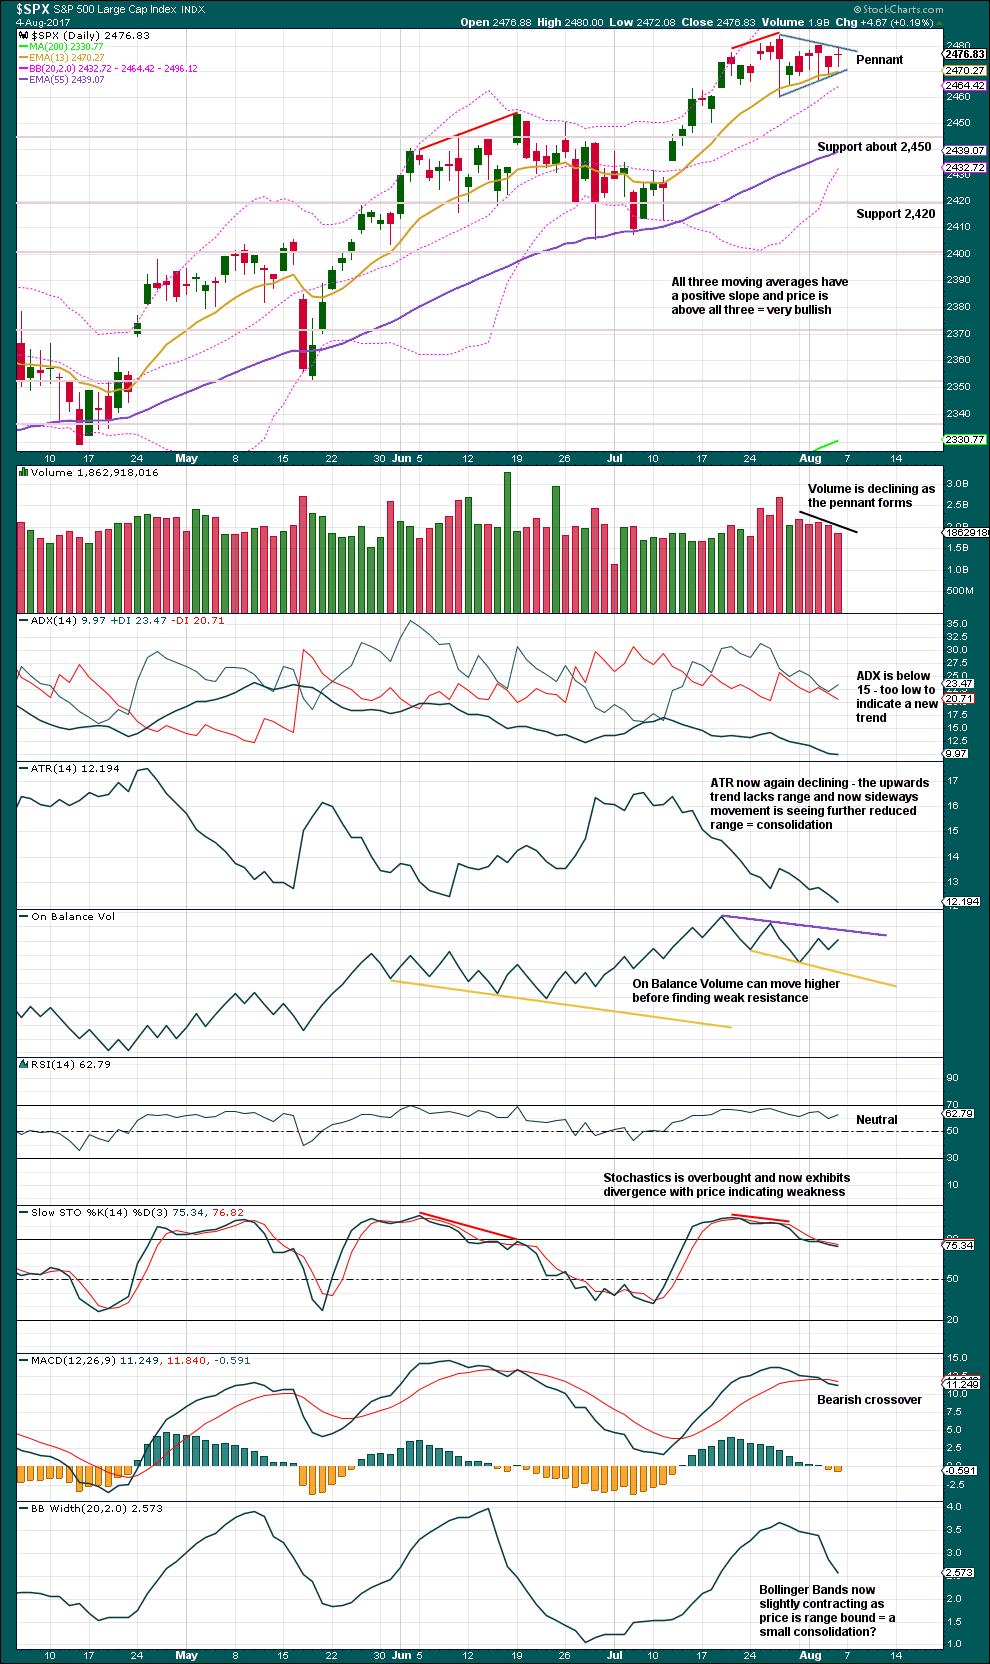
A small pennant may be forming. Using the measured rule a target of 2,554 would be calculated; the breakout would be expected to be upwards. Pennants are reliable continuation patterns. This one is supported by light volume as it nears its end. However, within recent days, it is a downwards day which has strongest volume suggesting a downwards breakout.
The doji for Friday puts the trend into neutral. This slightly detracts from the bullishness of the prior long lower wicks.
ADX, ATR and Bollinger Bands all agree that price is likely consolidating.
MACD is now bearish.
VOLATILITY – INVERTED VIX CHART
Click chart to enlarge. Chart courtesy of StockCharts.com.
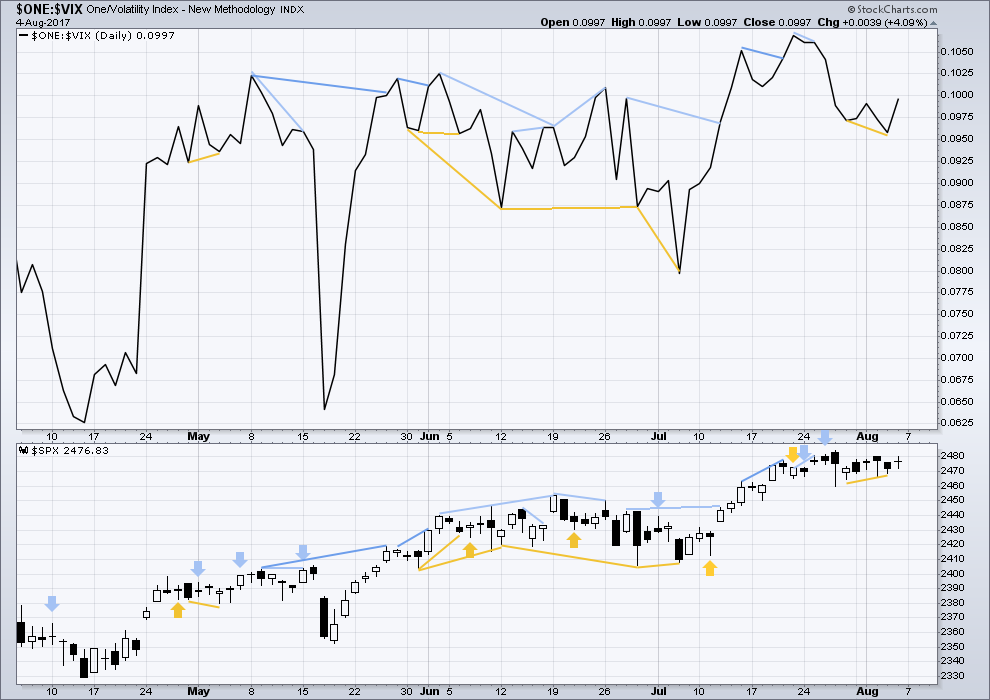
Normally, volatility should decline as price moves higher and increase as price moves lower. This means that normally inverted VIX should move in the same direction as price.
Bullish divergence noted in last analysis has been followed by an upwards day. This divergence may now be resolved, or it may need one more day to resolve it. There is no new divergence.
BREADTH – AD LINE
Click chart to enlarge. Chart courtesy of StockCharts.com.
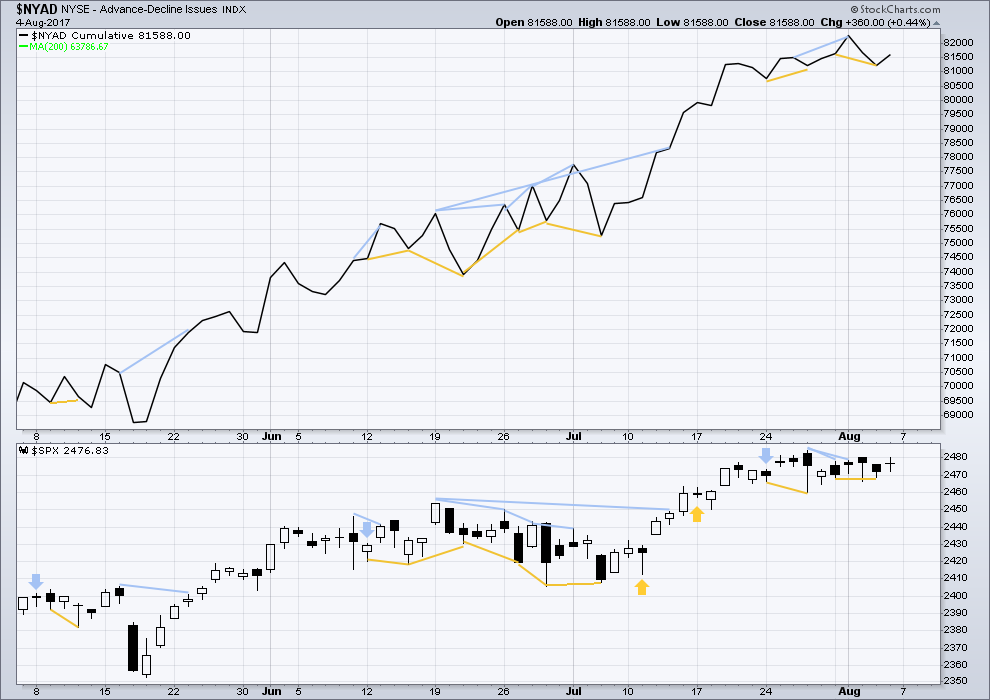
With the last all time high for price, the AD line also made a new all time high. Up to the last high for price there was support from rising market breadth.
There is normally 4-6 months divergence between price and market breadth prior to a full fledged bear market. This has been so for all major bear markets within the last 90 odd years. With no divergence yet at this point, any decline in price should be expected to be a pullback within an ongoing bull market and not necessarily the start of a bear market.
Bullish divergence noted in last analysis has been followed by an upwards day. This divergence may now be resolved, or it may need one more day to resolve it. There is no new divergence.
Lowry’s measures of internal market strength and health continue to show a healthy bull market. While the bull market overall remains healthy, there are signs at the end of this week of some short term weakness which may indicate a pullback to develop here. This supports the labelling of the Elliott wave count at the daily chart level.
DOW THEORY
The S&P500, DJIA, DJT and Nasdaq have all made new all time highs within the last month.
Modified Dow Theory (adding in technology as a barometer of our modern economy) sees all indices confirming the ongoing bull market.
The following lows need to be exceeded for Dow Theory to confirm the end of the bull market and a change to a bear market:
DJIA: 17,883.56.
DJT: 7,029.41.
S&P500: 2,083.79.
Nasdaq: 5,034.41.
Charts showing each prior major swing low used for Dow Theory are here.
Published @ 10:38 p.m. EST on 5th August, 2017.
First hourly chart updated:
Upwards movement breached how I had the base channel drawn, so this is probably a continuation of minute ii as a deep and time consuming zigzag.
The base channel needs to be redrawn.
Are we at full breach on the first hourly chart yet?
We are, and so I’m relabelling it. Looks like minute ii wasn’t done.
Given the total lack of any upside push, I’ve adopted the wave 3 complete count as my guide and am building a short position (cautiously). I sure would like to see some downwards movement (start of minute wave 3 down) to give some initial confirmation of the count!! This slow rollover of SPY is like watching paint dry and gives me too much time to worry that it’s going take off like a rocket. Fortunately the stop levels are pretty close, while there’s lots and lots of room to tumble. I like the bet. I hope I like it by Friday, too.
That sounds like a good plan Kevin.
I agree, the stop loss can be close so the risk can be lowered. There’s always risk, and I could be wrong (so could Lowry’s) so happy to hear you’re using stops!
I too think I will take this opportunity today to open a small short position. Maybe to risk only 1-2% of equity here.
Wow. This is one of those days that I just decide to not watch the market.
An alternate view of the daily chart pattern discussed in the video (pennant formation) is that of a diamond pattern, which is a topping pattern. If it does break to the downside, the diamond pattern would be a good fit.
Yes indeed, it does look like a possible fit.
The second half of the pattern, a triangle, would now be an ascending triangle due to the upwards movement of todays session.
Je Suis La! Elmer…