
Sideways movement completes an outside day and fits both Elliott wave counts. This market is again range bound.
Summary: Assume the trend remains up while price remains above 2,459.93. The target is at 2,500 now.
A new low now below 2,459.93 would add some confidence to the view that primary wave 4 has finally arrived. Full confidence may be had if price makes a new low below 2,405.70. The target would be about 2,320.
New updates to this analysis are in bold.
Last monthly and weekly charts are here. Last historic analysis video is here.
MAIN ELLIOTT WAVE COUNT
WEEKLY CHART
Click chart to enlarge.
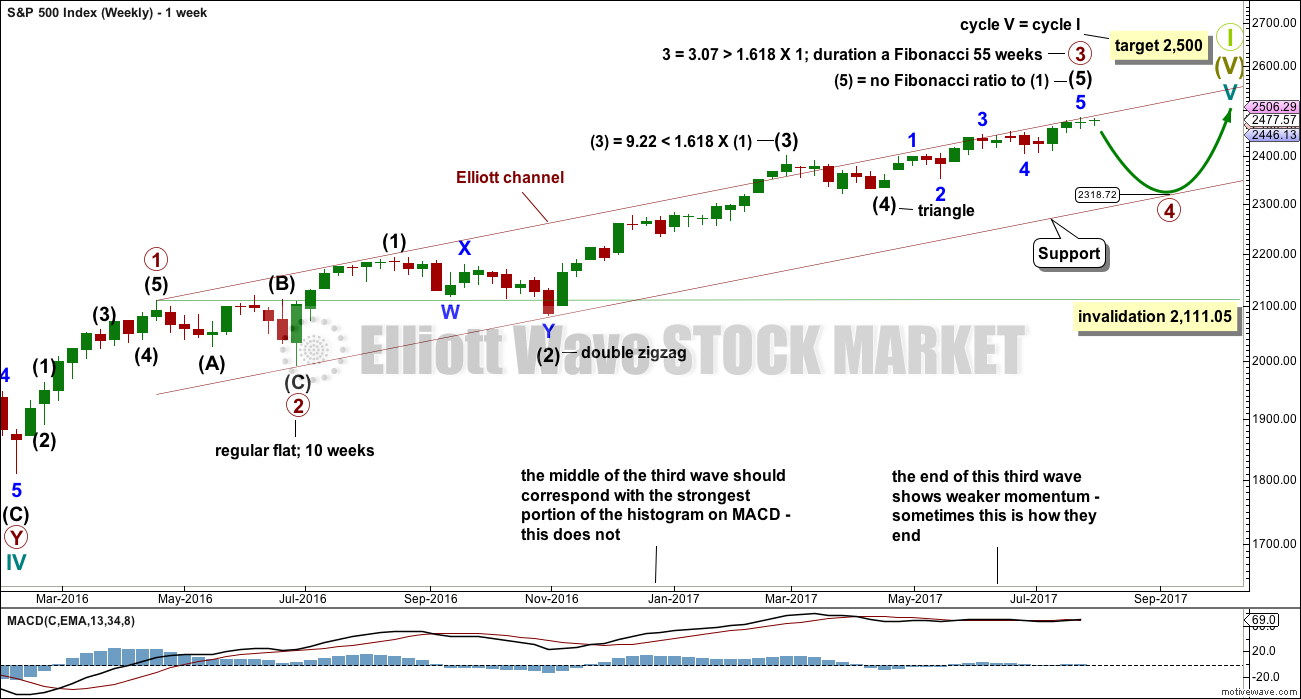
It is possible that primary wave 3 is complete. However, some confidence may be had in this view only with a new low below 2,459.93 now. Further and substantial confidence may be had if price makes a new low below 2,405.70. Fibonacci ratios are calculated at primary and intermediate degree. If primary wave 3 is complete, then it exhibits the most common Fibonacci ratio to primary wave 1. It also perfectly exhibits a Fibonacci 55 weeks duration.
Primary wave 4 may not move into primary wave 1 price territory below 2,111.05.
Primary wave 4 should last about 8 weeks minimum for it to have reasonable proportion with primary wave 2. It is the proportion between corrective waves which give a wave count the right look. Primary wave 4 may last 13 or even 21 weeks if it is a triangle or combination.
If primary wave 4 reaches down to the lower edge of the Elliott channel, it may end about 2,320. This is very close to the lower range of intermediate wave (4); fourth waves often end within the price territory of the fourth wave of one lesser degree, or very close to it.
If price reaches the target at 2,500 and either the structure is incomplete or price keeps rising, then the next target would be the next Fibonacci ratio in the sequence between cycle waves I and V. At 2,926 cycle wave V would reach 1.618 the length of cycle wave I.
DAILY CHART
Click chart to enlarge.
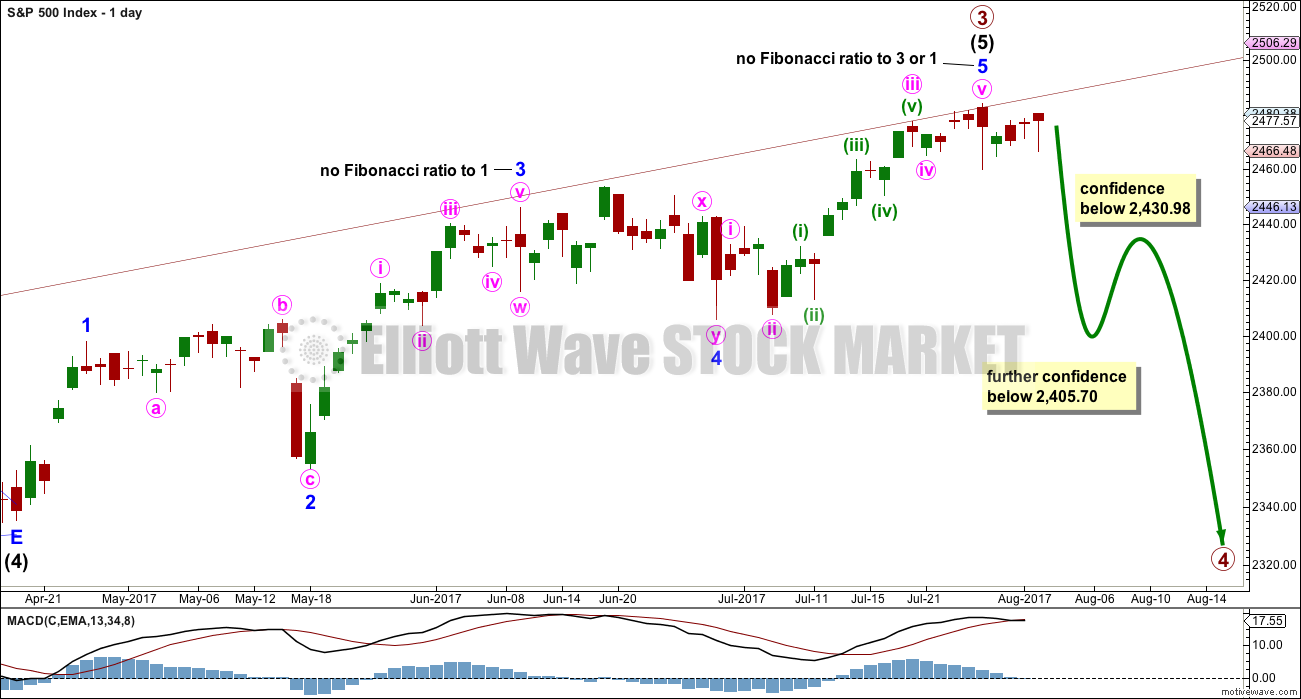
The daily chart shows only the structure of intermediate wave (5); this structure is an impulse.
There is perfect alternation between the deep expanded flat of minor wave 2 and the shallow double zigzag of minor wave 4.
There are no adequate Fibonacci ratios between minor waves 1, 3 and 5. This is not uncommon for the S&P500. Minor wave 3 exhibits strongest momentum and is the longest actionary wave, so this wave count fits with MACD.
It must be accepted that it is entirely possible that primary wave 3 may not be over and may continue higher while price remains above 2,405.70.
FIRST HOURLY CHART
Click chart to enlarge.
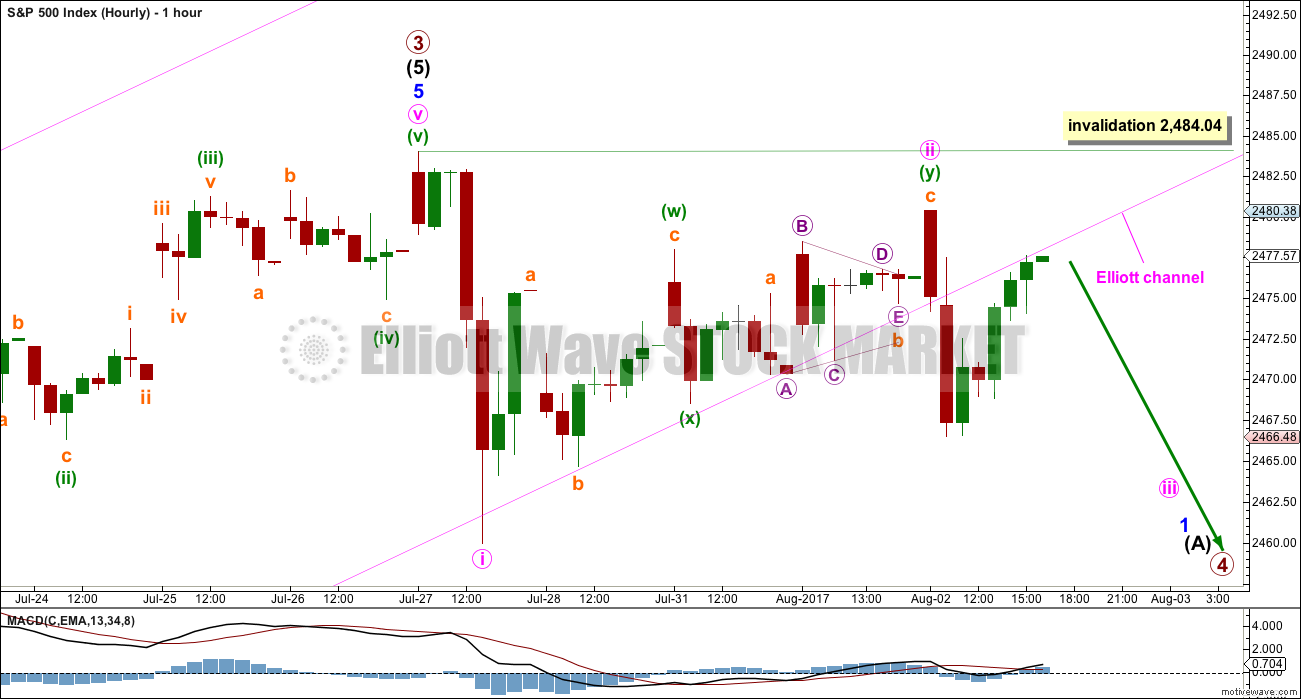
Minor wave 5 may now be a complete five wave impulse.
A strong breach of that channel has indicated a possible trend change, but it may not necessarily be a trend change at primary degree.
Upwards movement at the end of Wednesday’s session looks so far like a typical back test to resistance at the lower edge of the channel. However, the S&P does have a tendency to breach upwards channels and then turn and continue higher as it forms slow rounded tops. The channel breach increases the probability of this wave count, but it is not a certainty.
If it continues further, then minute wave ii may not move beyond the start of minute wave i above 2,484.04.
SECOND HOURLY CHART
Click chart to enlarge.
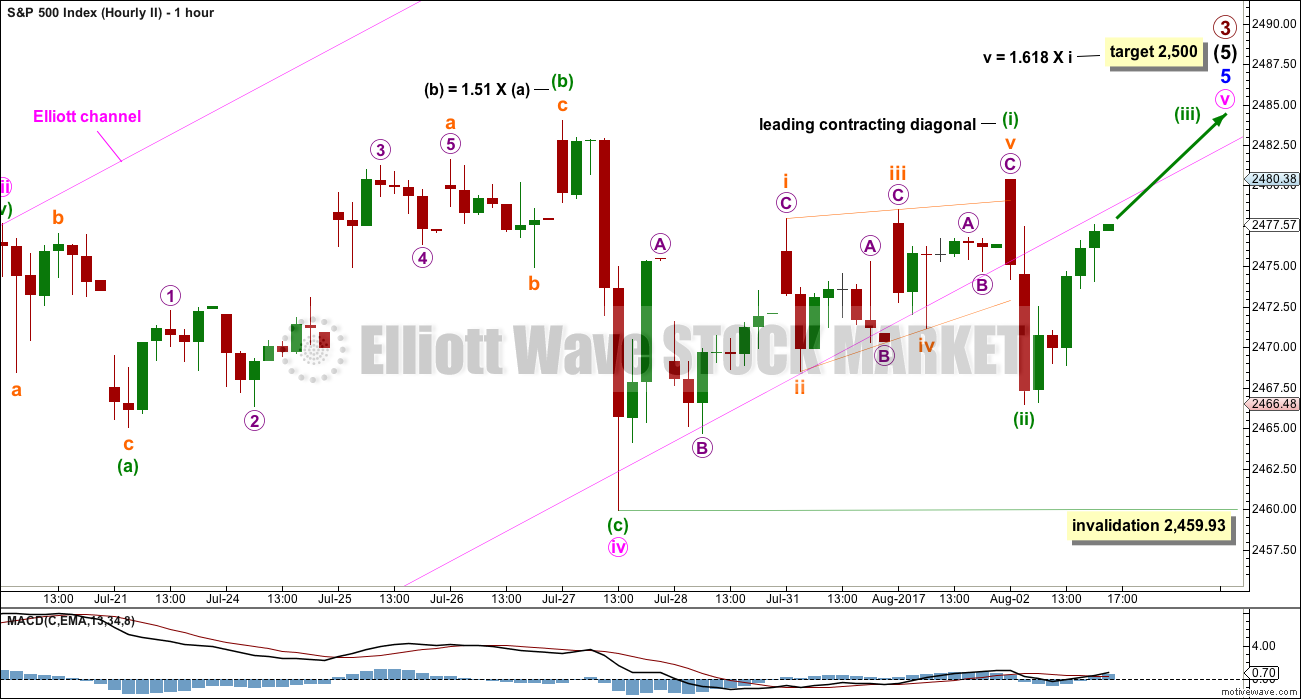
It is still possible that minor wave 5 is incomplete.
This wave count must be an alternate because there is inadequate alternation between minute waves ii and iv: both are expanded flats. There may still be good alternation in depth, but alternation is a guideline and not a rule and the S&P500 does not always exhibit perfect alternation.
Labelling of the diagonal is moved down one degree. This may only be minuette wave (i) of minute wave v. Minuette wave (ii) may not move beyond the start of minuette wave (i) below 2,459.93.
TECHNICAL ANALYSIS
WEEKLY CHART
Click chart to enlarge. Chart courtesy of StockCharts.com.
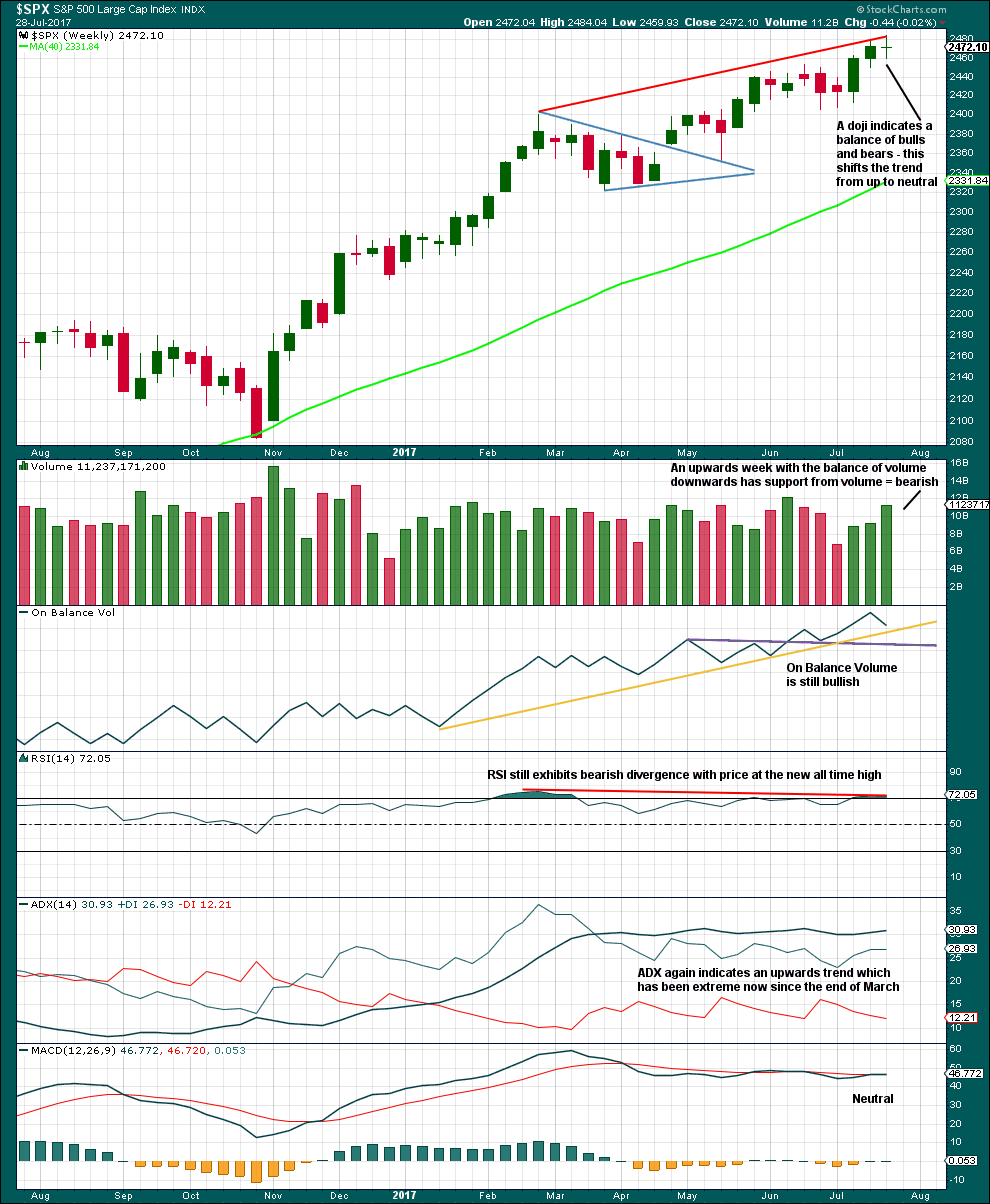
There is a little short term bearishness last week to support the labelling of the daily Elliott wave count: some support from volume for downwards movement, divergence still between price and RSI, and a doji candlestick.
With still extreme ADX, the conditions look right now for a primary degree correction here.
DAILY CHART
Click chart to enlarge. Chart courtesy of StockCharts.com.
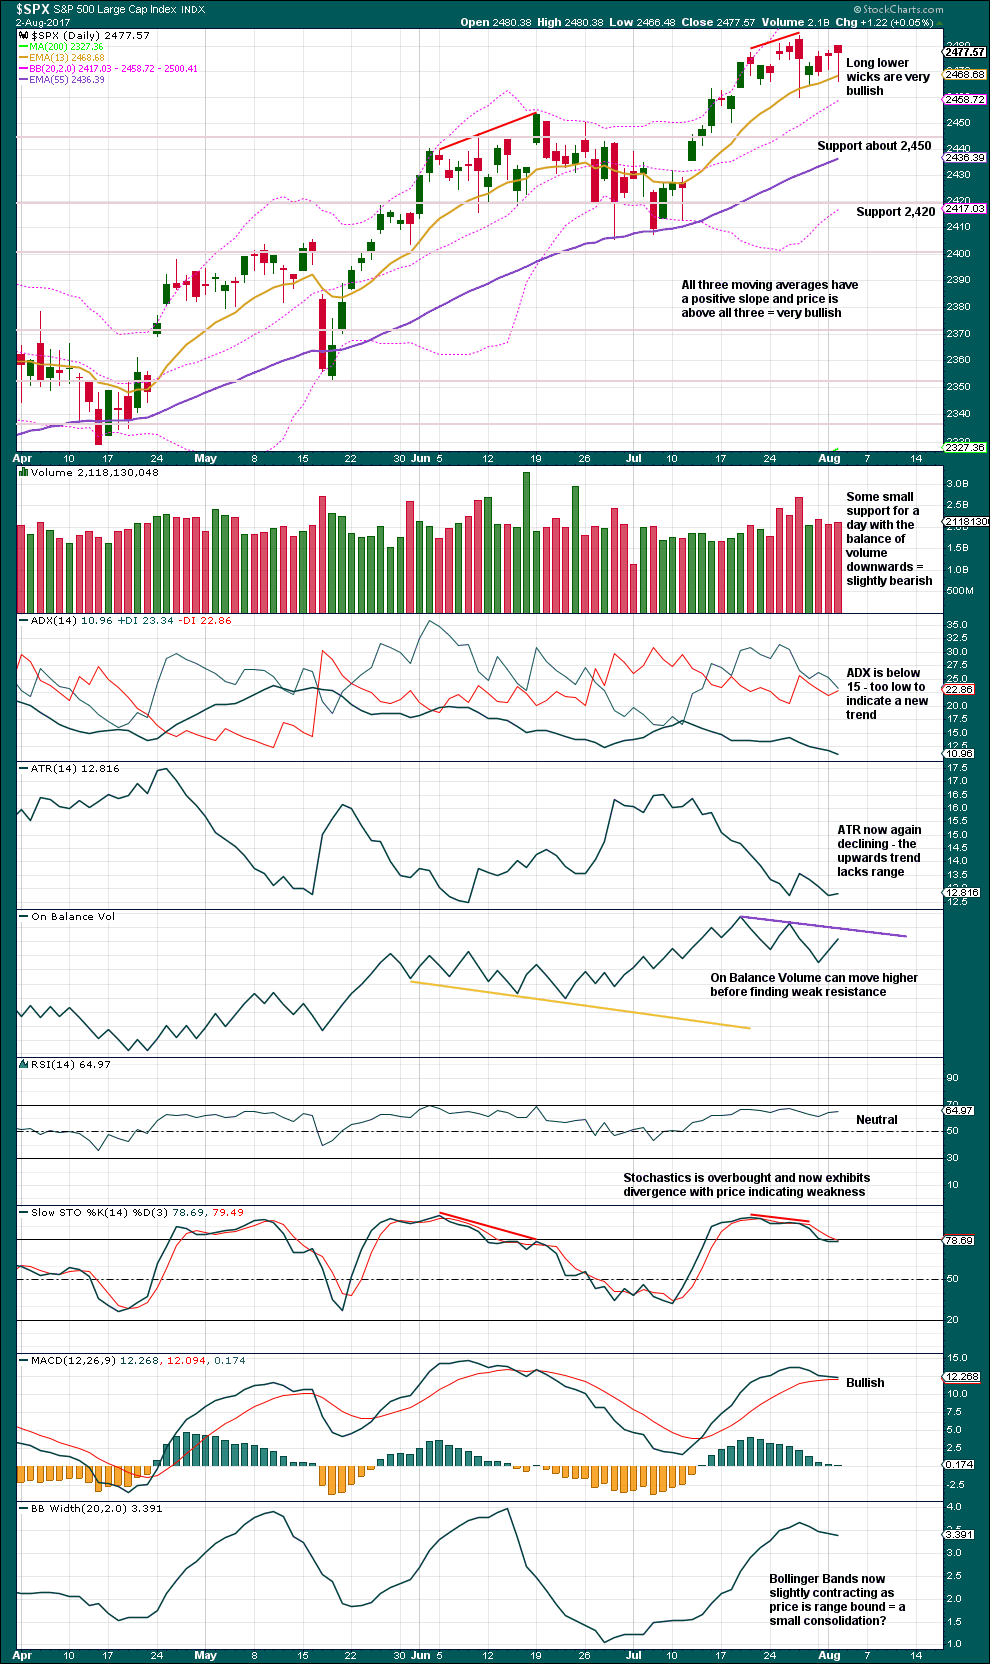
The last yellow line for On Balance Volume was breached again. With four breaches that line is no longer working, so it is removed. A new resistance line is added, but with only two tests it has only very weak technical significance.
Bollinger Bands, ATR and ADX now all agree that sideways movement for the last 10 sessions looks like a small consolidation. If the consolidation is taken as beginning on the 19th of July, then within it the strongest volume is on the downwards day of the 27th of July. This suggests a downwards breakout may be more likely than upwards.
The long lower wicks now of three of the last daily candlesticks are bullish, so this puts reasonable doubt on the main hourly wave count.
The picture today is less bearish than yesterday.
VOLATILITY – INVERTED VIX CHART
Click chart to enlarge. Chart courtesy of StockCharts.com.
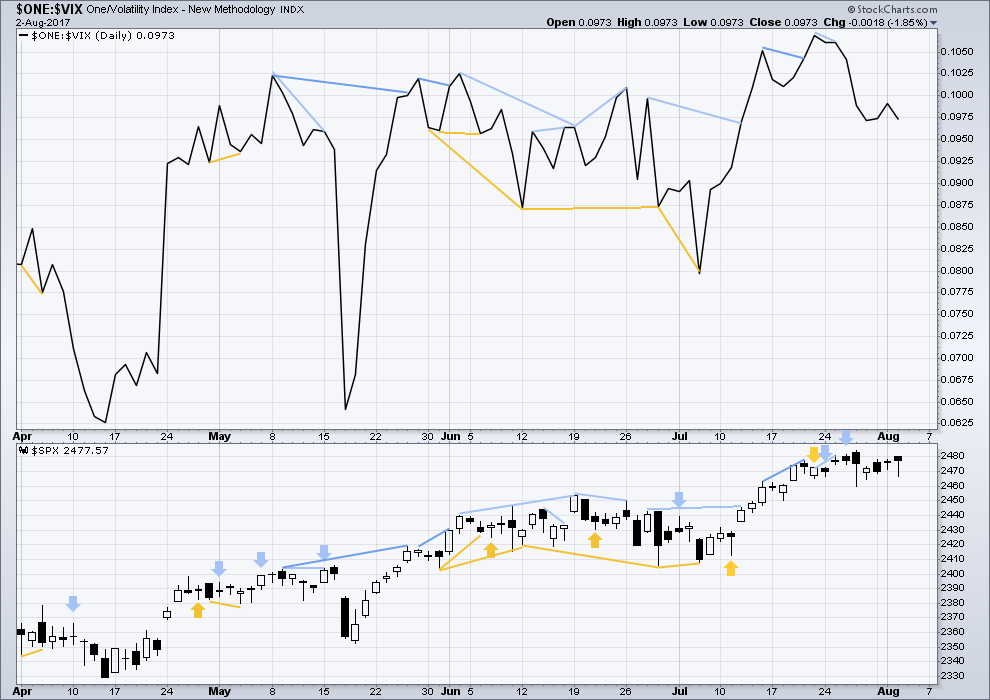
Normally, volatility should decline as price moves higher and increase as price moves lower. This means that normally inverted VIX should move in the same direction as price.
There is no new divergence.
BREADTH – AD LINE
Click chart to enlarge. Chart courtesy of StockCharts.com.
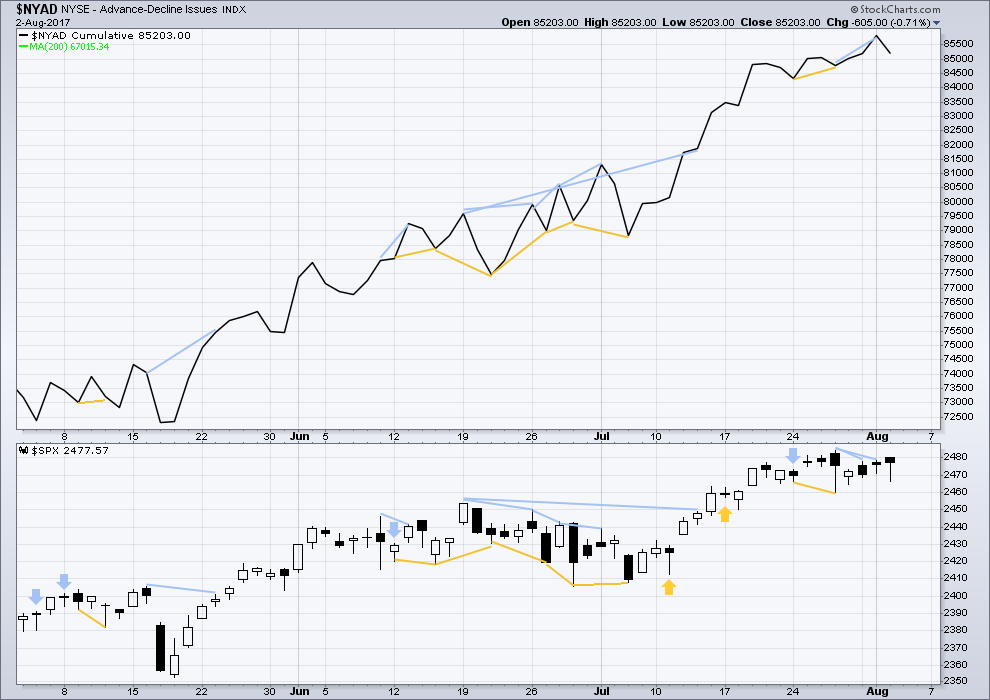
With the last all time high for price, the AD line also made a new all time high. Up to the last high for price there was support from rising market breadth.
There is normally 4-6 months divergence between price and market breadth prior to a full fledged bear market. This has been so for all major bear markets within the last 90 odd years. With no divergence yet at this point, any decline in price should be expected to be a pullback within an ongoing bull market and not necessarily the start of a bear market.
Last noted bearish divergence has been followed by an outside day with the balance of volume downwards. It may be followed by more downwards movement before it is resolved, or it may be resolved here.
There is no new divergence today between price movement and market breadth.
Lowry’s measures of internal market strength and health continue to show a healthy bull market. While the bull market overall remains healthy, there are signs at the end of this week of some short term weakness which may indicate a pullback to develop here. This supports the labelling of the Elliott wave count at the daily chart level.
DOW THEORY
The S&P500, DJIA, DJT and Nasdaq have all made new all time highs.
Modified Dow Theory (adding in technology as a barometer of our modern economy) sees all indices confirming the ongoing bull market.
The following lows need to be exceeded for Dow Theory to confirm the end of the bull market and a change to a bear market:
DJIA: 17,883.56.
DJT: 7,029.41.
S&P500: 2,083.79.
Nasdaq: 5,034.41.
Charts showing each prior major swing low used for Dow Theory are here.
Published @ 09:36 p.m. EST.
Another yawn inducing sideways day. After the channel breach, if this wave count is right, the backtest should be an entry opportunity to go short.
Stops always please, because I could be wrong. At least just above minute ii at 2,480.38.
no one here?
HELLO hellooo hellooooo heeelllloooooooooo (my echo)
Verne’s having a day off?
NO,,,, I finally got dat wabbit.. signed, Elmer Fudd…. should I let him go?
so it’s you Doc!
yes please, let that wabbit go so we can have some more fun with him 🙂
I’ve got a symmetrical triangle drawn over/under the action from july 27 onward, with an A, B, C, and D wave touch in place. No E touch on the bottom line yet. Usually a triangle is a 4, and a continuation pattern. I’m growing less bearish. Am I seeing this right?
And a perfect hit for the minuette level E wave on the bottom of the triangle. Is that, for some reason, not a symmetric triangle and a four wave?
Nicely spotted. It works. It meets all EW rules.
I’m changing the alternate wave count to your triangle idea, thanks Kevin.
My one concern is that E waves normally fall short of the A-C trend line, rarely end at the line. But that’s only a small concern.
ok, whats that? about 3 in a row?