
A little upwards movement was expected for Monday. Price fell 2.04 points short of the target on the main hourly Elliott wave chart before turning lower to print a red daily candlestick.
Summary: We should always assume the trend remains the same until proven otherwise. While it is possible today that primary wave 3 may be over, assume that it may continue higher while price remains above 2,430.98. The target for it to end is now at 2,497.
If price moves strongly lower this week, then the probability that primary wave 4 has arrived will increase. Confidence may be had if price makes a new low below 2,430.98. If that happens, then expect a multi week to multi month pullback to end about 2,320.
Classic technical analysis today offers reasonable support to the main Elliott wave count, which sees a high now in place for primary wave 3 and the start now of primary wave 4.
New updates to this analysis are in bold.
Last monthly and weekly charts are here. Last historic analysis video is here.
MAIN ELLIOTT WAVE COUNT
WEEKLY CHART
Click chart to enlarge.
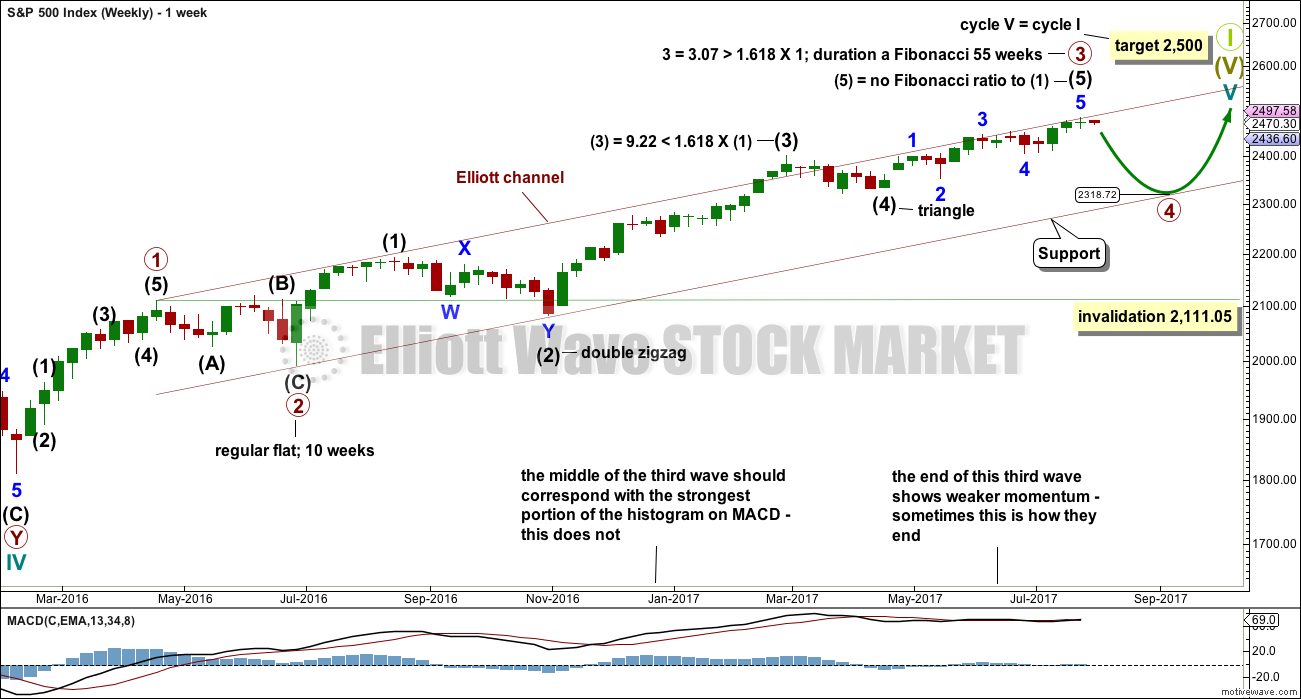
It is possible that primary wave 3 is complete. However, some confidence may be had in this view only with a new low below 2,430.98. Further and substantial confidence may be had if price makes a new low below 2,405.70. Fibonacci ratios are calculated at primary and intermediate degree. If primary wave 3 is complete, then it exhibits the most common Fibonacci ratio to primary wave 1. It also perfectly exhibits a Fibonacci 55 weeks duration.
Primary wave 4 may not move into primary wave 1 price territory below 2,111.05.
Primary wave 4 should last about 8 weeks minimum for it to have reasonable proportion with primary wave 2. It is the proportion between corrective waves which give a wave count the right look. Primary wave 4 may last 13 or even 21 weeks if it is a triangle or combination.
If primary wave 4 reaches down to the lower edge of the Elliott channel, it may end about 2,320. This is very close to the lower range of intermediate wave (4); fourth waves often end within the price territory of the fourth wave of one lesser degree, or very close to it.
If price reaches the target at 2,500 and either the structure is incomplete or price keeps rising, then the next target would be the next Fibonacci ratio in the sequence between cycle waves I and V. At 2,926 cycle wave V would reach 1.618 the length of cycle wave I.
DAILY CHART
Click chart to enlarge.
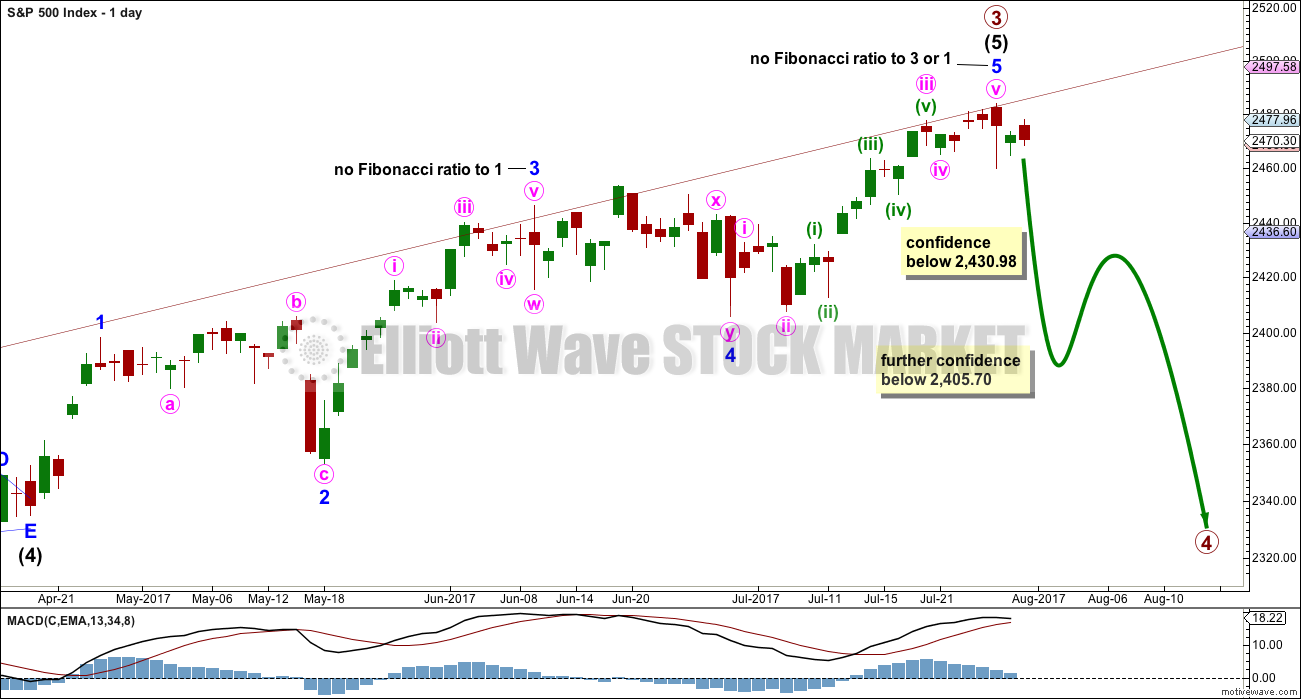
The daily chart shows only the structure of intermediate wave (5); this structure is an impulse.
There is perfect alternation between the deep expanded flat of minor wave 2 and the shallow double zigzag of minor wave 4.
There are no adequate Fibonacci ratios between minor waves 1, 3 and 5. This is not uncommon for the S&P500. Minor wave 3 exhibits strongest momentum and is the longest actionary wave, so this wave count fits with MACD.
It must be accepted that it is entirely possible that primary wave 3 may not be over and may continue higher while price remains above 2,405.70.
FIRST HOURLY CHART
Click chart to enlarge.
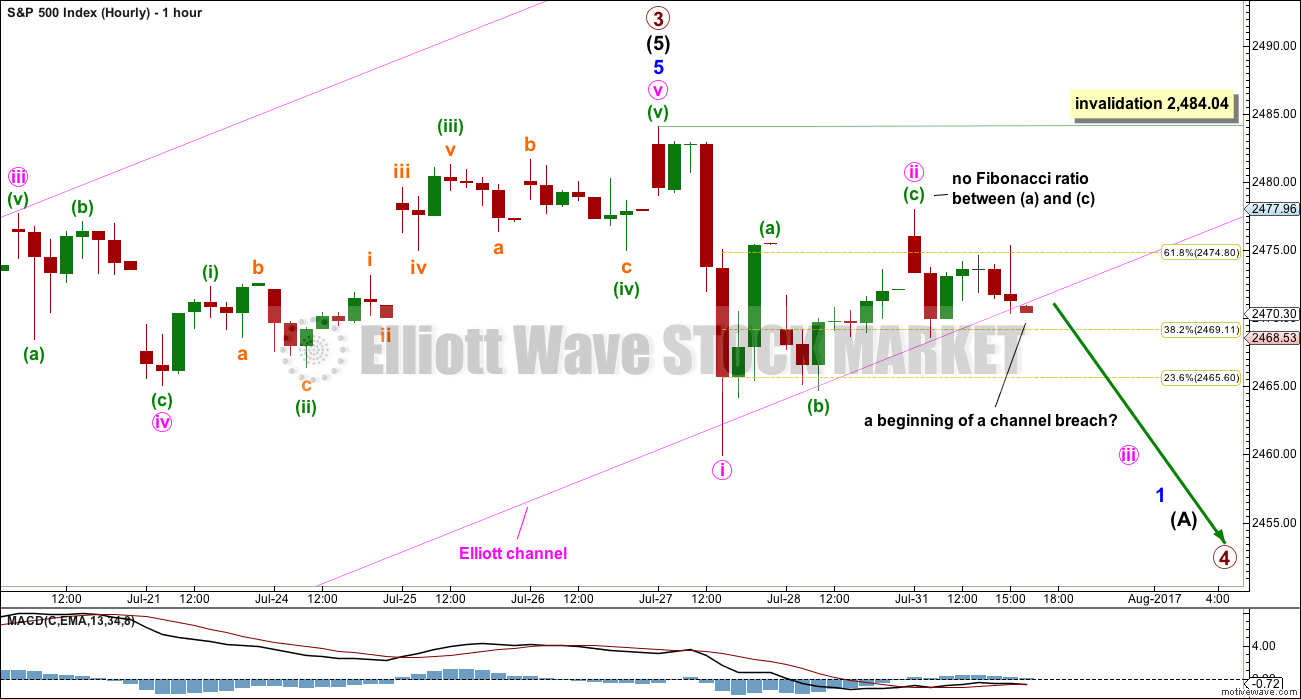
Minor wave 5 may now be a complete five wave impulse.
A strong breach of that channel would indicate a trend change, but it may not necessarily be a trend change at primary degree. At the end of Monday’s session, the last hourly candlestick may be the start of a breach of the channel.
If it continues further, then minute wave ii may not move beyond the start of minute wave i above 2,484.04.
SECOND HOURLY CHART
Click chart to enlarge.
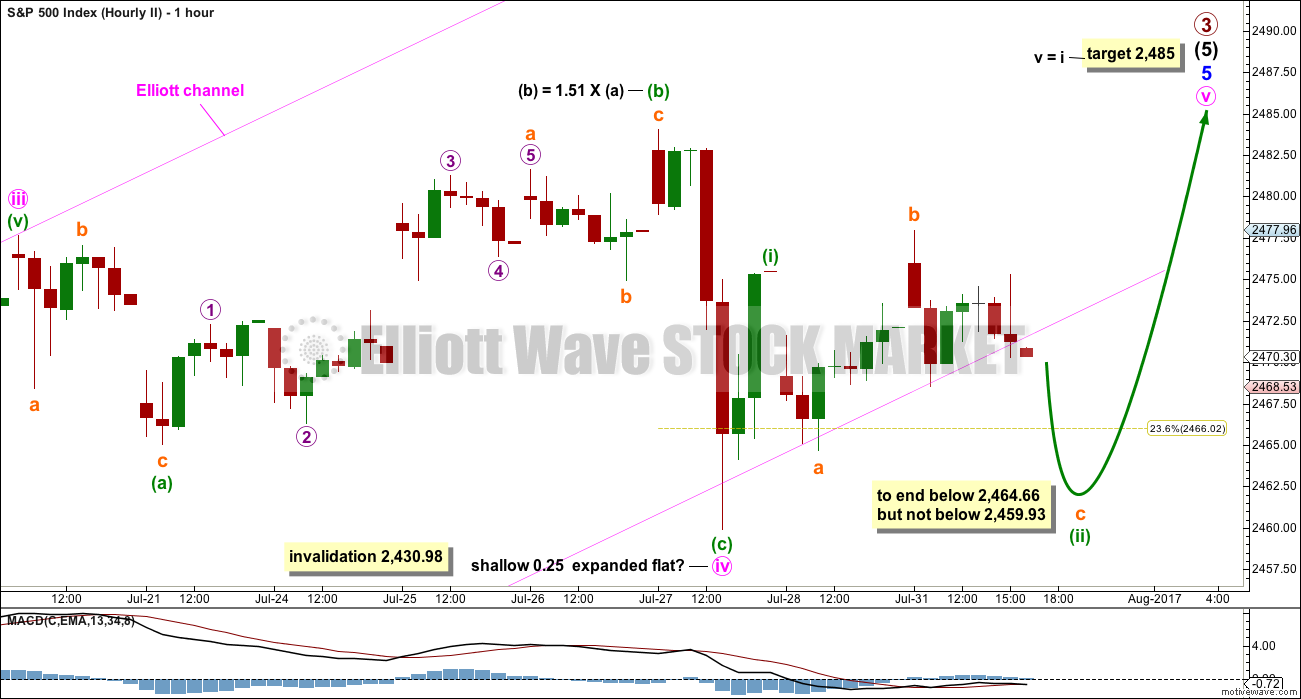
It is still possible that minor wave 5 is incomplete, that minute wave iv is still unfolding.
This wave count must be an alternate because there is inadequate alternation between minute waves ii and iv: both are expanded flats. There may still be good alternation in depth, but alternation is a guideline and not a rule and the S&P500 does not always exhibit perfect alternation.
Minute wave iv may have ended at Thursday’s low. The following fifth wave may end mid way within the channel, or at the upper edge.
Monday’s movement is starting to bring price below the Elliott channel. While this does reduce the probability of this wave count slightly, it is still viable. The S&P500 does not always fit neatly within channels. It has a tendency to breach upwards sloping channels but continue to new highs, as it forms slow curving rounded tops.
If it continues any further, then minute wave iv may not move into minute wave i price territory below 2,430.98.
TECHNICAL ANALYSIS
WEEKLY CHART
Click chart to enlarge. Chart courtesy of StockCharts.com.
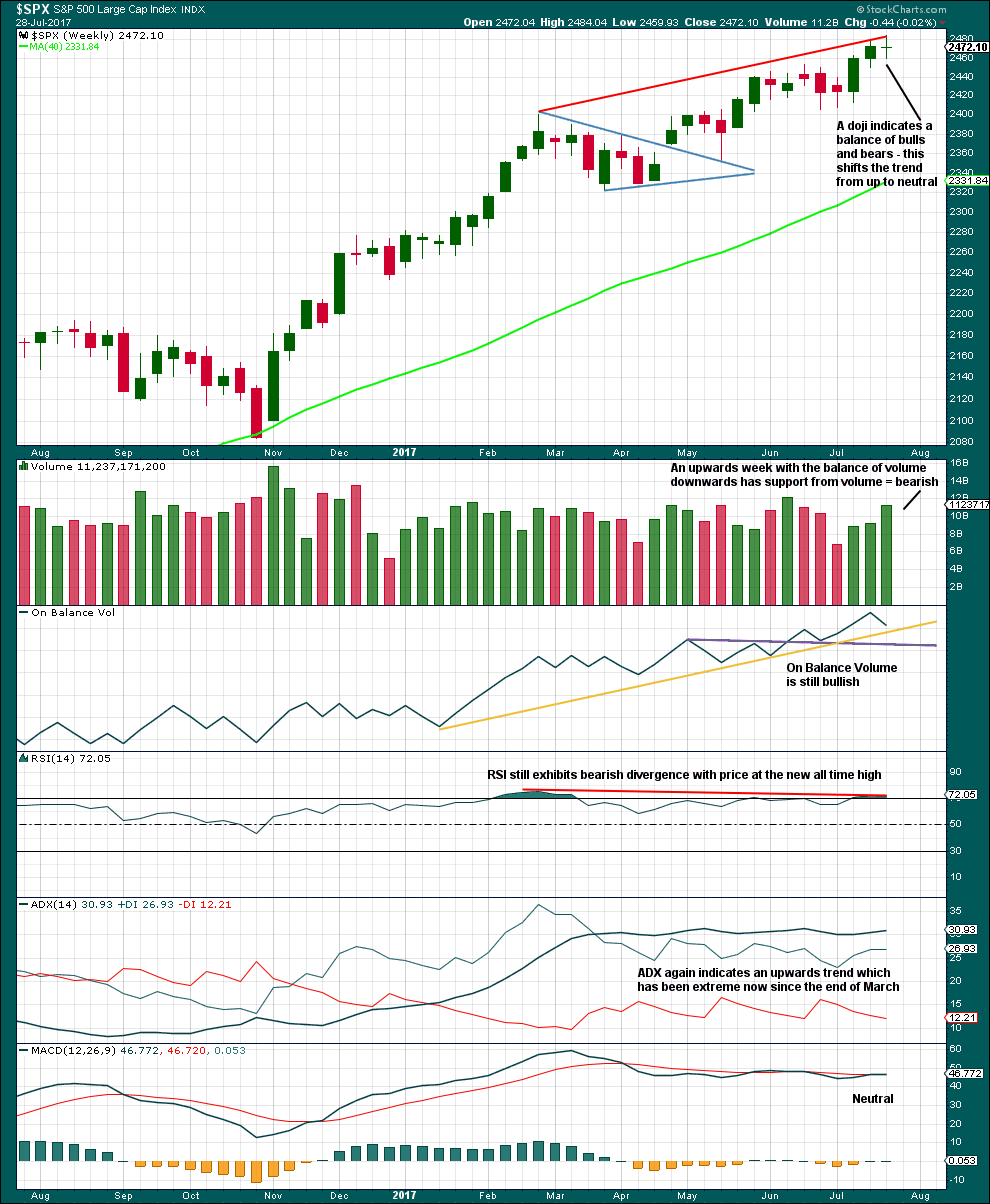
There is a little short term bearishness last week to support the labelling of the daily Elliott wave count: some support from volume for downwards movement, divergence still between price and RSI, and a doji candlestick.
With still extreme ADX, the conditions look right now for a primary degree correction here.
DAILY CHART
Click chart to enlarge. Chart courtesy of StockCharts.com.
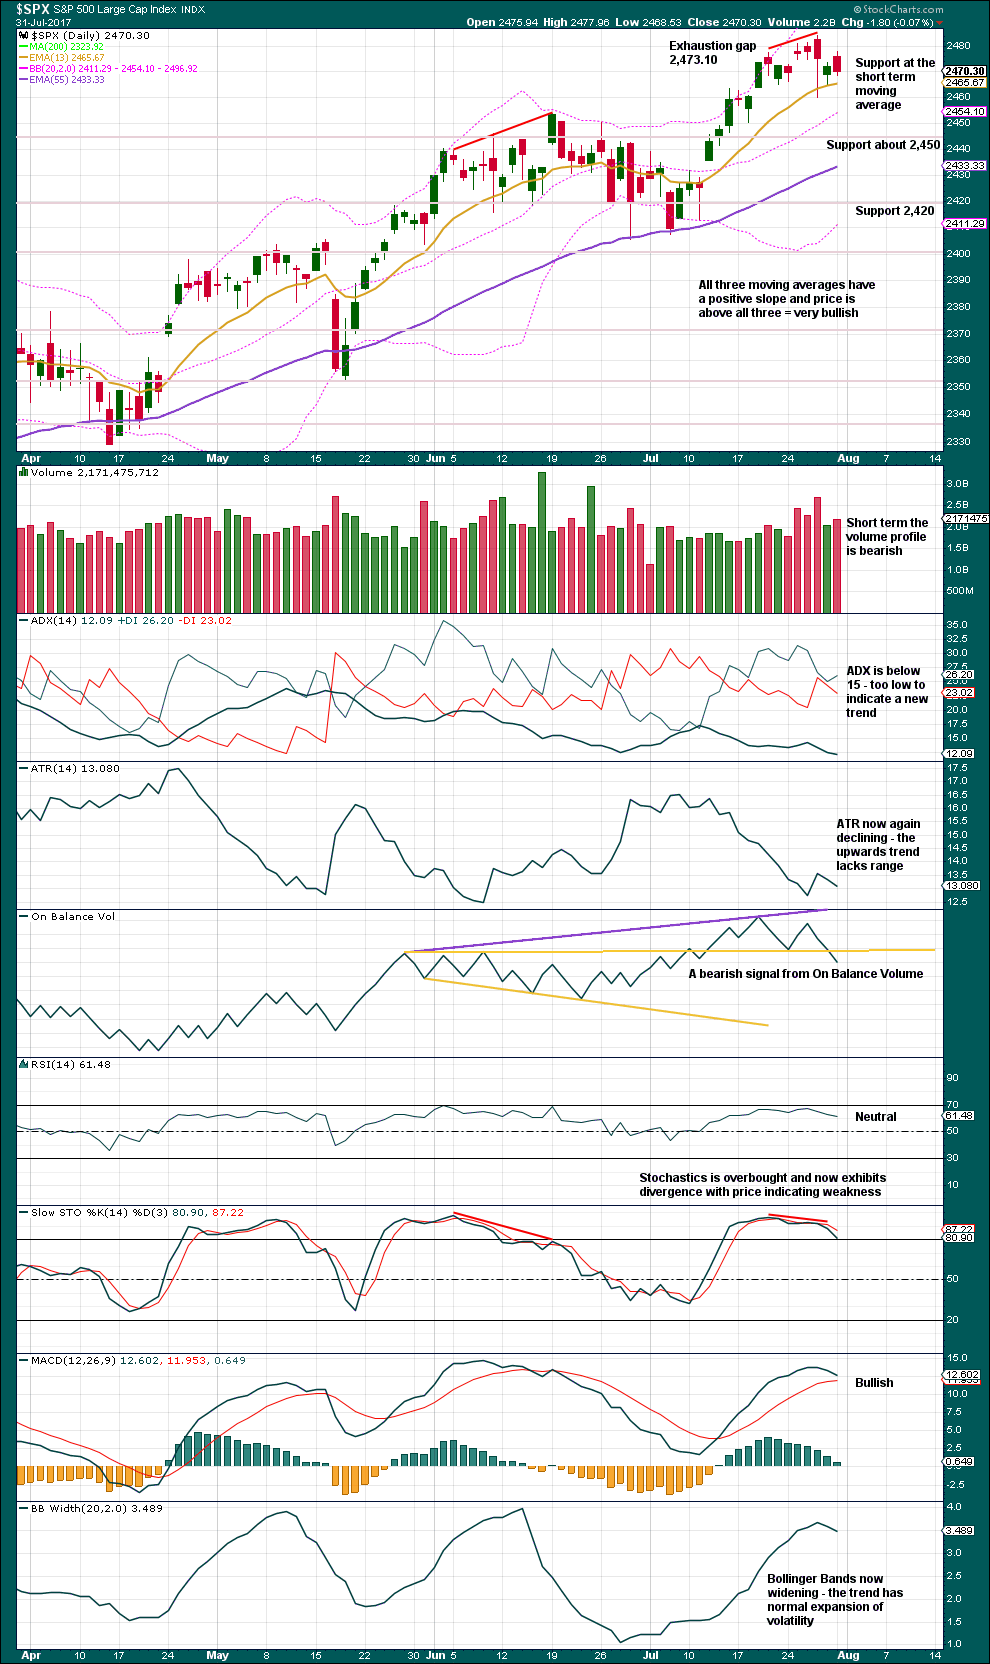
Monday’s session moved price higher, but with a balance of volume downwards and a red daily candlestick. Support from volume for downwards movement during Monday’s session is short term bearish. This supports the main Elliott wave count.
While the signal from On Balance Volume today is not very strong, it is reasonable. It too supports the main Elliott wave count.
In conjunction with bearishness at the weekly chart level, there is now more support for the main Elliott wave count than the alternate hourly Elliott wave count.
VOLATILITY – INVERTED VIX CHART
Click chart to enlarge. Chart courtesy of StockCharts.com.
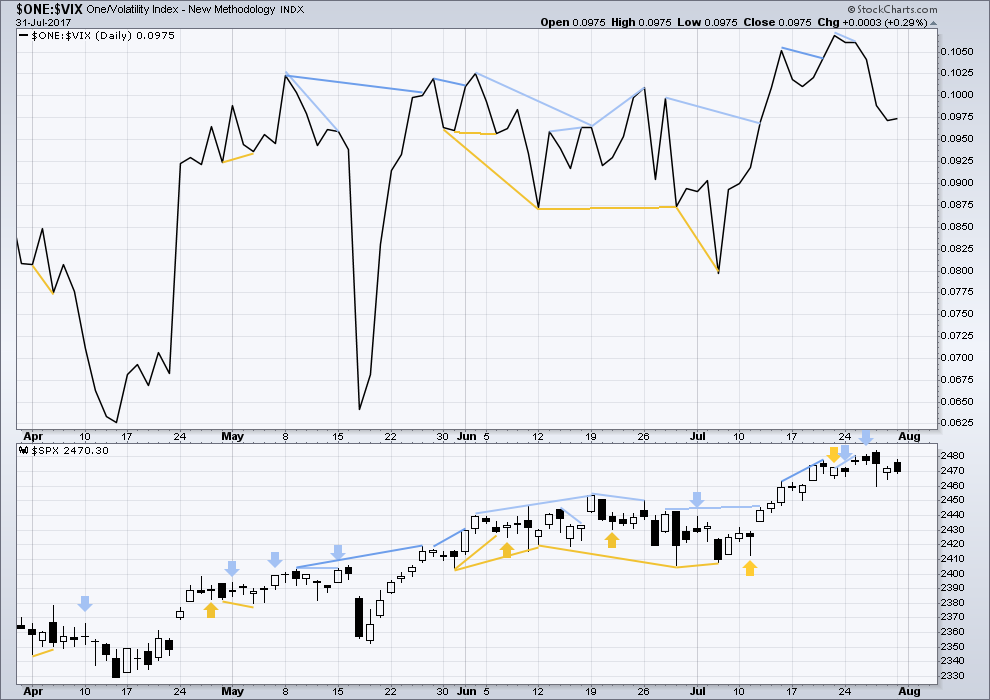
Normally, volatility should decline as price moves higher and increase as price moves lower. This means that normally inverted VIX should move in the same direction as price.
Price and inverted VIX moved higher for Monday. There is no new divergence.
BREADTH – AD LINE
Click chart to enlarge. Chart courtesy of StockCharts.com.
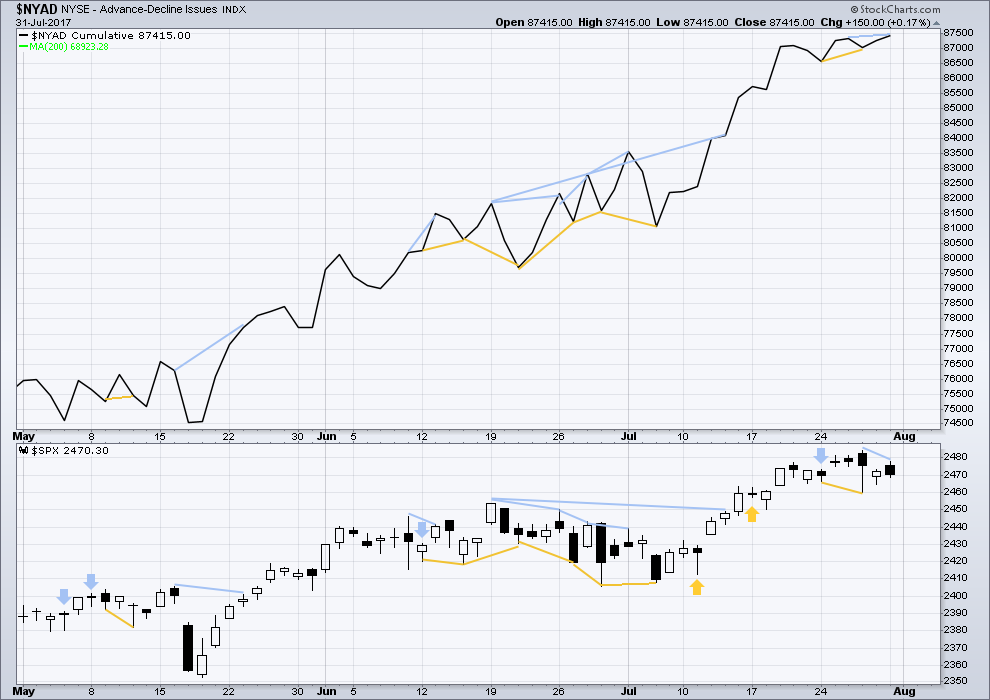
With the last all time high for price, the AD line also made a new all time high. Up to the last high for price there was support from rising market breadth.
There is normally 4-6 months divergence between price and market breadth prior to a full fledged bear market. This has been so for all major bear markets within the last 90 odd years. With no divergence yet at this point, any decline in price should be expected to be a pullback within an ongoing bull market and not necessarily the start of a bear market.
A new high today for market breadth does not come with a corresponding new high for price. Upwards movement during Monday’s session lacks support from market breadth and this is interpreted as bearish for the short term.
Lowry’s measures of internal market strength and health continue to show a healthy bull market. While the bull market overall remains healthy, there are signs at the end of this week of some short term weakness which may indicate a pullback to develop here. This supports the labelling of the Elliott wave count at the daily chart level.
Historically, almost every bear market is preceded by at least 4-6 months of divergence with price and market breadth. There is no divergence at all at this time. This strongly suggests this old bull market has at least 4-6 months to continue, and very possibly longer.
DOW THEORY
The S&P500, DJIA, DJT and Nasdaq have all made new all time highs.
Modified Dow Theory (adding in technology as a barometer of our modern economy) sees all indices confirming the ongoing bull market.
The following lows need to be exceeded for Dow Theory to confirm the end of the bull market and a change to a bear market:
DJIA: 17,883.56.
DJT: 7,029.41.
S&P500: 2,083.79.
Nasdaq: 5,034.41.
Charts showing each prior major swing low used for Dow Theory are here.
Published @ 09:32 p.m. EST.
Did anybody else see that monster spike in DJI futures to 22,062.00??
Candle now sporting a ridiculously long upper wick. What IS going on with all this erratic price action?! This is the third one in the last few hours!
apple earnings perhaps, up 7 percent after hours
Absolutely not . Take care Lara!
Hourly chart updated.
Your analysis may be later than normal today. I have a fever of 101 F.
Oh my! I hope you did not get an infection!
PLease! Get some rest and don’t worry about the analysis. I am confident your readers will not object to your taking time to recoup.
My son bought home influenza from school 🙁
The joys of having a child.
Should be better in a few days.
Hot chicken soup prepared in a pressure cooker to pressure pulverize the bones and tons of garlic; you’ll be good as new in 24 hours! Works for me like magic! 🙂
Brilliant. I’ll let Cesar know 🙂
Get some rest, Lara! We will take care of the market dump for you. :o)
Thanks guys
shes hot blooded,,check it and see,, shes got a fever of a hundred and three,,,shes hot blooded,hot blooded…. sorry, it just reminded me of the song
LOL 🙂
Nice one Doc
Once upon a time a doji above the upper BB could be relied upon to signal “That’s all she wrote!” Sadly, such is not the case anymore. I would not be surprised to see the cavorting above the upper BB continue but nonetheless, I think at the very least a short term top is not too far away.
Well the response to AAPL’s earnings looks overwhelmingly positive, so unless Tim Cook comes out and says they are moving production to Syria it’s looking like we will remain above the upper BB for the time being.
…Unless they sell the news! 🙂
Do we have the start of a break finally?
I see a flash crash in the SPY at 2pm on the dot
Maybe tomorrow…:)….does feel a little light and the air feels thin….
What’s up with that?
I have been getting alerts of SPX at 20 handles lower and when I check the chart…NADA! Wierd!
everyone’s waiting for Apple!
Agreed.
The index to watch is DJI. Every other index (except Trannies) seems to be waiting for it to top. It has yet to break decisively through the bottom of the rising bearish wedge but the above BB doji being printed today could be a sign that it could happen in the next session or two.
A break of that lower boundary should see a rapid waterfall decline back to the start of the wedge at the April lows.
Here is an interesting inside story that could have some fascinating market implications. Trump set a brilliant trap for the Rinos and Democrats in congress over their failure to repeal Obamacare. They think they have backed him into a corner but then he plucked that ace out of his sleeve on the matter of how the subsidies are being funded, both for members of congress and the general public. Obama shamelessly stole from investors in Fannie and Freddie and illegally used it to fund Obamacare. The courts have agreed that such theft was unconstitutional as Congress did not authorize it. The rumour is that Trump is not only not bluffing, whatever Congress does he is going to return those funds to Fannie and Freddie and fully recap those institutions. Watch the price of those two carefully. Once the crowd figures out that this is likely to happen, the prices could really explode higher! 🙂
I think we are about to witness a classic case of market makers trying to ambush traders who got positioned on that huge bearish engulfing candle yesterday. This is becoming quite common and the reason I took profits quickly. That bearish engulfing candle is real, and represents a massive liquidation of long positions yesterday. In spite of that reality, I would not be in the least bit surprised to see a ferocious attempt to stop out anyone who got short yesterday by market makers relentlessly ramping price back up toward the upper BB over the next few days. If it happens, the key thing to remember is that move would be wholly contrived and they are eventually going to have to unwind it. DDS is a dead man walking. Lock and Load! 🙂
Looks like we need one more spike up in SPX and I wish it would go ahead and get it over with. This sideways meandering is for the birdies…!
DDS printing a long lower wick so may make another run at upper BB before finally rolling over in earnest. The market makers are probably ticked over getting “hammered” on that ugly red candle! 🙂
Looking like Oil has run into stiff resistance at 50.00
Buying USO August 10.00 strike puts at 0.27 per contract 1/4 position.
Buy stop for second another 1/4 when bid hits 0.30.
Hard stop on any close above 10.00
RUT failure to break above 1426-1427 area is interesting in the context of a relatively broad (albeit small) advance on the S&P. All the volatility indices have bee pinned down, including VVIX. Volume is rather unconvincing though. The bottom of Lara’s channel continues to be an extremely stubborn source of resistance.
Yep. They are trying to squeeze every drop of juice out of vol to try and jack the algos to mis-read value at risk.
They are also desperately trying to re-start the short-the-yen party.
Witnessing S&P 500 Utilities Sector breaking out of resistence to the upside.
Infrastructure has around 40% utilities precisely. So I’m watching this SPDR as much as the Transports.
Selling DDS August 18 80 strike calls for 2.50 per contract. Opened buy to close at 1.25.
Hard “stop” with contingent order to hedge with buy to open 85 calls on any CLOSE above 80.00
Waiting to reload for DDS to re-test today’s high area around 75.00 -75.45
……?…..?..
Not quite. VIX heading South we we are probably going higher short term….unless it puts in a reversal soon…
Questioning whether initial wave down from high 2484 was a 3 wave for “a” and now completing an ascending triangle for a “b” wave with “c” wave down to target 2455.
Will reload DDS shorts on any move above 74.00
Sorry Verne
What is DDS?
Dillards. A retailer.
Wow! What an amazing lesson in patience and trading discipline. While it is very important to have a number that says you are wrong about a trade, it is also important to know as a trader when you are being played.
I mentioned in the last thread how I looked in disbelief at the price action of DDS the last few weeks as compared to the health of the chart and concluded there was some serious “playing” going on. There are those rare occasions when it pays to trust the TA even when price temporarily goes against you and this was certainly the case with DDS. I managed to limit downside loss to about 3% by rolling my short positions in DDS. I went from a 3% loss to a 5X return in less than 24 hours just by being patient and disciplined. One of the things I have happily learned from Lara over the last few years! 🙂
(BTW, the 5X return was achieved by strategically adding to short position once the capitulation point had been confirmed)
Very nice Verne 🙂
DDS offered another nice entry on the pop this morning ; 75 strike puts gave a quick double! (hint!) 🙂
VIX divergence could be indicating the mania party close to an end…
End of month window dressing done, now beginning of month repositioning, then …….. down?
The start of the real move down will be impulsive and will decisively take out 2470.00 ( and probably retest). Until that happens I would keep my powder dry…. 🙂
looks like we are still going up!
comment,,first one that is