
Last analysis was clear: the trend is still up. A new all time high was therefore expected as most likely.
Summary: The trend is up. Trading with the trend is the safest approach for your account. Use corrections as an opportunity to join the trend. The last open gap may be used for stops at 2,473.10.
The short term target is either at 2,481 to 2,482, or next at 2,490.
New updates to this analysis are in bold.
Last monthly and weekly charts are here. Last historic analysis video is here.
MAIN ELLIOTT WAVE COUNT
WEEKLY CHART
Click chart to enlarge.
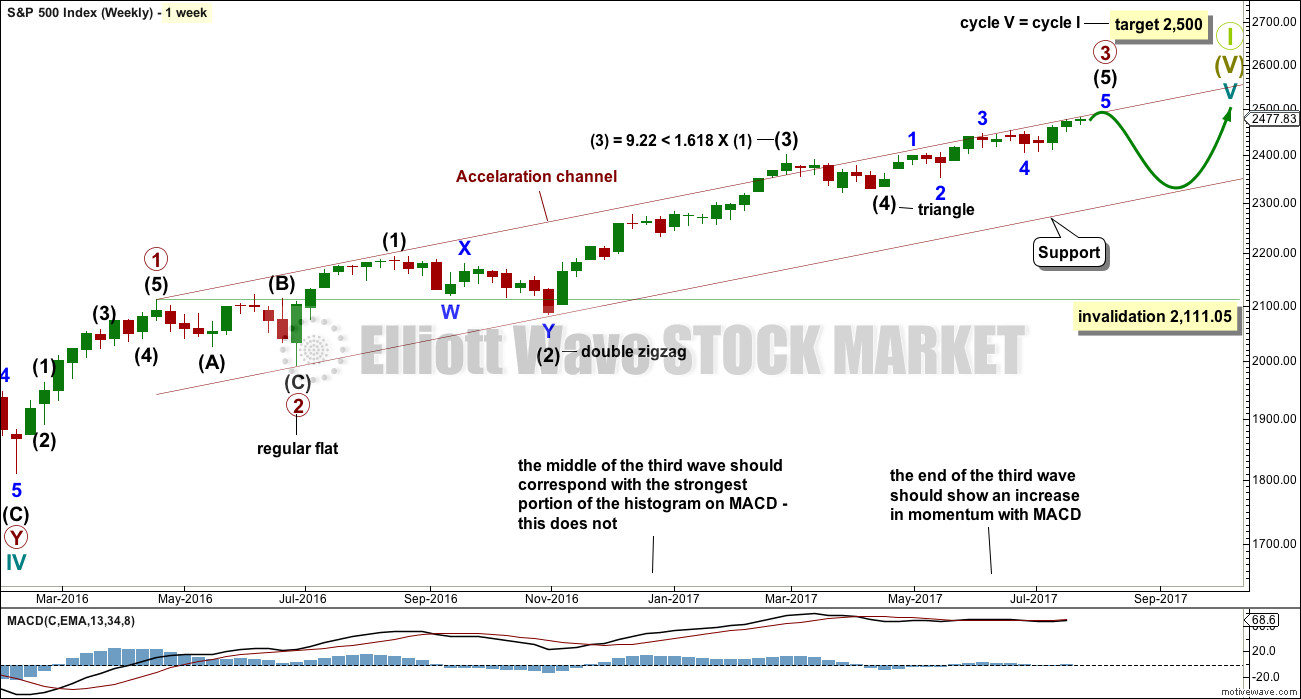
This wave count sees primary wave 3 as incomplete, but close to completion.
Within primary wave 3 impulse, the final wave of intermediate wave (5) is seen as incomplete. Intermediate wave (5) is subdividing as an impulse.
When intermediate wave (5) is complete, then primary wave 3 would be complete. Primary wave 4 may not move into primary wave 1 price territory below 2,111.05.
Primary wave 4 should last about 8 weeks minimum for it to have reasonable proportion with primary wave 2. It is the proportion between corrective waves which give a wave count the right look. Primary wave 4 may last 13 or even 21 weeks if it is a triangle or combination.
If price reaches the target at 2,500 and either the structure is incomplete or price keeps rising, then the next target would be the next Fibonacci ratio in the sequence between cycle waves I and V. At 2,926 cycle wave V would reach 1.618 the length of cycle wave I.
DAILY CHART
Click chart to enlarge.
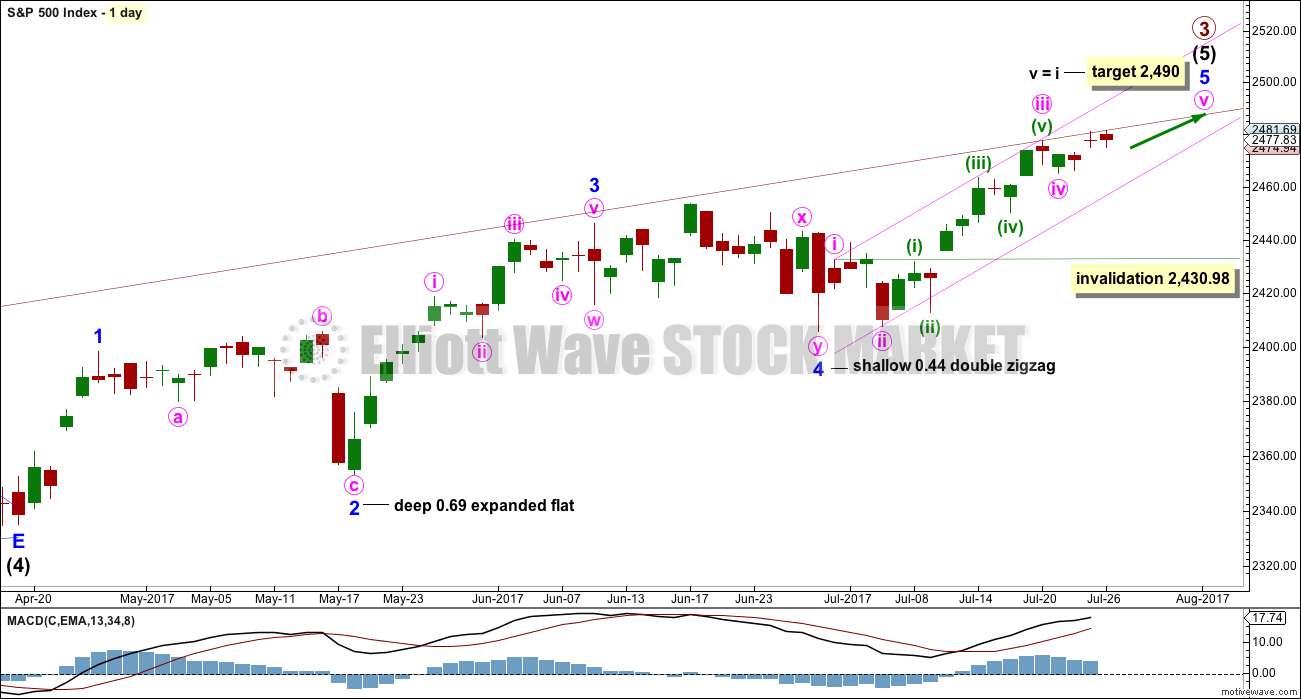
The daily chart shows only the structure of intermediate wave (5); this structure is an impulse.
Within intermediate wave (5), minor waves 1 through to 4 are now complete. The final fifth wave of minor wave 5 is underway. Within minor wave 5, minute wave iv may not move into minute wave i price territory below 2,430.98.
Minor wave 5 is extending. Within minor wave 5, minute waves ii and iv now both show up clearly at the daily chart level. This portion of the wave count has now the right look. It would still look right if minute wave iv continued sideways for another day to two, taking up a bit more time. However, volume still does not support this view today. Volume suggests minute wave iv is over.
Within minute wave iii, the subdivisions of minuette waves (ii) and (iv) now look clear on the daily chart.
There is perfect alternation between the deep expanded flat of minor wave 2 and the shallow double zigzag of minor wave 4.
FIRST HOURLY CHART
Click chart to enlarge.
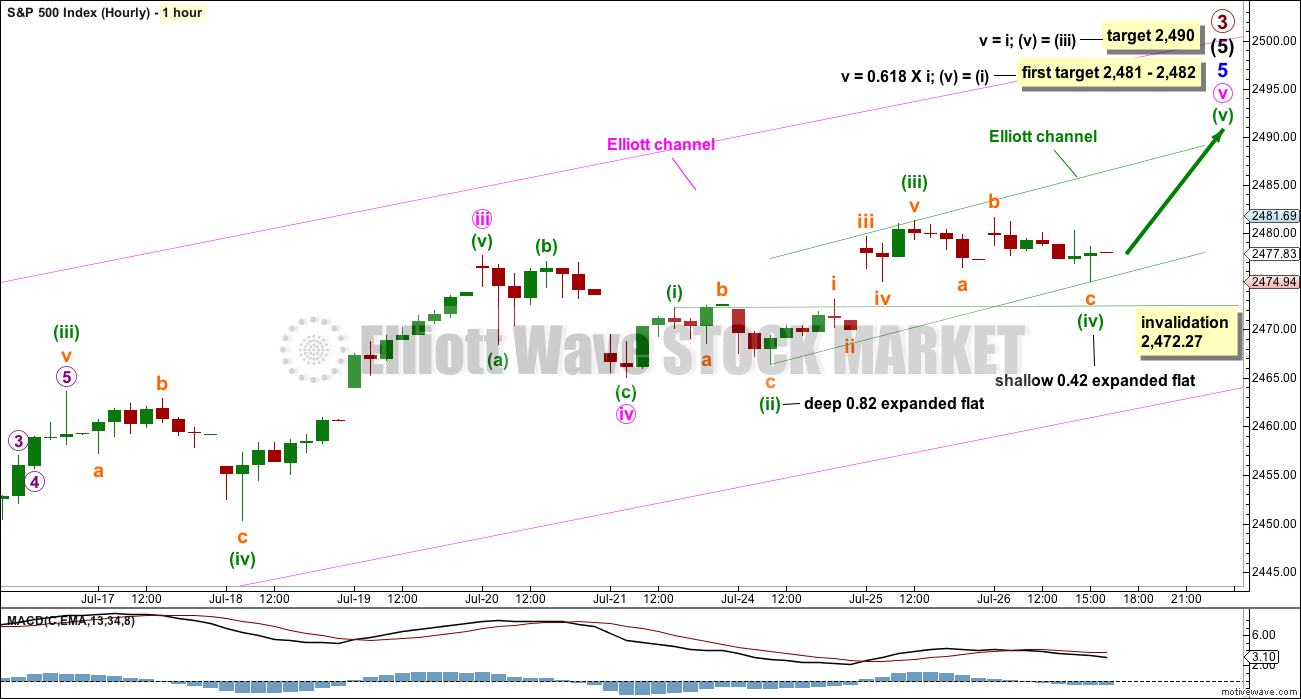
Minor wave 5 may be subdividing as an impulse so far. The middle of the third wave has the strongest upwards momentum. This wave count fits so far with MACD.
Attention now turns to the structure of minute wave v, within minor wave 5, within intermediate wave (5) to end primary wave 3 in its entirety. Current upwards movement may be a fifth wave at four degrees if this wave count is correct, so some weakness should be seen.
Minute wave v looks like it is subdividing as an impulse so far. Within minute wave v, minuette waves (i) through to (iv) may be complete.
Alternation is a guideline and not a rule. There is inadequate alternation now between minuette waves (ii) and (iv): both are expanded flat corrections. But there is alternation in depth: one is deep and the other shallow. This wave count is acceptable, but the probability that it is correct is slightly reduced.
Minuette wave (iv) does not fit within an Elliott channel drawn using the first technique, so the second technique is used. Minuette wave (v) may end within the channel.
Two small target zones are now provided, both calculated at two degrees. Minuette wave (v) only needs to move beyond the end of minuette wave (iii) at 2,481.24 to avoid a truncation. It does not have to move beyond the price territory of minuette wave (iv) above 2,481.61. The lower target may have a slightly higher probability.
If price keeps going up above the first target, then use the second target.
Minuette wave (iv) may not move into minuette wave (i) price territory below 2,472.27. If price makes a new low tomorrow below this point, before another high, then use the second wave count below.
SECOND HOURLY CHART
Click chart to enlarge.
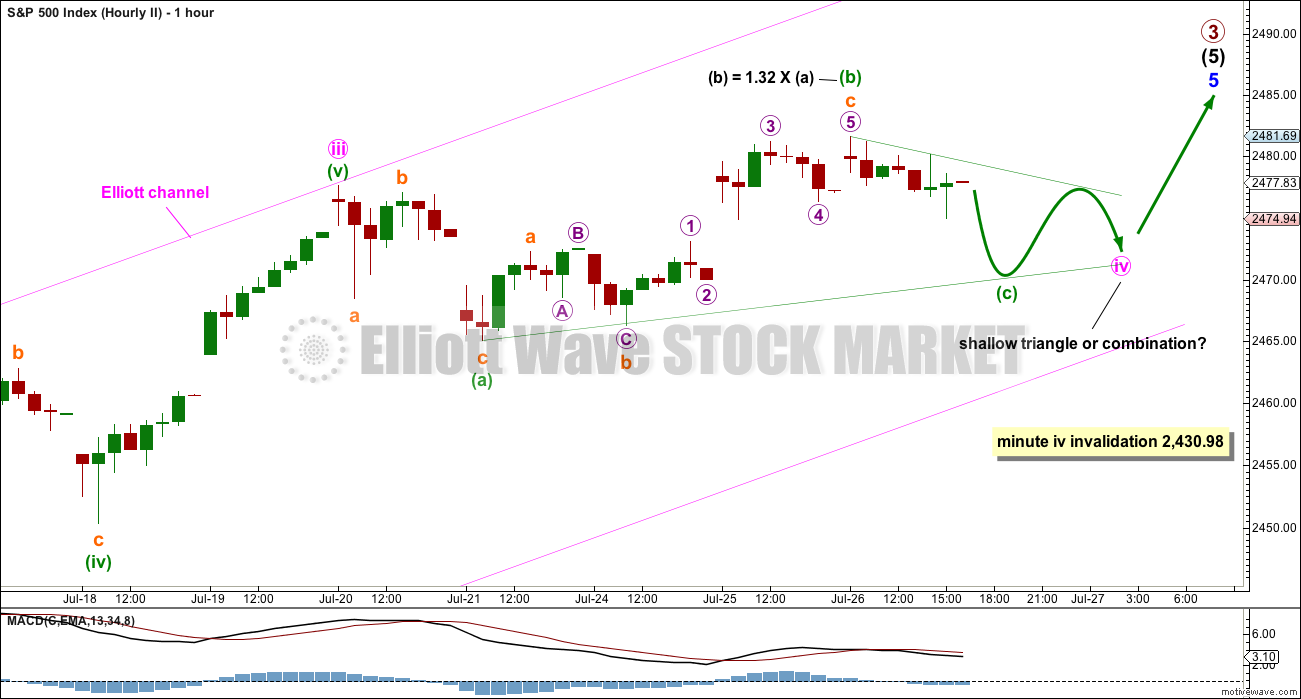
It is also possible that minute wave iv may not be over and may continue further sideways for another one to two days this week.
Minute wave ii was an expanded flat correction, so the least likely structure for minute wave iv would also be an expanded flat as that would offer no alternation in structure. Minute wave iv may be a triangle and still have good alternation, or a combination and still have reasonable alternation.
Both triangles and combinations are sideways movements. Lower degree Elliott wave triangles equate to pennant patterns and combinations equate to flag patterns. Both are reliable continuation patterns and should be used as opportunities to join a larger trend.
A triangle or a combination may include a new high above the start of minute wave iv at 2,477.62. Unfortunately, there is no upper invalidation point for this second hourly wave count, so no upper price point which may add confidence to the first hourly wave count.
As triangles move towards their end they often (not always) come with MACD hovering about zero or sitting flat. So far MACD is now mostly flat, offering some support now to this wave count. However, triangles also almost always come with declining volume. This is strongly not the case, so this wave count must be judged to have a lower probability than the first hourly chart.
The structure of subminuette wave c within minuette wave (b) of the possible triangle is also now problematic. Within subminuette wave c, the impulse of micro wave 3 looks like a three but should be a five.
Minute wave iv may not move into minute wave i price territory below 2,430.98.
TECHNICAL ANALYSIS
WEEKLY CHART
Click chart to enlarge. Chart courtesy of StockCharts.com.
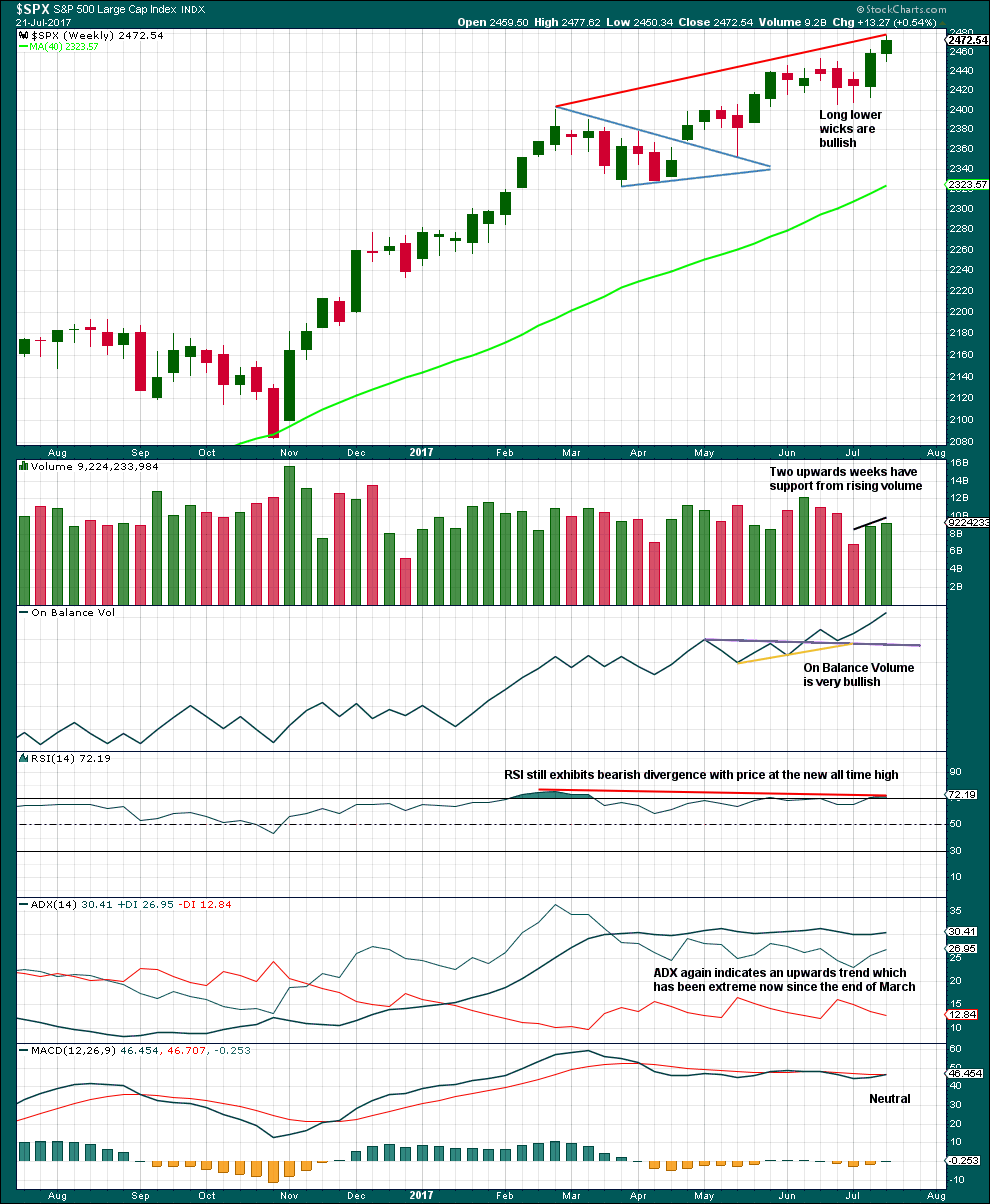
Volume is bullish. On Balance Volume is very bullish.
ADX is extreme and usually at the weekly chart level this quickly leads to a pullback to last two to four weeks. During the current bull market, which began in March 2009, ADX has only reached extreme on four previous occasions. On each of those occasions it was immediately followed by two weeks of downward movement in one case and four weeks of downwards movement in the other three cases.
In all four prior cases the pullback was sufficient to bring ADX down back below the directional lines and below extreme.
This time ADX has remained extreme for 17 weeks although the ADX line has not been rising for the whole time, only fluctuating. This trend is looking very stretched, but at this stage it may be better to rely upon Elliott wave structure and other indicators to tell when the next multi week pullback may begin.
DAILY CHART
Click chart to enlarge. Chart courtesy of StockCharts.com.
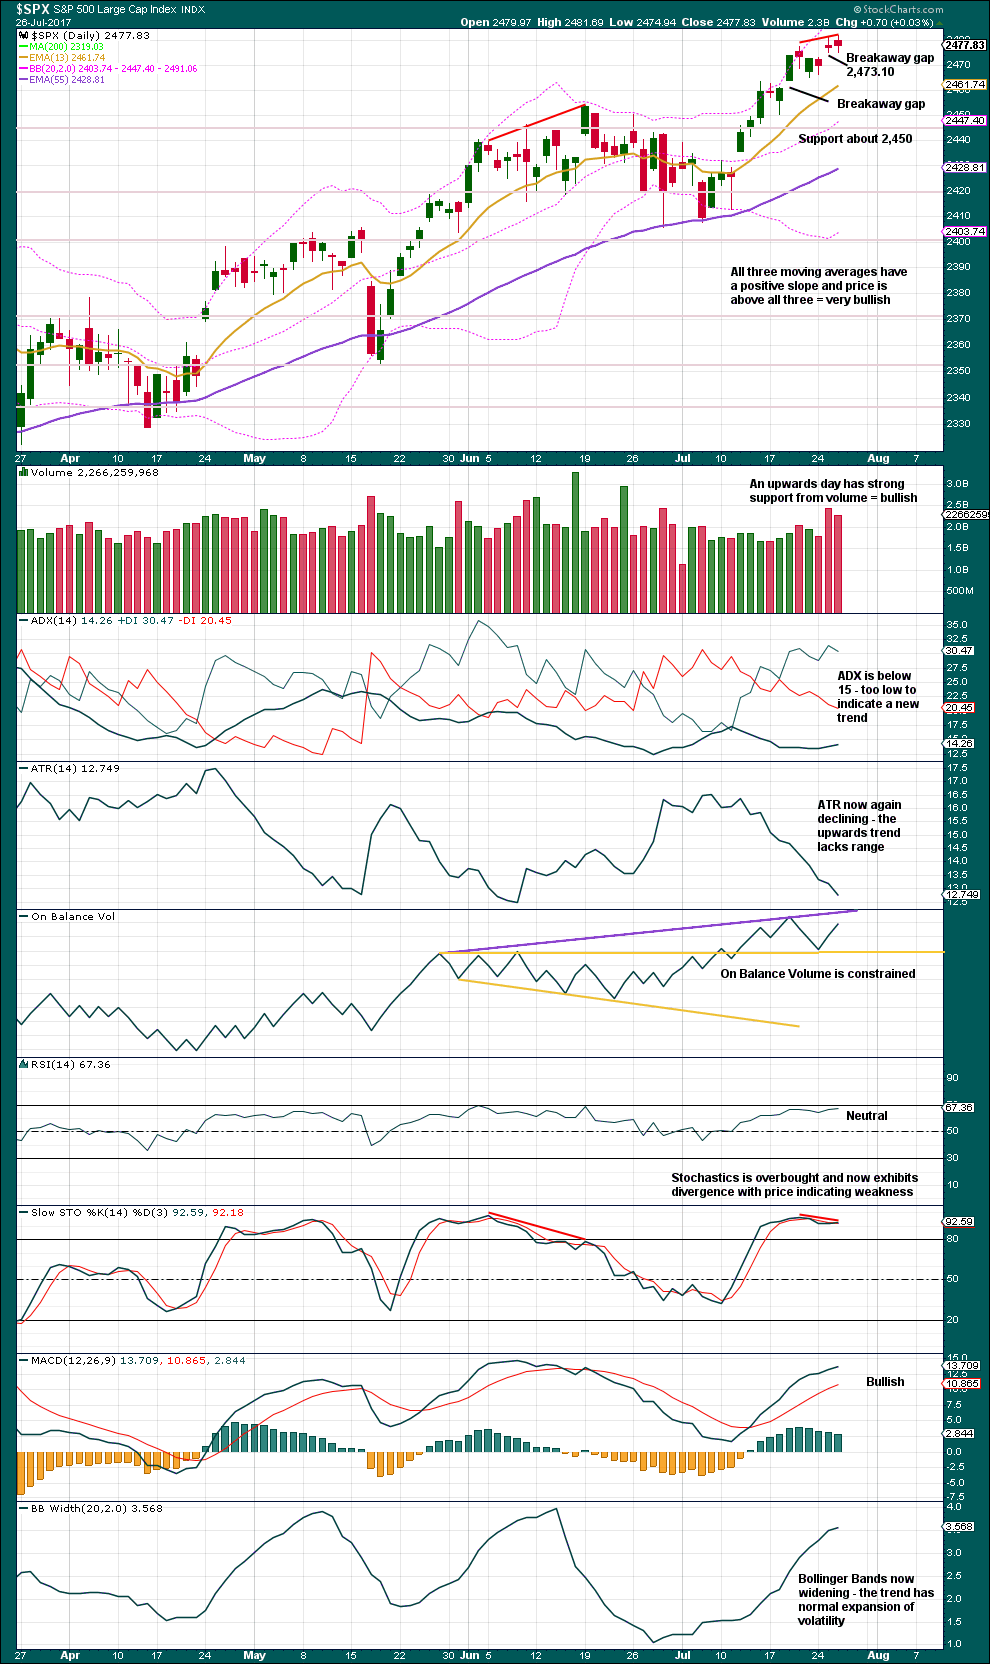
Another new all time high now comes with a small decline in volume, but volume for the last two upwards days is still relatively heavy. This suggests upwards movement may continue a little further at least for the short term.
ATR still continues to strongly decline and is now very low indeed. Upwards movement looks weak.
A new support line is added for On Balance Volume. This line is horizontal and tested at least five, and possibly six times. A breach of this line would be a reasonable bearish signal.
Stochastics may still remain extreme for longer, and divergence may develop further into multiple divergence before a high is found and price turns. If RSI reaches into overbought as well, then a high may be closer.
Overall, the trend is clearly up and has some strength still. Corrections are still an opportunity to join the trend. However, with the Elliott wave count expecting a deep sustained pullback coming soon in the form of primary wave 4, members are strongly advised to exercise good risk management and keep stops tight. The last open gap at 2,473.10 should be a reasonable point for stops. If this gap is closed, then it would not be a breakaway gap but an exhaustion gap, and it would then be possible that a deeper pullback is underway.
VOLATILITY – INVERTED VIX CHART
Click chart to enlarge. Chart courtesy of StockCharts.com.
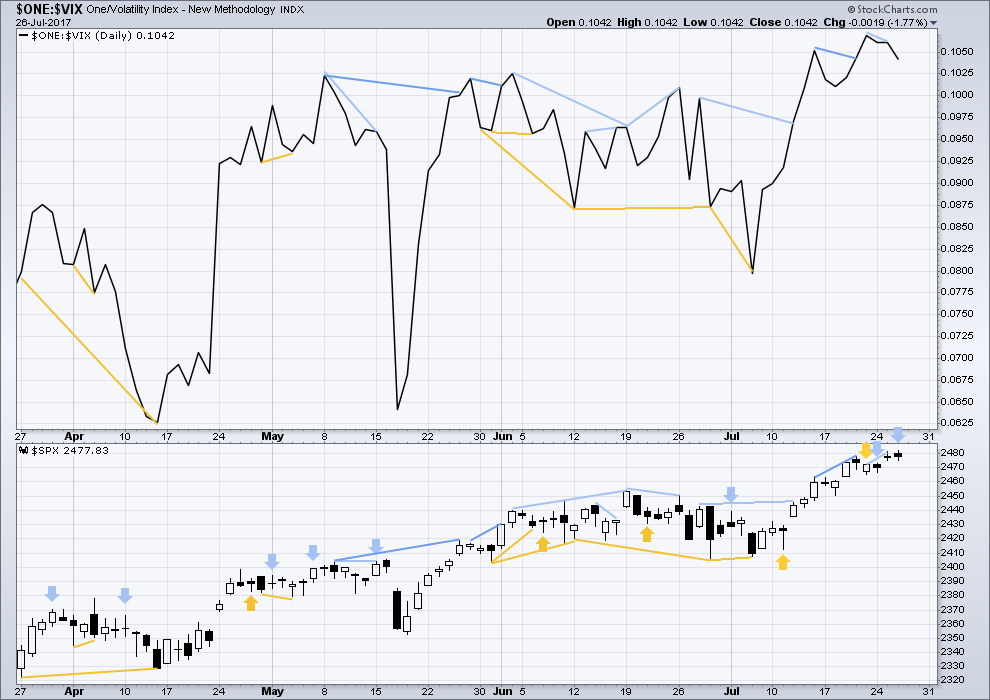
Normally, volatility should decline as price moves higher and increase as price moves lower. This means that normally inverted VIX should move in the same direction as price.
Another signal of bearish divergence comes today. Price has made a higher high and a higher low, the definition of upwards movement. However, this has not come with a normal corresponding decline in volatility. Inverted VIX has moved lower (indicting an increase in volatility), so there may be weakness within upwards movement from price today.
With now three bearish signals in a row and no downwards movement yet, this may be a warning of a deeper pullback to come soon.
BREADTH – AD LINE
Click chart to enlarge. Chart courtesy of StockCharts.com.
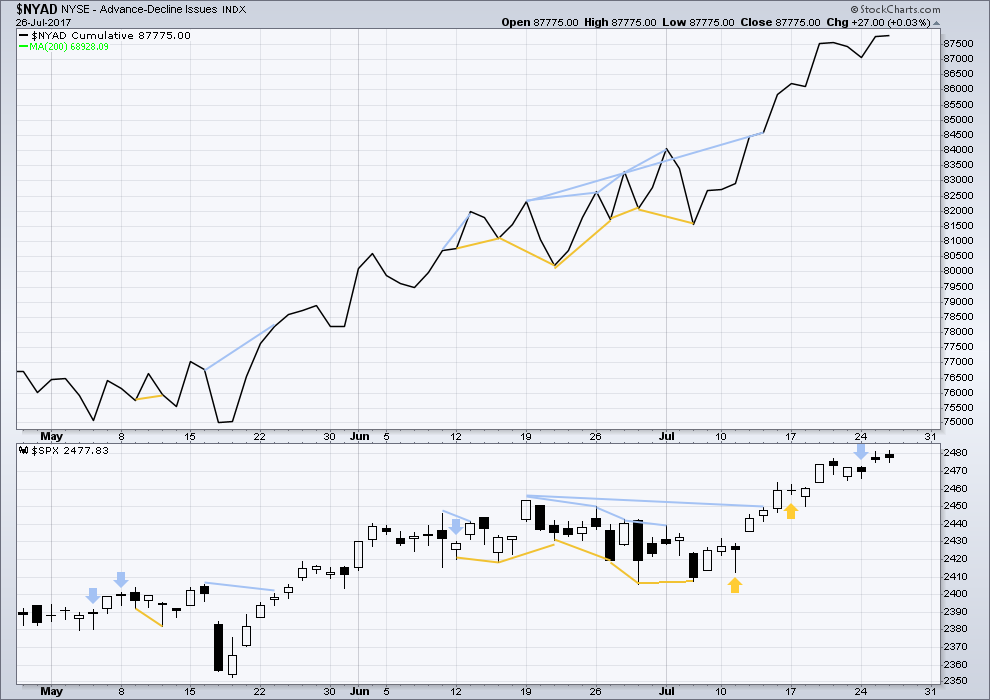
With the last all time high for price, the AD line also made a new all time high. Up to the last high for price there was support from rising market breadth.
There is normally 4-6 months divergence between price and market breadth prior to a full fledged bear market. This has been so for all major bear markets within the last 90 odd years. With no divergence yet at this point, any decline in price should be expected to be a pullback within an ongoing bull market and not necessarily the start of a bear market.
There is no new divergence today between price and market breadth; the new all time high for price is matched by a new all time high for the AD line.
Lowry’s measures of internal market strength and health continue to show a healthy bull market. This week has seen a further increase in internal health of the market, so we may have some confidence that this bull market shall continue.
Historically, almost every bear market is preceded by at least 4-6 months of divergence with price and market breadth. There is no divergence at all at this time. This strongly suggests this old bull market has at least 4-6 months to continue, and very possibly longer.
DOW THEORY
The S&P500, DJIA and DJT have all made new all time highs.
Nasdaq has made a new all time high. Modified Dow Theory (adding in technology as a barometer of our modern economy) sees all indices confirming the ongoing bull market.
The following lows need to be exceeded for Dow Theory to confirm the end of the bull market and a change to a bear market:
DJIA: 17,883.56.
DJT: 7,029.41.
S&P500: 2,083.79.
Nasdaq: 5,034.41.
Charts showing each prior major swing low used for Dow Theory are here.
Published @ 10:18 p.m. EST.
Did anyone notice the transportation stocks got hammered today. Dow transports now significantly off ATH. So likely any near future ATHs in S&P will lack confirmation.
Yes, indeed. DJT has in the recent past appeared to be a laggard. Perhaps now it’s leading?
Updated hourly chart;
Putting this up quickly before NY closes for you all.
I’ll have confidence in this if we see a new low below the start of minor 5 at 2,405.70.
First, lets see if the Elliott channel can be properly breached. As Andrew notes below, price has bounced up off that line. If it’s breached, look for a throwback.
But it’s not breached yet.
We may not be quite done yet. DJI closed at the highs of the day and SPX reclaims the 2470 pivot and this to me looks bullish short term. Lot of buying power stepped in so the banksters appear to be still alive and kicking…for now…
Yep. I’ll have another chart which sees only minute i of minor 5 done, and todays low minute ii.
After classic TA analysis will decide which one is main and which one is alternate.
Very curious about OBV will reveal about today’s price action. Very different apparent profiles for DJI and SPX. Curioser and Curioser! 🙂
Lara,
Could today’s low instead be an expanded flat to complete minute 4 so that minute 5 wil also end in 2490 range.
Yes, that is possible. But then both minute ii and iv would be expanded flats. There would be no alternation in structure.
Which is possible, but I have to judge it to have a lower probability.
Curious to see what Lara’s results of this craziness are. Almost a mix of the two hourly charts.
I think it might be P4 arriving….
But I don’t have confidence in that view yet.
Last time I called that I was oh so wrong 🙁 That makes me a bit nervous about it. So will have an alternate.
Higher hi and lower lo InNasdaq. Volume was pretty good to the down side. 77 million to the downside on the nasdaq vs. 30 million 90 day average on qqqs
Things that make you go hmmmmm…
Hmmmmmm…..;)
We didn’t even reach the 50dma or even the 20dma. With AMZN missing I would expect more downward movement tomorrow especially now that earnings are over half over. The wild card here is AAPL, which has been the weakest of the FAANGs and could give NDX a nice pop if the reaction to earnings is good.
150 point swing, high to low, on the NDX today.
It is truly hilarious watching the buy-the-dip bots go ape-sh_t on the initial move down in a big trend change….way too funny!
Looking for a .618 retrace on qqq….about 144.5
This is a complete replay of June 9th. I still don’t think P4 has started unless AMZN tanks on earnings and brings the Nasdaq down to the 50dma. We could still reach Lara’s target of 2490 next week.
There’s been a slight rebound off the lower end of Lara’s Elliott Channel, although it was definitely breached. Are we in agreement this is the start of P4? Minute 4’s invalidation point is all the way down at 2430.
Just realized we broke the hourly Elliott channel but now bouncing back into it
Yes I’m thinking at this point it could still go either way. So far the action is looking a *lot* like what we saw on June 9. SPX proceeded to hit an ATH a week later, then fell into the June swoon.
I know 🙁
Will be looking for an alternate that could see another new ATH next week.
My go to will be to move the degree of labelling within minor 5 down one degree, this may be only minute ii within an extension upwards.
How low can Primary 4 go – 2300 area (level of intermediate 4)?
Technically it can touch the end of primary 1 at 2,111.05
BUT
that would have all the wrong look, pretty sure it wouldn’t get that low, if price did that I’d be looking for a Grand Super Cycle trend change not just P4
So….
P4 if it sits within the maroon Elliott channel on the weekly chart may find support about 2,325
For option traders, today will probably be the last day to buy contracts at a reasonable premium. Things are going to get ugly overnight I suspect.
You just wait until all the morons shorting volatility wake up and realize what’s going down….
Thankfully, I managed to grab VXX at $11.05, just at the breakout. Stop was comfortably profitable in just a few minutes. What a rare gift!
You know that you have executed a volatility trade perfectly when it goes in the green immediately. 🙂
It works great with a contingency order at the end of a vol spike and actually can be easier to catch than the upside move. I had been underwater for several days now…not any more!!!! 🙂
Stopped out at $11.38 on the pullback for nice profit.
Quick double on NFLX puts. Unloading half for 6.50
Holy sell offs! Best day I’ve had in a while. Straight up putting everything in sight for past hour. While October VIX calls up 20%. :o)
I suppose one good thing about this mindless, knee-jerk slamming of volatility at what is clearly a market inflection point is that it is giving people paying attention multiple opportunities to buy volatility at historic lows…but not for long I suspect…..
This is turning out to be a helluva awesome day!! I know you’re having fun too Verne 🙂
😀 😀 😀
Higher hi, lower Li for qqqs and Spx.
I only got a partial fill on my NFLX puts at 3.20 and I can’t say I blame the market makers.
They have already cleared 4.00. It was still a little underhanded…. 🙂
(I should have bought in smaller lots…he! he!)
I think partial fills are often the result of individuals, rather than market makers, taking the other side of the trade. I really hate partial fills but I never think to put in all or none.
It can happen when the bid/ask moves in the middle of the trade. I need a faster machine! 🙂
Buying to open NFLX 185 August 1 week puts for 3.20.
Still holding August regular expiration NFLX 190.00 puts.
Adding to KSS August week 1 40.00 puts for 0.40 per contract.
Why r u picking on kohls? Low pe and hi yield, guessing amazon is gouging them too. Does look like a rising bearish wedge
Because they are there? 🙂
The Vix is down 4 percent, however the ultra Vix is only down one percent, uvxy. One would expect that to be down more….hmmmm…..to vernes point yesterday, might be a bottom in vix
Yes. The insanity continues. What you are seeing is a grotesque attempt to skew designated value-at-risk for big algo driven funds to try and continue to juice the short volatility-buy-equities trade. They are walking dead men. Just think about it. Who would actually trade as if risk to equities is the lowest in history, when price valuations are just about the highest ever seen! They are obviously attempting to continue the same trade with the Yen. It will be interesting to see where both end up trading today.
I think we are seeing a significant top formation.
Looks like the 2nd Hourly Chart is about to be toast, according to futures at 8am.
Hmmmmnnn…! Foist again?!
Fast wabbit! Slow Doc…
Hmmmnnn..! Foist again?!