
Sideways movement was expected as most likely for Tuesday, but this is not what happened. Upwards movement has made a new all time high, but the session closed red.
Summary: The trend is up. Trading with the trend is the safest approach for your account. Use corrections as an opportunity to join the trend.
The short term target is at 2,490 to 2,491.
New updates to this analysis are in bold.
Last monthly and weekly charts are here. Last historic analysis video is here.
MAIN ELLIOTT WAVE COUNT
WEEKLY CHART
Click chart to enlarge.
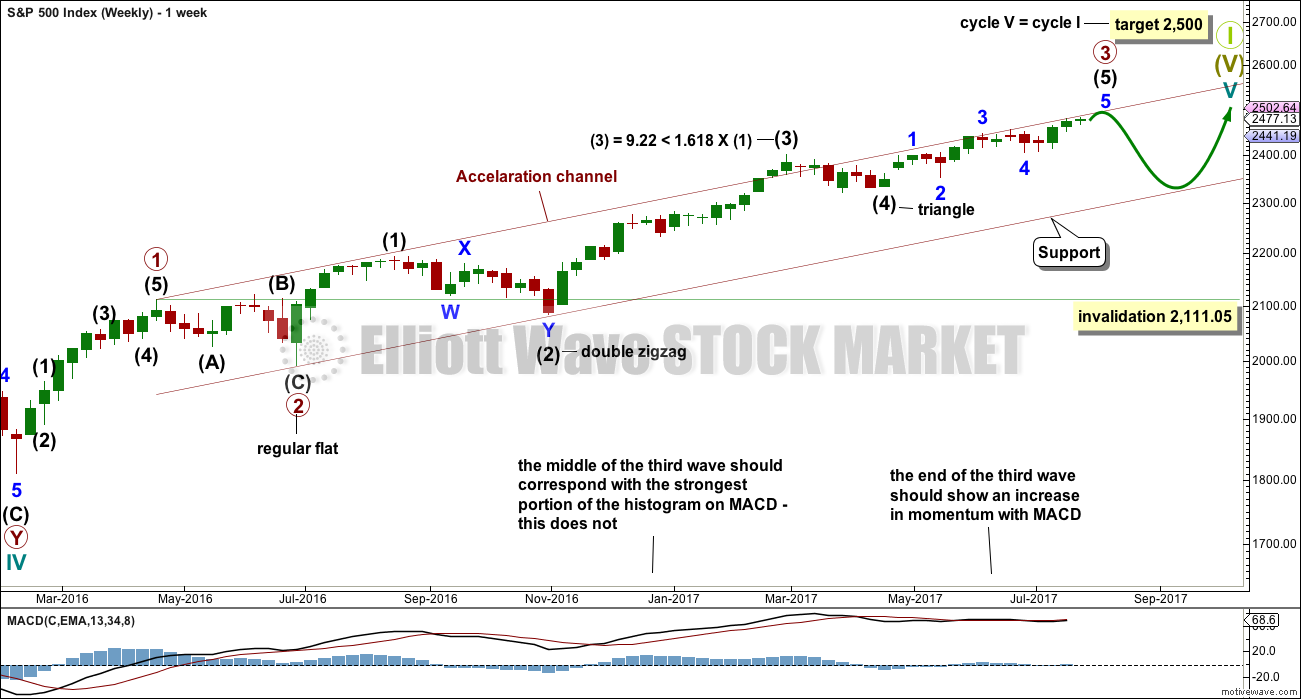
This wave count is identical to the alternate wave count up to the high labelled minor wave 3 within intermediate wave (5) within primary wave 3.
This wave count sees primary wave 3 as incomplete, but close to completion.
Within primary wave 3 impulse, the final wave of intermediate wave (5) is seen as incomplete. Intermediate wave (5) is subdividing as an impulse.
When intermediate wave (5) is complete, then primary wave 3 would be complete. Primary wave 4 may not move into primary wave 1 price territory below 2,111.05.
If price reaches the target at 2,500 and either the structure is incomplete or price keeps rising, then the next target would be the next Fibonacci ratio in the sequence between cycle waves I and V. At 2,926 cycle wave V would reach 1.618 the length of cycle wave I.
DAILY CHART
Click chart to enlarge.
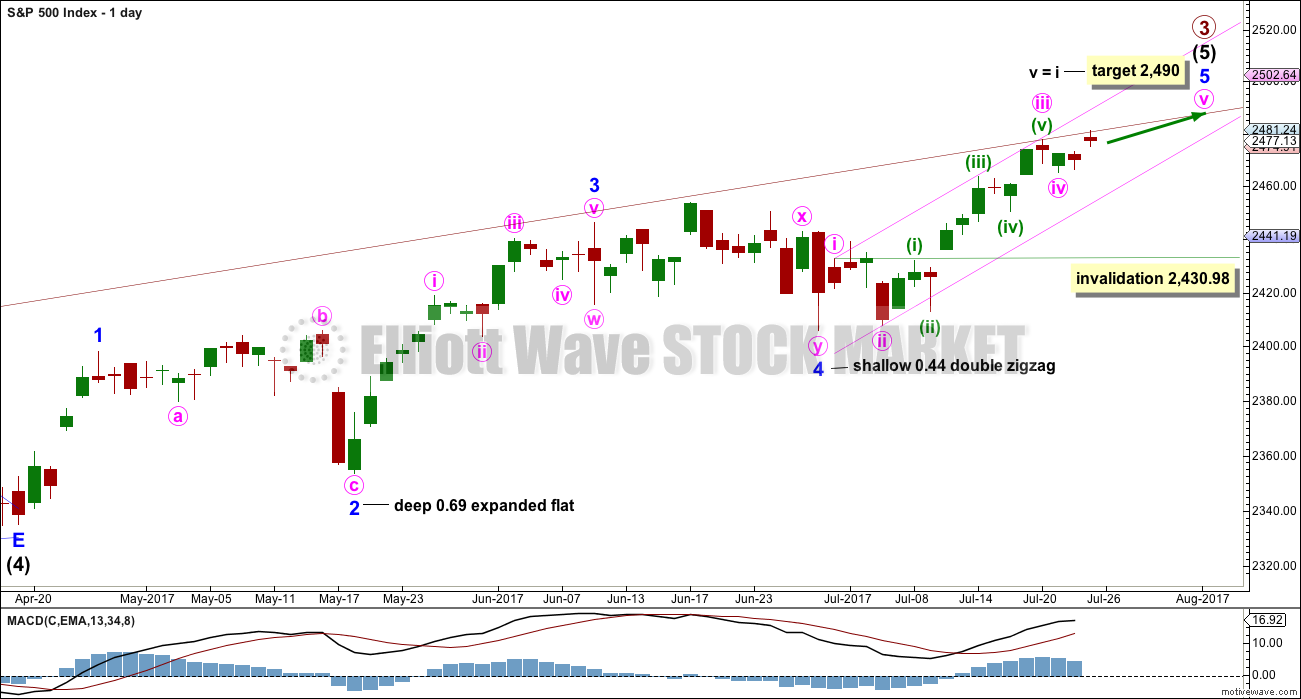
The daily chart shows only the structure of intermediate wave (5); this structure is an impulse.
Within intermediate wave (5), minor waves 1 through to 4 are now complete. The final fifth wave of minor wave 5 is underway. Within minor wave 5, minute wave iv may not move into minute wave i price territory below 2,430.98.
Minor wave 5 is extending. Within minor wave 5, minute waves ii and iv now both show up clearly at the daily chart level. This portion of the wave count has now the right look. It would still look right if minute wave iv continued sideways for another day to two, taking up a bit more time. However, volume does not support this view today. Volume suggests minute wave iv is over.
Within minute wave iii, the subdivisions of minuette waves (ii) and (iv) now look clear on the daily chart.
There is perfect alternation between the deep expanded flat of minor wave 2 and the shallow double zigzag of minor wave 4.
FIRST HOURLY CHART
Click chart to enlarge.
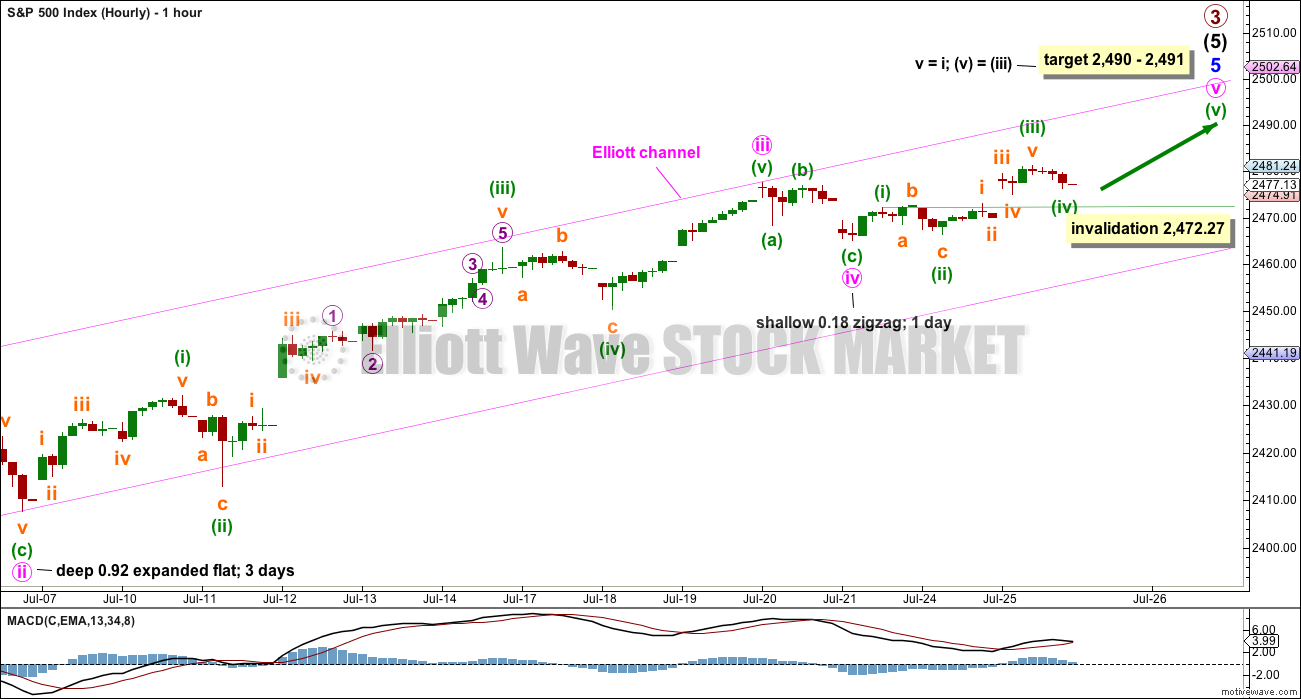
Minor wave 5 may be subdividing as an impulse so far. The middle of the third wave has the strongest upwards momentum. This wave count fits so far with MACD.
If minute wave iv is over as a quick shallow zigzag, then there is perfect alternation between minute waves ii and iv. Zigzags are quicker structures than flats, so the disproportion between them is entirely acceptable.
Minute wave v may be underway and subdividing as an impulse. Within minute wave v, minuette wave (iv) may not move into minuette wave (i) price territory below 2,472.27.
The target is widened to a small 1 point zone calculated at two degrees.
This target may still work with the higher final target at 2,500, but that is now beginning to look less likely. When primary waves 3 and 4 may be over, then the final target for primary wave 5 may be calculated at two degrees with more confidence.
If tomorrow price moves below 2,472.27, then use the second hourly chart below.
SECOND HOURLY CHART
Click chart to enlarge.
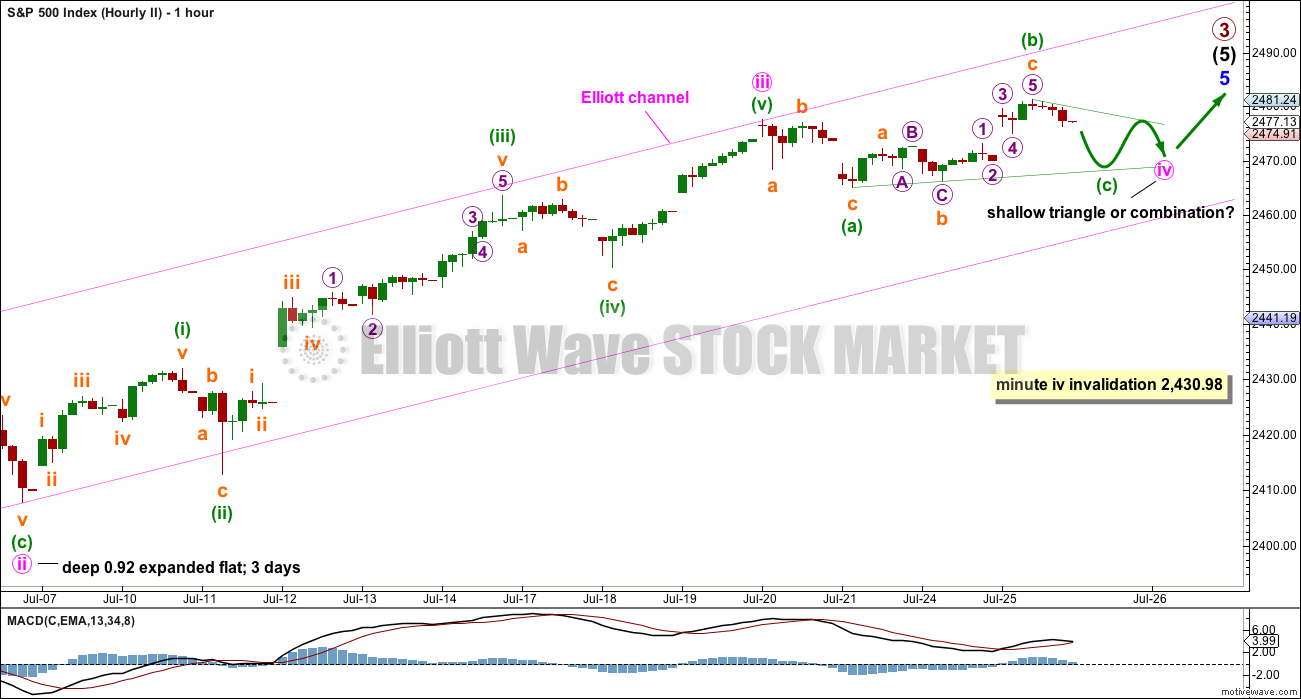
It is also possible that minute wave iv may not be over and may continue further sideways for another one to two days this week.
Minute wave ii was an expanded flat correction, so the least likely structure for minute wave iv would also be an expanded flat as that would offer no alternation in structure. Minute wave iv may be a triangle and still have good alternation, or a combination and still have reasonable alternation.
Both triangles and combinations are sideways movements. Lower degree Elliott wave triangles equate to pennant patterns and combinations equate to flag patterns. Both are reliable continuation patterns and should be used as opportunities to join a larger trend.
A triangle or a combination may include a new high above the start of minute wave iv at 2,477.62. Unfortunately, there is no upper invalidation point for this second hourly wave count, so no upper price point which may add confidence to the first hourly wave count.
At this stage, it still looks possible for minute wave iv to be continuing as a running contracting triangle, but strong volume for today’s upwards movement means this second wave count has a low probability. Triangles should come with declining volume, not increasing.
Minute wave iv may not move into minute wave i price territory below 2,430.98.
The alternate wave count is discarded today based upon a very low probability.
TECHNICAL ANALYSIS
WEEKLY CHART
Click chart to enlarge. Chart courtesy of StockCharts.com.
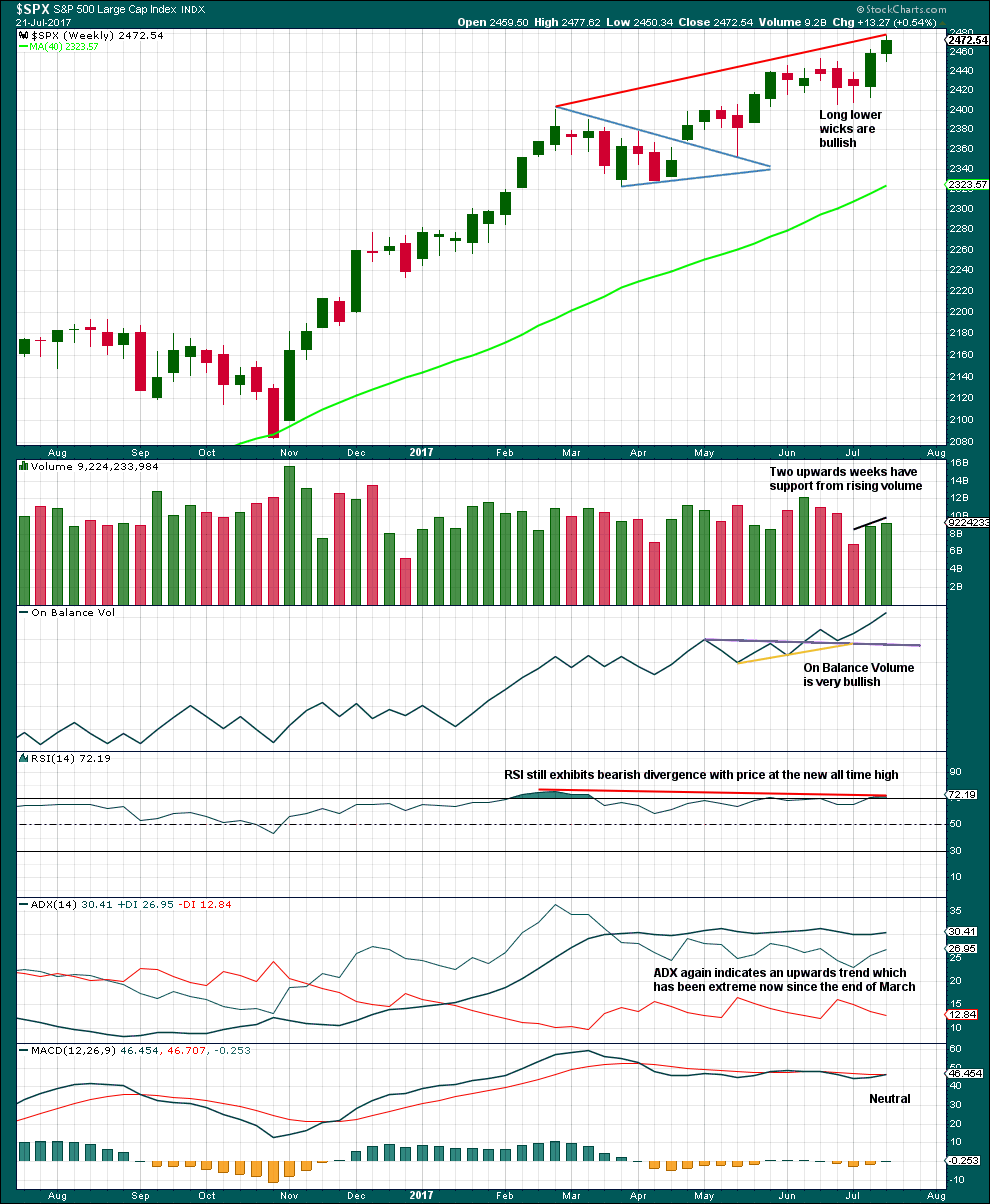
Volume is bullish. On Balance Volume is very bullish.
ADX is extreme and usually at the weekly chart level this quickly leads to a pullback to last two to four weeks. During the current bull market, which began in March 2009, ADX has only reached extreme on four previous occasions. On each of those occasions it was immediately followed by two weeks of downward movement in one case and four weeks of downwards movement in the other three cases.
In all four prior cases the pullback was sufficient to bring ADX down back below the directional lines and below extreme.
This time ADX has remained extreme for 17 weeks although the ADX line has not been rising for the whole time, only fluctuating. This trend is looking very stretched, but at this stage it may be better to rely upon Elliott wave structure and other indicators to tell when the next multi week pullback may begin.
DAILY CHART
Click chart to enlarge. Chart courtesy of StockCharts.com.
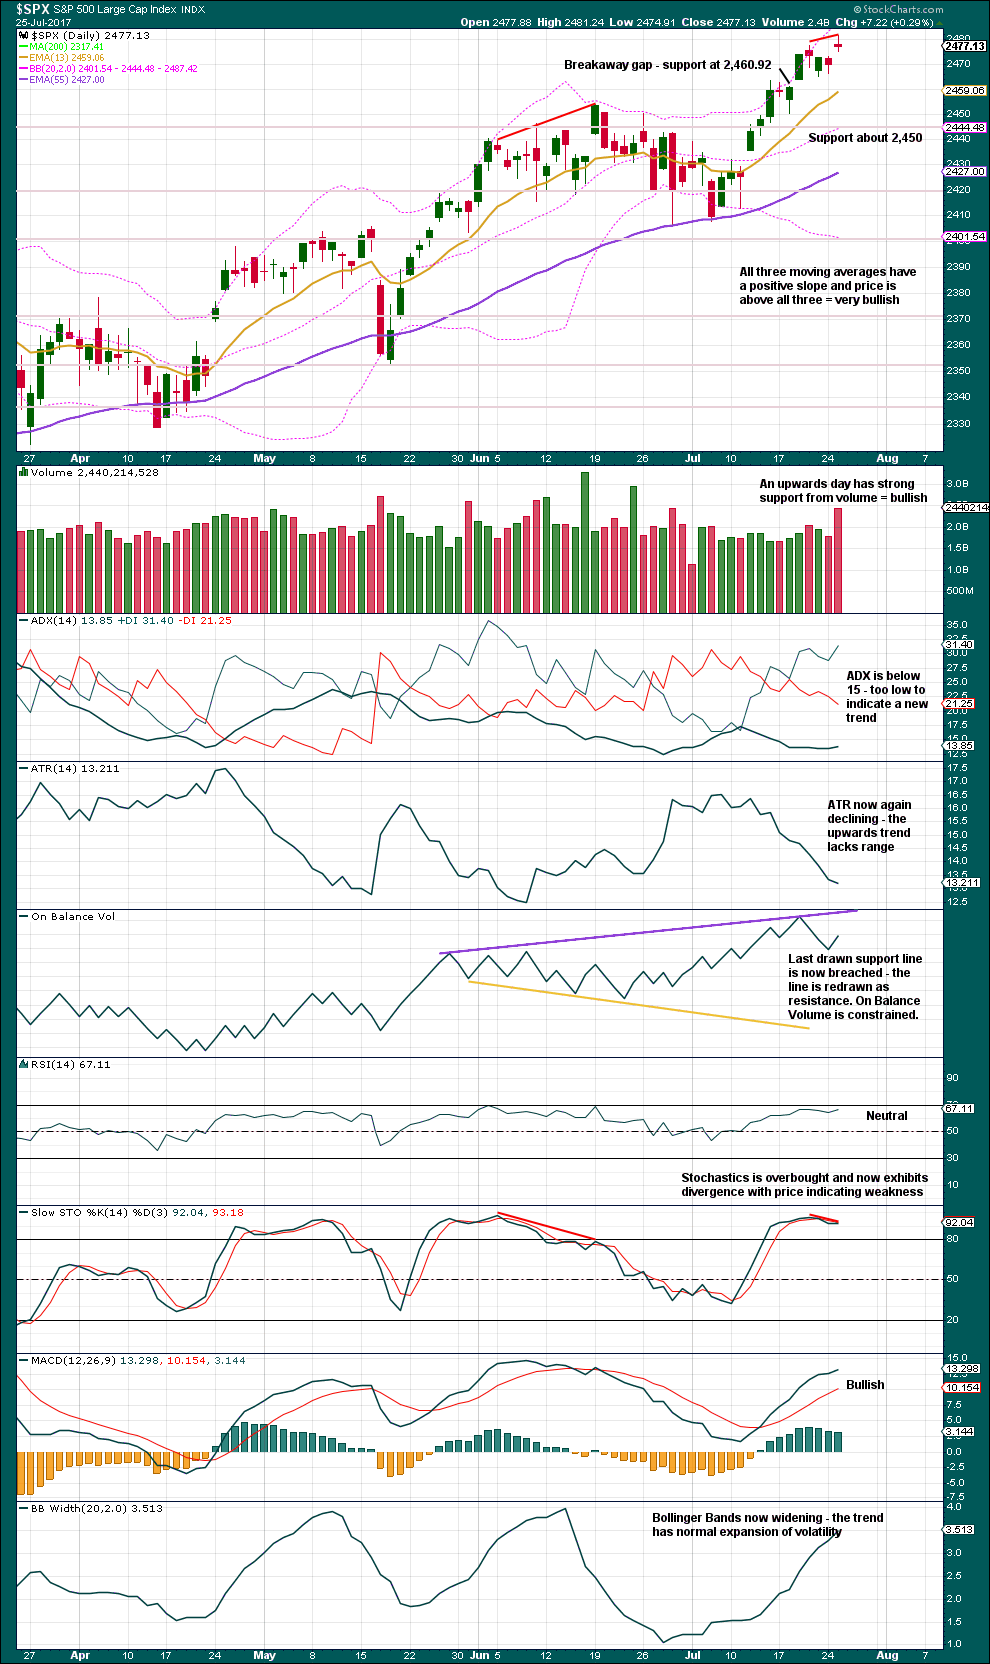
A new all time high today comes with support from volume for upwards movement.
Stochastics is now extreme and exhibits single divergence with price. However, this may continue further to develop into multiple divergence before price finds a final high. If RSI also reaches into overbought, then a trend change may be more likely.
Only ATR is indicating weakness within this upwards movement. Everything else on this chart is bullish.
VOLATILITY – INVERTED VIX CHART
Click chart to enlarge. Chart courtesy of StockCharts.com.
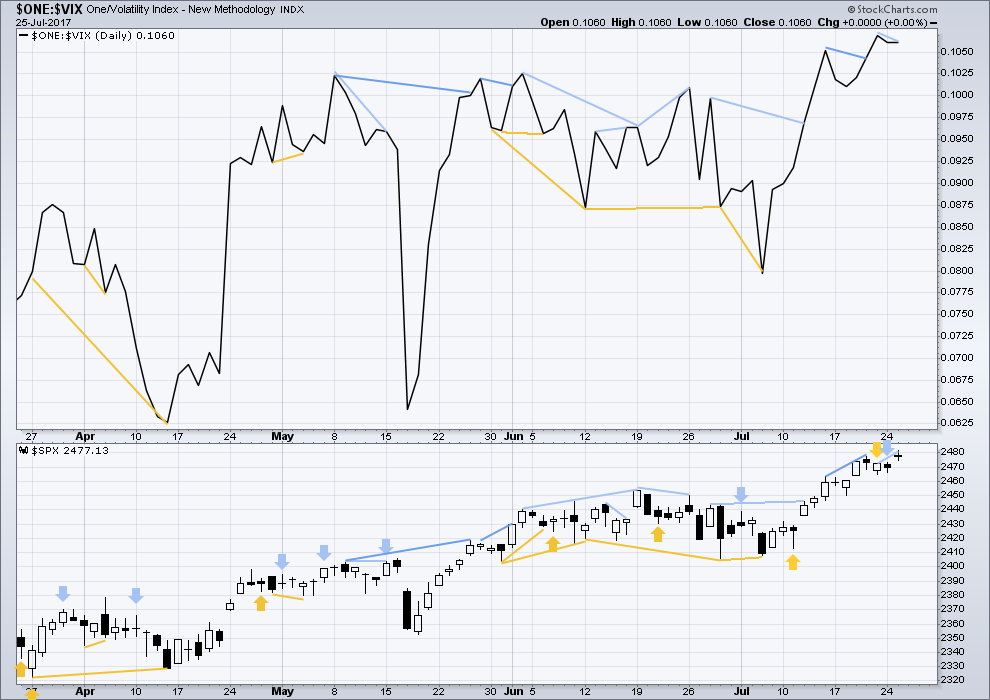
Normally, volatility should decline as price moves higher and increase as price moves lower. This means that normally inverted VIX should move in the same direction as price.
Bearish divergence noted in last analysis has now been followed by an upwards day. It is considered to have failed.
There is new short term bearish divergence today between inverted VIX and price: price has made a new all time high, but inverted VIX has not. This indicates that upwards movement today did not come with a corresponding decline in volatility; there is weakness today within upwards movement from price, so it may be followed by one or two downwards days to be resolved.
BREADTH – AD LINE
Click chart to enlarge. Chart courtesy of StockCharts.com.
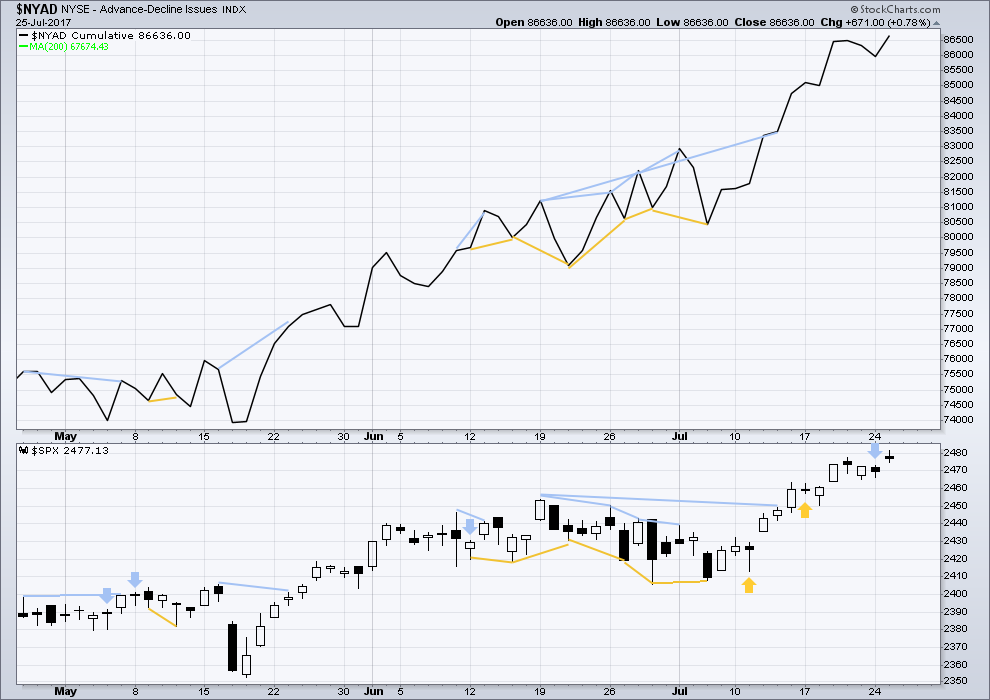
With the last all time high for price, the AD line also made a new all time high. Up to the last high for price there was support from rising market breadth.
There is normally 4-6 months divergence between price and market breadth prior to a full fledged bear market. This has been so for all major bear markets within the last 90 odd years. With no divergence yet at this point, any decline in price should be expected to be a pullback within an ongoing bull market and not necessarily the start of a bear market.
Bearish divergence noted in last analysis has now been followed by an upwards day. It is considered to have failed. There is no new divergence today between price and market breadth; the new all time high for price is matched by a new all time high for the AD line.
Lowry’s measures of internal market strength and health continue to show a healthy bull market. This week has seen a further increase in internal health of the market, so we may have some confidence that this bull market shall continue.
Historically, almost every bear market is preceded by at least 4-6 months of divergence with price and market breadth. There is no divergence at all at this time. This strongly suggests this old bull market has at least 4-6 months to continue, and very possibly longer.
DOW THEORY
The S&P500, DJIA and DJT have all made new all time highs.
Nasdaq has made a new all time high. Modified Dow Theory (adding in technology as a barometer of our modern economy) sees all indices confirming the ongoing bull market.
The following lows need to be exceeded for Dow Theory to confirm the end of the bull market and a change to a bear market:
DJIA: 17,883.56.
DJT: 7,029.41.
S&P500: 2,083.79.
Nasdaq: 5,034.41.
Charts showing each prior major swing low used for Dow Theory are here.
Published @ 11:55 p.m. EST.
Updated hourly chart, the first one:
a complete zigzag now for minuette (iv)?
if my labelling of the little subdivisions within minor 5 is correct, then a high is now close by
but the trend is still up folks
while price remains within the pink Elliott channel assume the trend remains up
I wonder if this will end with Apple reporting… (oddly enough reporting as last of the FAANG…. which FB usually takes as crown)
Behold the insanity!
New all time low in VIX!
The desperation has reached a feverish pitch people.
I never use margin. I am for the very first time seriously considering it! 🙂
That’s just crazy. CBOE doesn’t even allow VIX calls below 9.
Gravestone doji in DJI. Of course a lot can change thanks to Yamerin’ Yellen! 🙂
I suspect we will get the typical head-fake in the wrong direction that lasts for a few minutes before the real direction gets going, in this case a final spike up….
Fantastic VIX Hammer, and DOJI combo!
Drool!
Reloading KSS puts. August week 1 40.00 strikes at 0.85 per contract. Holding last half of 40.00 strike puts expiring this week – a round about way of lowering cost basis on last half of puts expiring this week….
It is not very often that the market enters into conditions so extreme that certain types of trades offer an advantage that borders on the ludicrous. It is indeed strange that the market should offer such opportunities but nevertheless it occasionally does. Trend following traders are now holding a net short volatility position of 140K contracts, close to an all time record. There are other not- so- obvious ways in which traders are also massively short volatility. When will they unwind? No one can say for certain but unwind they will. It is truly amazing that anyone would remain in a short position after the historic low posted yesterday, but remain they have. Such is the nature of manic behaviour. There is an inexplicable conviction that the trend will continue indefinitely. Hard to believe is it not? 🙂
That unwind is not going to be pretty. For another fun exercise, adjust SPX earnings back to GAAP from “adjusted” and see how overvalued it is. I wouldn’t rule out a surprise from Yellen today.
Yep. The extent to which market evaluation is disconnected from real economic growth is truly stunning. It almost seems inconceivable that we are trading at these levels yet here we are. What really makes you shake your head in wonder are all the folk who try to portray this as perfectly normal…”nothing to see here…move along!” 🙂
KSS is hallucinating again…you know what to do…lol!
Crude oil getting close to my 49 target for reloading shorts in medium term trading account. I like the ETF DRIP for a short side trade.
Modified order to sell half at 1.00 even and filled immediately. Holding remaining half for 1.10 fill…
Opening sell to close order on KSS 40 strike puts for limit price of 1.10.
Ordrer should fill today…
I am quite curious about how other members plan on trading the upcoming correction. I think option traders look at entry into positions a bit differently from traders who do not use options. You want to get positioned in options ahead of a significant trend change when volatility is low since premiums skyrocket when VIX is moving higher. The precision of Lara’s wave counts and price targets is an option trader’s dream as it allows timing entries with high confidence as invalidation points are always clear.
We have just witnessed a few truly historic events with regard to volatility.
This morning’s low at 9.04 took out a multi-decade low of 9.31 set on December 22,1993 (the all time low was set 8 days later at 8.89). We could go lower.
The unique record set today was that it was the eighth consecutive close under ten for VIX. This has never happened since the VIX was created.
Few people are going to pay attention to this situation but I find it fascinating as one who likes trading volatility. The current situation will inevitably result in a reversion to the mean commensurate with the severity of the departure from the mean, and we can see by several measures it is historic.
I am making a very atypical trade as a result in that I will be trading only volatility for the upcoming correction. I will be making the trade via SVXY, (ProShares Short VIX Short-Term Futures ETF), which has now posted a new all time high for eight days in a row after a recent 2 for 1 split. This will probably be the easiest trade I have ever made. I bought the September 100 strike puts today for 10.00 even, and will do nothing for the next several weeks but sit and wait. No day trades, no swing trades, no credit spreads….nada!
I will exit the trade when either I see a capitulation spike in VIX (generally sports a long upper wick above the upper BB) or Lara declares that P4 is done, or I have a 10X return on the trade, whichever comes first! This ought to be fun! 🙂
Wouldn’t a 10 bagger require svxy to go to zero?
Not necessarily. Once the downturn is confirmed, you simply roll the position into nearer dated contracts. The 10X trade is executed over a day or two at the most and has to be done with absolute precision. A contingency order is the most efficient way to do it.
This contingency order is critical in trading the short side of VIX AFTER the spike.
Looks like a good risk, reward….stocks and macd look like they are rolling over and it has been up for a week straight or so. See if the market spikes up after yellen and makes its final wave wave 3 hibefore going down.
Monthly MACD has not been this extreme since October 1999 and October 2007…
“History doesn’t repeat itself, but it often rhymes”
Mr. Clemens is indeed correct!! 🙂
It seems to me that if the first hourly chart is correct, minuette V will need to end very quickly (perhaps before the end of the week), or else the current wave count is wrong. Minuette I lasted just 4 hours and minuette III just 10 hours. That’s also reflected in the daily chart… minute I lasted barely a day. When is the absolute latest we could expect primary IV to start before the current wave count must be reset?
minuette (iv) could be a triangle, which is a more time consuming structure than flats.
we could move the degree of labelling within minor 5 all down one degree… or my labelling of the little subdivisions within it could be wrong…
my bottom line ATM for that wave count is the channel. when that’s breached by downwards movement I’ll consider P3 over and P4 begun
here I am.. hee hee
Been hidin’ have yer Doc?