
Upwards movement has unfolded as expected.
Summary: An upwards breakout is expected. The profit target is at 2,478.
New updates to this analysis are in bold.
Last monthly and weekly charts are here. Last historic analysis video is here.
MAIN ELLIOTT WAVE COUNT
WEEKLY CHART
Click chart to enlarge.
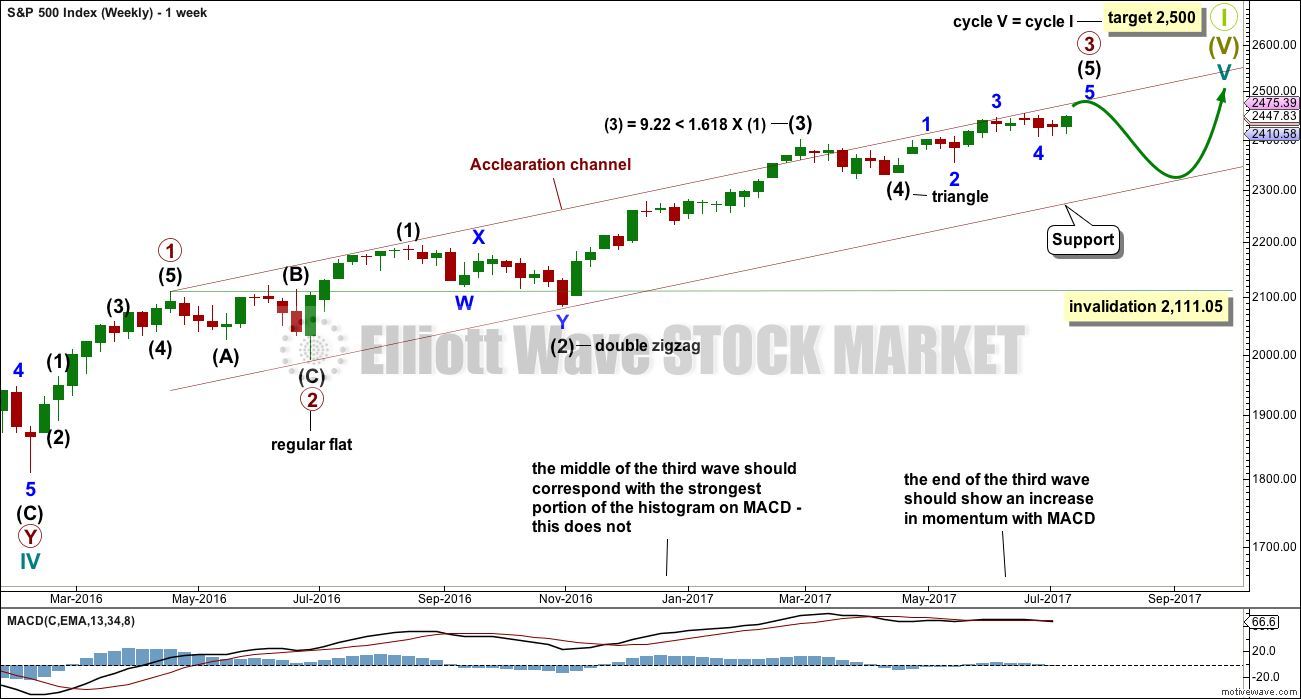
This wave count is identical to the alternate wave count up to the high labelled minor wave 3 within intermediate wave (5) within primary wave 3.
This alternate wave count sees primary wave 3 as incomplete, but close to completion.
Within primary wave 3 impulse, the final wave of intermediate wave (5) is seen as incomplete. Intermediate wave (5) is subdividing as an impulse.
When intermediate wave (5) is complete, then primary wave 3 would be complete. Primary wave 4 may not move into primary wave 1 price territory below 2,111.05.
DAILY CHART
Click chart to enlarge.
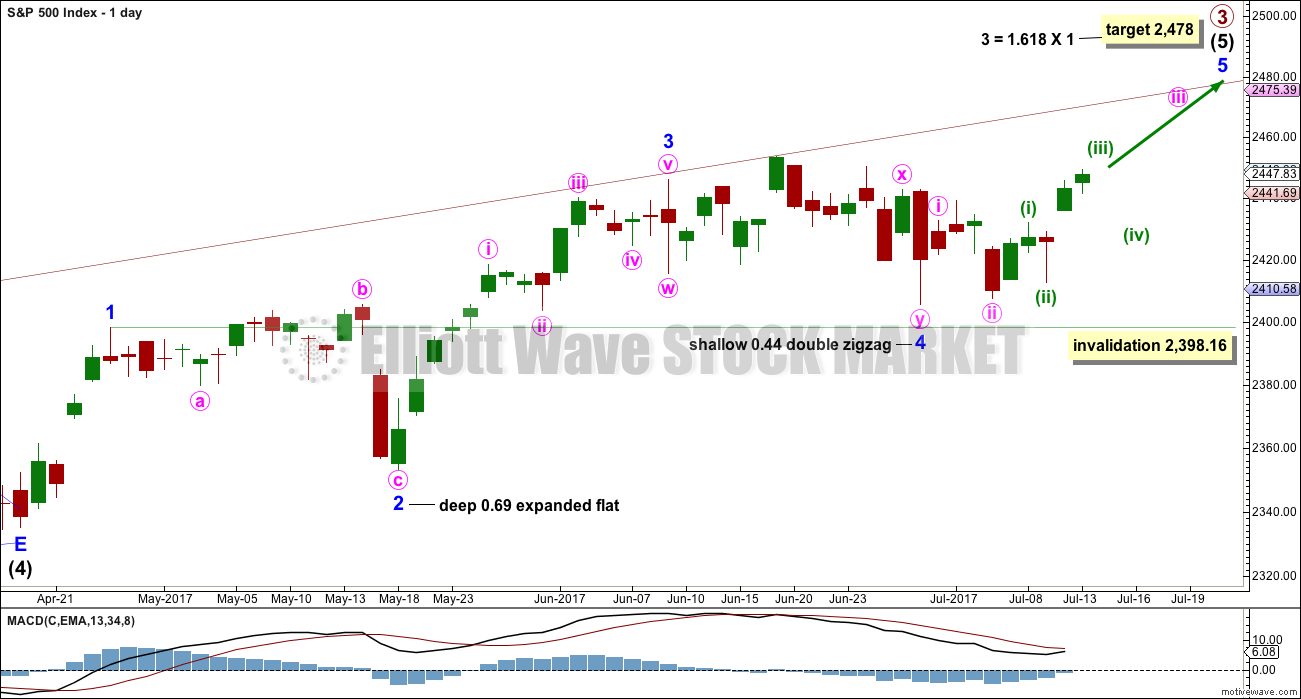
The daily chart shows only the structure of intermediate wave (5); this structure is an impulse.
Within intermediate wave (5), the correction of minor wave 4 may not move into minor wave 1 price territory below 2,398.16.
There is perfect alternation between the deep expanded flat of minor wave 2 and the shallow double zigzag of minor wave 4.
HOURLY CHART
Click chart to enlarge.
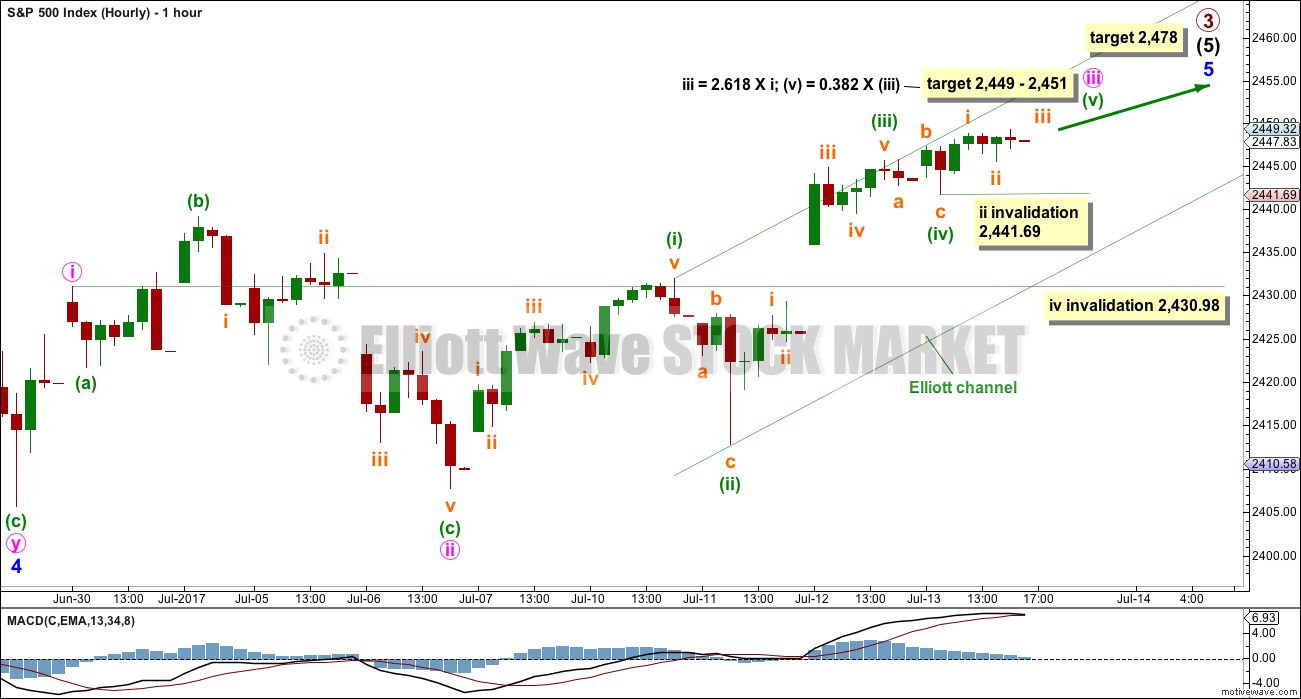
Minor wave 5 must subdivide as a five wave motive structure, either an impulse (much more likely) or an ending diagonal (less likely). Let us assume the more likely impulse while price remains above 2,430.98. If price moves below 2,430.98, then we may consider the less likely diagonal scenario.
Minute wave iii has moved beyond the end of minute wave i within the impulse, meeting a core Elliott wave rule. When minute wave iii is complete, then minute wave iv may not move into minute wave i price territory below 2,430.98.
Minute wave iii may be still incomplete. A target is now calculated for it. Minute wave iii may only subdivide as a simple impulse.
Within the impulse of minute wave iii, there is perfect alternation between a deep zigzag correction for minuette wave (ii) and a shallow expanded flat for minuette wave (iv). There is no Fibonacci ratio between minuette waves (i) and (iii). This means it should be more likely that minuette wave (v) will exhibit a Fibonacci ratio to either of minuette waves (i) or (iii). The target is widened to a small zone calculated at two degrees.
Minute wave ii shows up on the daily chart lasting three days. Minute wave iv may also show up on the daily chart, so expect it to last about one to four sessions. This would give good proportion between minute waves ii and iv, and the wave count would have the right look at the daily chart level.
ALTERNATE ELLIOTT WAVE COUNT
WEEKLY CHART
Click chart to enlarge.
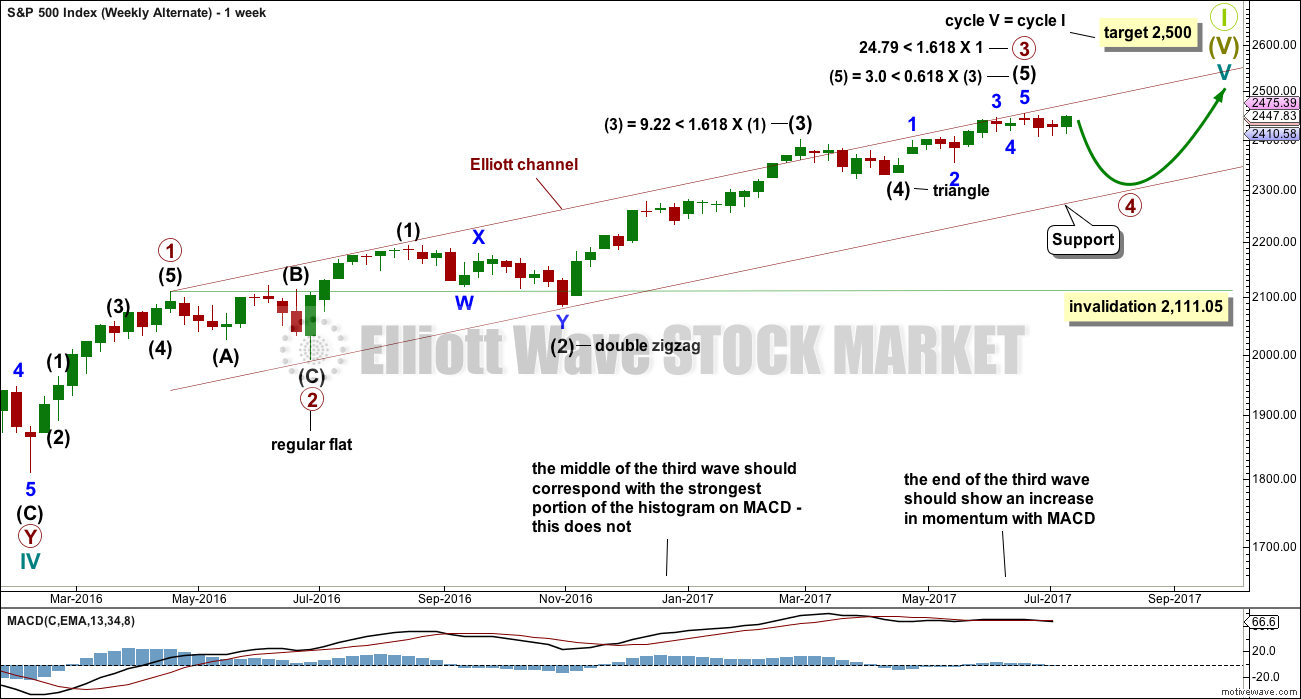
Primary wave 4 may now be underway.
Primary wave 2 was a regular flat correction that lasted 10 weeks. Given the guideline of alternation, primary wave 4 may most likely be a single or multiple zigzag or a triangle and may last about a Fibonacci eight or thirteen weeks, so that the wave count has good proportion and the right look. So far it has lasted three weeks. This is far too brief to be considered complete or even close to complete.
Primary wave 4 may end within the price territory of the fourth wave of one lesser degree. Intermediate wave (4) has its range from 2,400.98 to 2,322.35.
Primary wave 4 may not move into primary wave 1 price territory below 2,111.05.
DAILY CHART
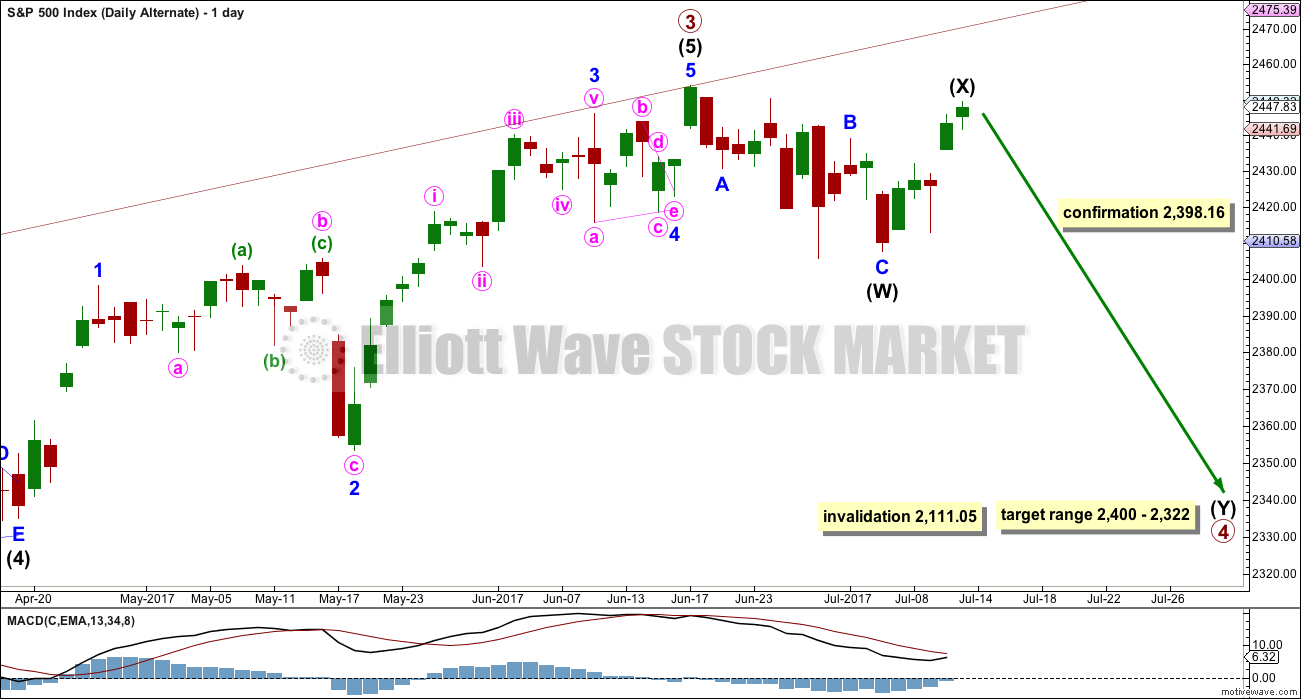
Click chart to enlarge.
Primary wave 4 may be unfolding as a double zigzag, or a double combination. A double zigzag would offer better alternation with the flat of primary wave 2, but a combination would still offer some alternation.
Labelling within primary wave 4 is today changed. The first structure in a double may be complete.
HOURLY CHART
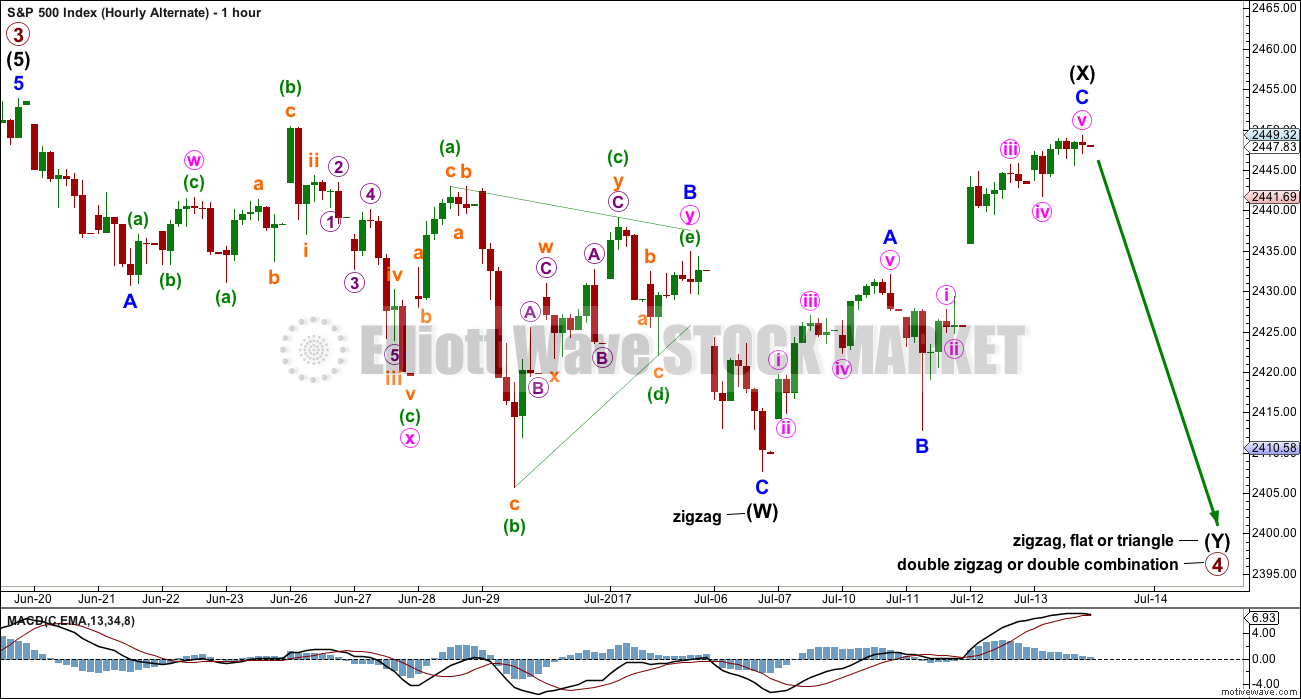
Click chart to enlarge.
The first structure in a possible double is labelled as a zigzag for intermediate wave (W), subdividing 5-3-5.
The double is joined by a now possibly complete three in the opposite direction, a zigzag labelled intermediate wave (X).
The second structure in the multiple may be a zigzag for a double zigzag (most likely), or a flat or triangle for a double combination (still possible, but less likely). It would be labelled intermediate wave (Y) and should last about two weeks.
Within double zigzags, their X waves are normally brief and shallow. So far intermediate wave (X) is neither, but primary wave 4 may still be a double zigzag.
Within double combinations, their X waves are normally deep as this one is. There is no rule stating the limit to X waves within double combinations, and they may make new price extremes beyond the start of wave W or Y. Here, intermediate wave (X) may make a new high above 2,453.82 and this wave count will remain valid. Unfortunately, there is no upper invalidation point that would see this wave count discarded. It will be discarded based upon structure and classic technical analysis, if that is the case.
TECHNICAL ANALYSIS
WEEKLY CHART
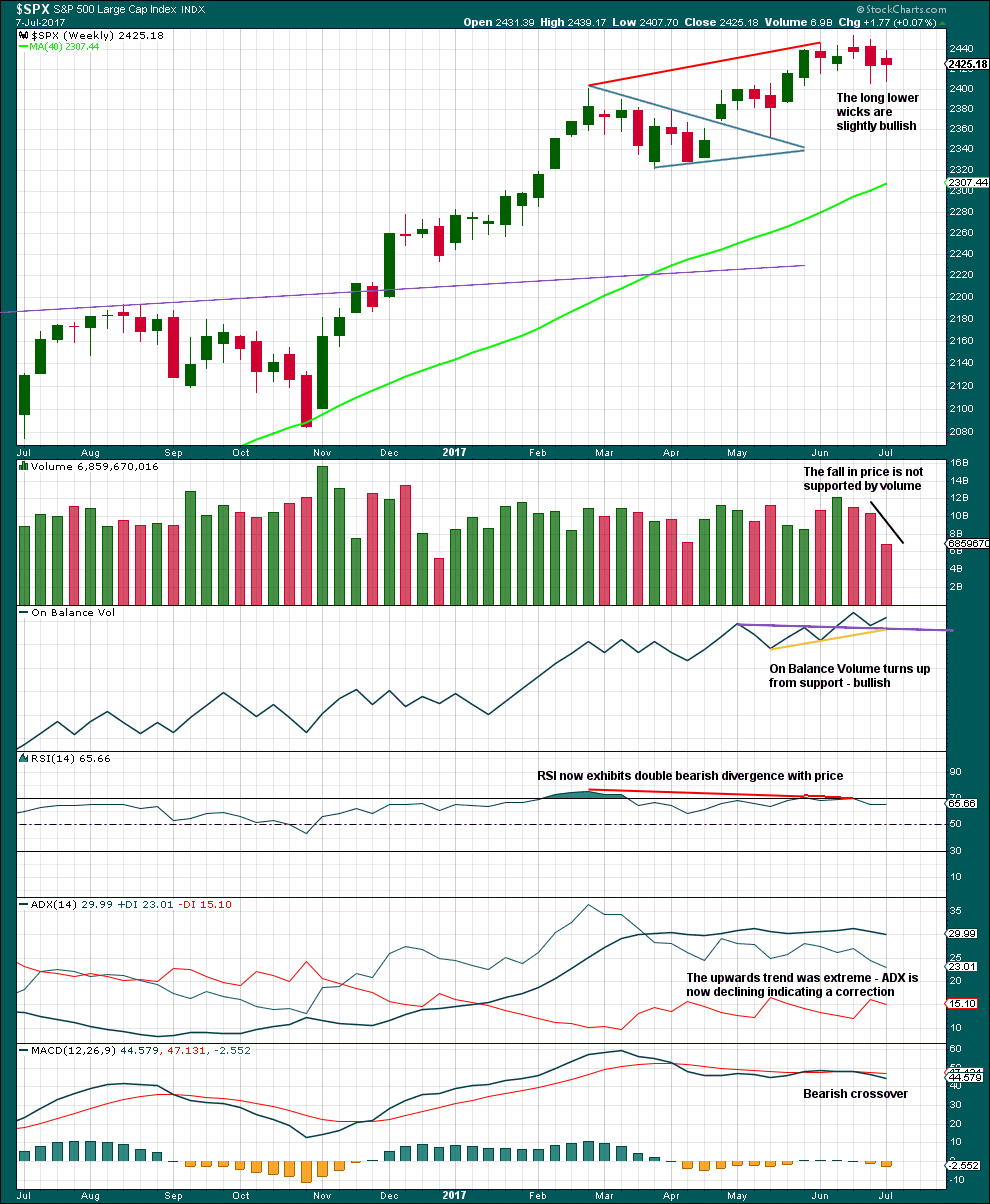
Click chart to enlarge. Chart courtesy of StockCharts.com.
Volume, candlesticks and On Balance Volume are bullish. This does not support the main Elliott wave count.
ADX, RSI and MACD still are bearish, and point to lower prices in the next few weeks.
DAILY CHART
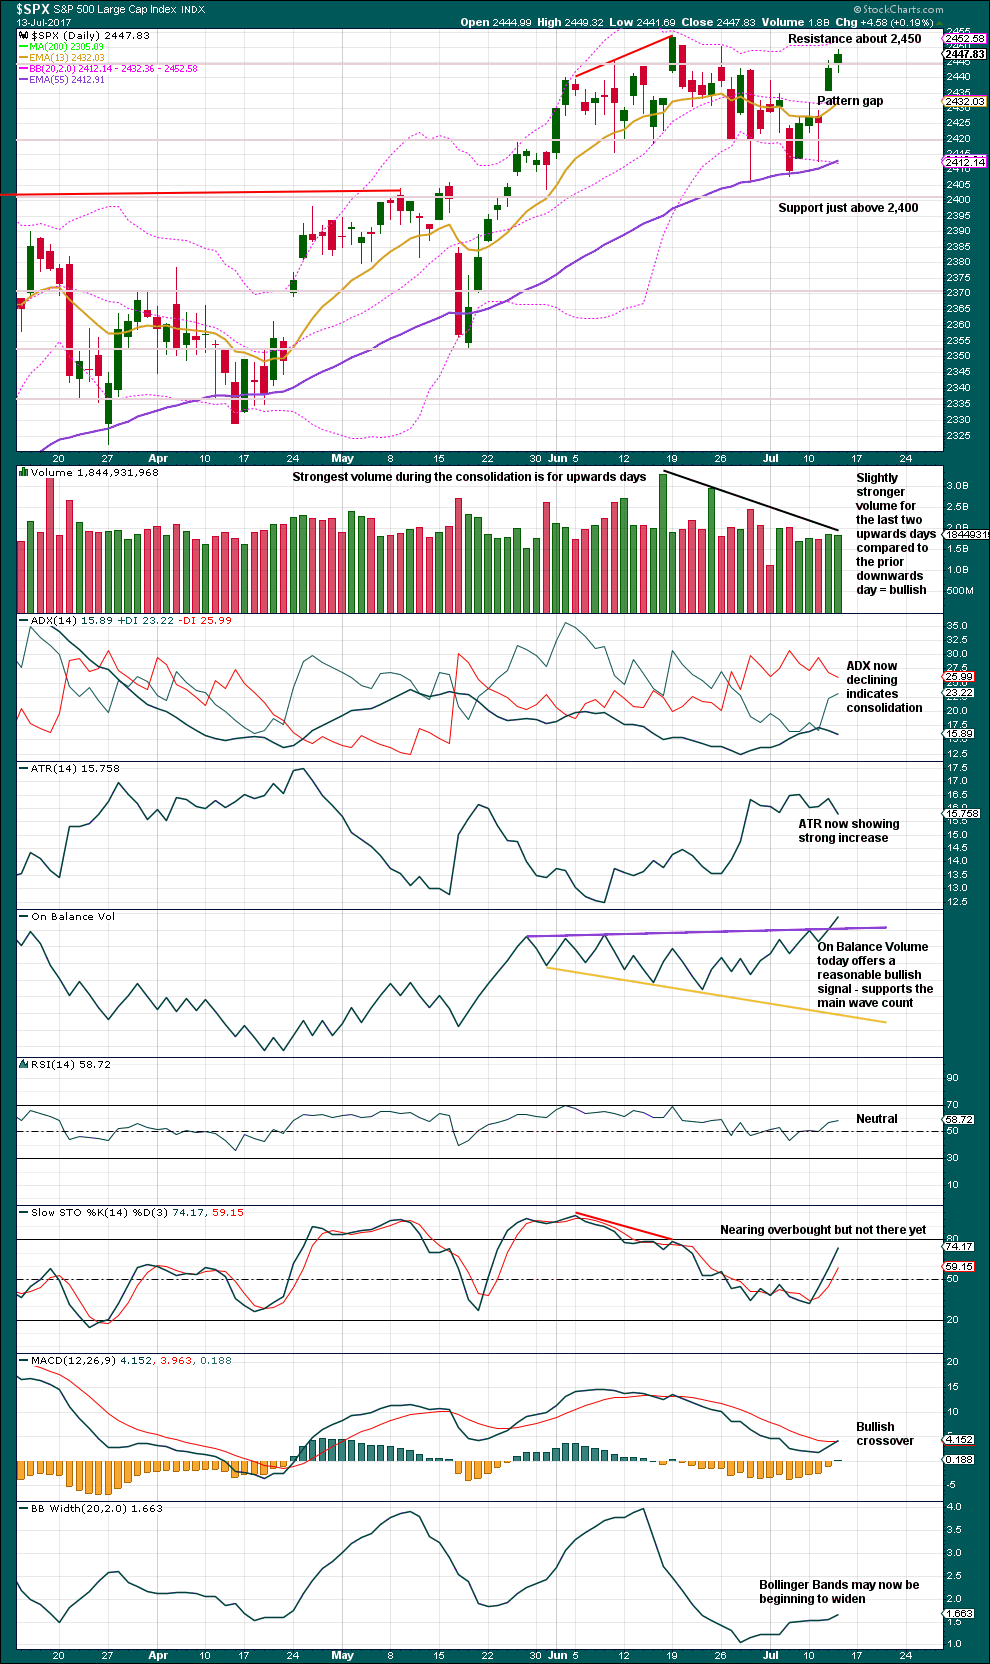
Click chart to enlarge. Chart courtesy of StockCharts.com.
Stepping back and taking a very simple approach to current market conditions sees a very obvious consolidation continuing. This view is supported by now clearly declining volume as price moves sideways.
During the consolidation, it is upwards days that have strongest volume, suggesting again another upwards breakout when the consolidation is complete. More long lower wicks than long upper wicks also looks like this view is more likely correct.
A slightly longer lower wick on today’s candlestick is slightly bullish.
Give weight to the signal today from On Balance Volume. In conjunction with volume, we should have reasonable confidence now that price looks likely to breakout upwards from this consolidation.
VOLATILITY – INVERTED VIX CHART
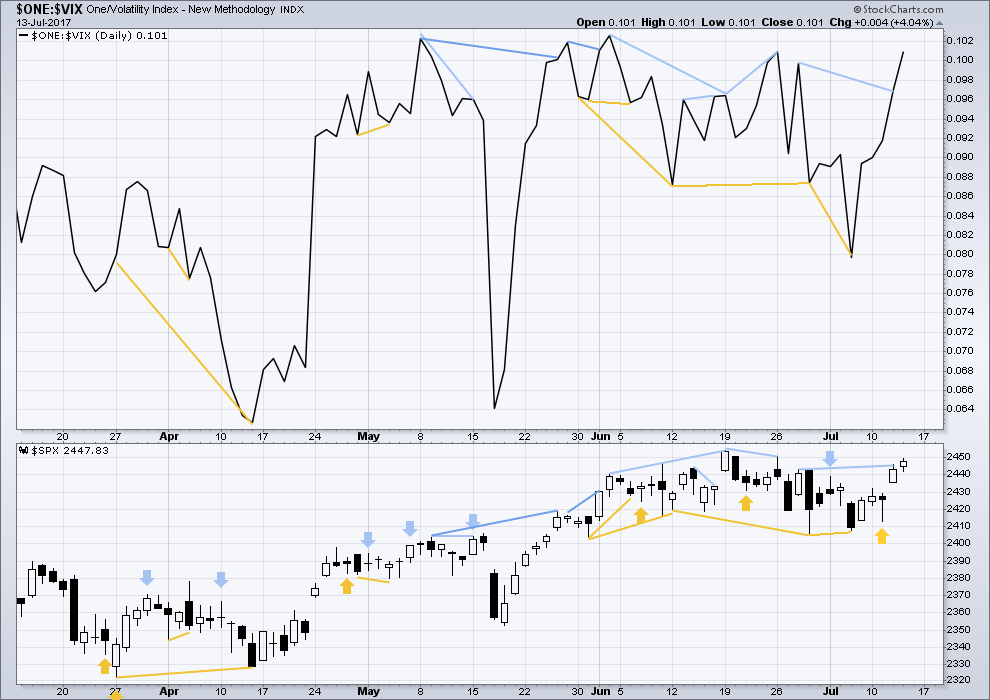
Click chart to enlarge. Chart courtesy of StockCharts.com.
Normally, volatility should decline as price moves higher and increase as price moves lower. This means that normally inverted VIX should move in the same direction as price.
Bearish divergence noted yesterday between price and inverted VIX has now disappeared. It is considered to have failed.
BREADTH – AD LINE
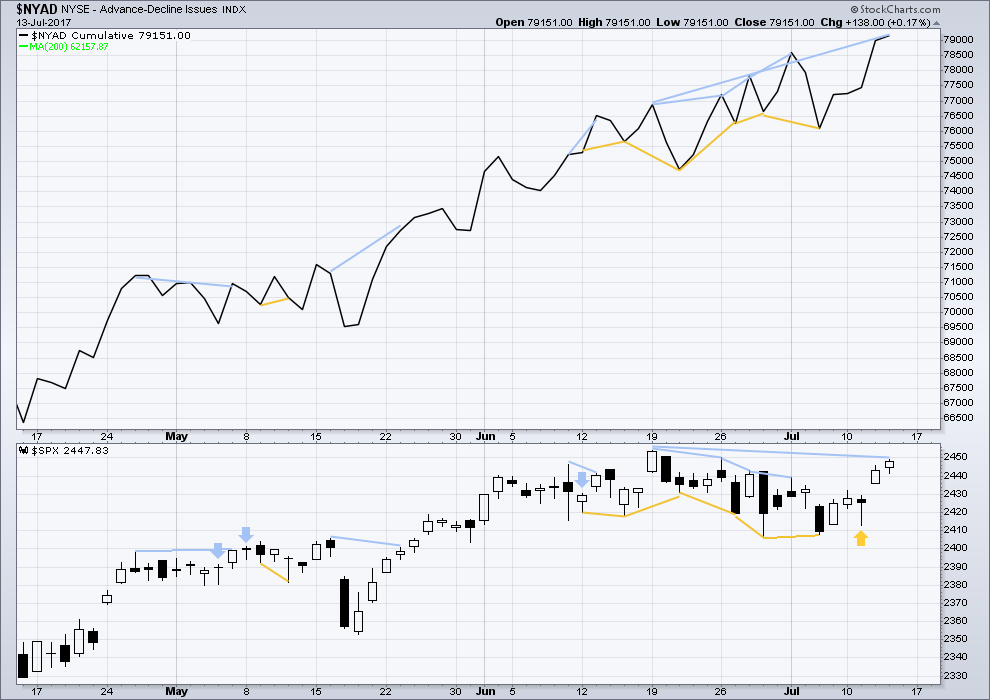
Click chart to enlarge. Chart courtesy of StockCharts.com.
With the last all time high for price, the AD line also made a new all time high. Up to the last high for price there was support from rising market breadth.
There is normally 4-6 months divergence between price and market breadth prior to a full fledged bear market. This has been so for all major bear markets within the last 90 odd years. With no divergence yet at this point, any decline in price should be expected to be a pullback within an ongoing bull market and not necessarily the start of a bear market.
Bearish divergence noted yesterday between price and the AD line continues today, but is now much weaker. Because it is now fairly weak it should not be given much weight at all. It may disappear shortly.
The mid caps and small caps have made new all time highs along with recent last all time high for large caps. The rise in price is seen across the range of the market, so it has internal strength.
While the market has moved sideways for about a month now, it has been accompanied by new highs in market breadth and improving underlying health as measured by Lowry’s buying power and selling pressure. This sideways correction should be expected to be a normal consolidation within an ongoing healthy bull market.
Historically, almost every bear market is preceded by at least 4-6 months of divergence with price and market breadth. There is no divergence at all at this time. This strongly suggests this old bull market has at least 4-6 months to continue, and very possibly longer.
DOW THEORY
The DJT today has finally made a new all time high. This confirms a continuation of the bull market.
Nasdaq still has not made a new all time high. Modified Dow Theory (adding in technology as a barometer of our modern economy) indicates some weakness at this time within the bull market, but there is zero indication that it is over.
The following lows need to be exceeded for Dow Theory to confirm the end of the bull market and a change to a bear market:
DJIA: 17,883.56.
DJT: 7,029.41.
S&P500: 2,083.79.
Nasdaq: 5,034.41.
Charts showing each prior major swing low used for Dow Theory are here.
This analysis is published @ 10:25 p.m. EST.
We have the upwards breakout that was expected. Volume was great in correctly anticipating it. I hope members have managed to take advantage of this opportunity.
The trend continues and this old bull market still has internal strength and some health. There is weakness for sure, but not enough yet to call it over, not by a reasonable shot anyway. I think it’s looking like it may not end this October, it may limp into next year. Maybe March now?
Anyway, the target for minute iii was inadequate. The next Fibonacci ratio in the series is used for a new target.
Another great example of how paying attention to price targets can help in deciding how long to hold a position. EW counts that are accurate are becoming ever more critical in trading these markets as we are not getting any clues whatsoever from the futures market or from trying to gauge intra-day momentum.
Having said that, I still left some money on the table today as I exited my positions a bit early in anticipation of a fourth wave; I had to be a bit more cautious as I had options expiring today. All around new ATH confirm the strength of this bull market and the upcoming correction will be an opportunity to ride the last wave up. I suspect that this is becoming ever clearer to even the casual observer and I am starting to see how we could have in the making quite a spectacular final wave up.
Lara are we still keeping the same target for the end of primary three?
I was assuming that this would have changed since minute three ended up being longer than expected,
Have a great week-end everyone!
I’ll be reevaluating that target when I do this end of week analysis.
Verne, are you referring to minute III on the hourly chart? Which previously had a target of 2,449-2,551? Do you think the shooting star doji during the last hour is the beginning of minute IV? Also what is the price target for IV? Will we fill the gap to 2430 or is it likely to be a more shallow dip?
Sorry for all the questions. I am new to this type of analysis.
Yes Andrew. I was a bit concerned we could get a completion of minute three and start of minute four during the session and since my SPY calls were expiring today I bailed early. We did get a reversal into the close and it does look as if minute three ended. Price in the indices has also now penetrated the upper B bands so that is also a cautionary not regarding how much more upside remains in this wave. We may get two quick fourth and fifth waves early next week – unless of course we see a massive plunge in futures Sunday night! 🙂
BTW, the target for minute four is any price point above minute 1 around 2430…usually a fib retracement…it could also go back to the area of minuette four, looks like around 2440
I’m a bit confused by your comment that the bull might last to next year. I see the target for the final wave up is 2500, we are 40 points from that. Are you going to change your ath target?
Also I’m seeing a lot of calls for Hindenburg omens. This is usually when all time highs and lows are over 2.2 percent or so of the NYSE along with some other criteria. If you state that there is a Hindenburg omen (not you Lara) could you please provide the calculation. Thank you.
Hi Dermot.
I posted a link to a pretty good article on Hindenburg Omens awhile back and you can find good explanations of the Omen many places on the web. In addition to the percentage of NYSE new 52 week highs and lows, the McClelland Oscillator also must be negative. Robert McHugh checks for this indicator at the close of each trading day so you can also check his site for any mention. You do not have to be a subscriber to read his summary and guest articles.
https://www.technicalindicatorindex.com/
If primary 3 ends before 2,500, then primary 4 may last a few months and take price comfortably lower.
That would leave room for primary 5 to have a reasonable length, and move beyond the end of 3 to avoid a truncation, but still end close to 2,500.
Forming a long slow rounded top.
That’s the expectation anyway.
That makes perfect sense. I think the next correction for primary four is likely to be deep and sharp enough to change majority sentiment ahead of the final wave up. In fact I think it is going to convince a lot of folk that a top is in.
Bull markets tend to buck riders off, and that particular feature has been glaringly absent for much of this bull run, due no doubt to it primarily being an artifact of central bank liquidity, as opposed to true economic progress.
I was surprised to see a few EW analysts can still see a possible B wave of a bigger fourth wave as well as Lara’s count of an impulse up underway.
McHugh abandoned the idea of an impending C wave down for a bigger fourth wave a week ago. Any thoughts?
Verne, sorry don’t have any information regarding the impending C wave but sentiment is flying right now. The greed is really setting in. We could have more to go next week but a decline is absolutely on the table in the near future. Short interest is at the lowest not seen in 10 years just before that significant correction. What I really wanted to say is to thank you for your contribution here. I know Lara is very busy and all your analysis helps a great deal. Many thanks Verne. Also, if you look at VIX it spikes every 3 weeks consistently. So, I bought calls today and probably early but we have not been down here at the price VIX printed today since 1993. Went out to August, near the money. So I expect a correction and the higher we go, IMHO the deeper the correction. Possibly a crash. However, what ever you get, take the money and run. What I plan on. Always the plan. Especially options. Run !!!
My first thought on that is they’ve be trying to see what looks like a good five up, as a three. I guess it could be a double zigzag….
I note with interest in the analysis that a new high for X beyond the start of W does not invalidate the alternate wave count showing a completed primary three. I guess we will know it is still in play if we get a strong decline beginning next week out the gates. Futures should be probative.
Andrew: I have replied to your comment here.
It was in moderation too long. It’s out now.
Thank you.
Where is everyone???
Probably bored of the this moving up 4 cents, back two, up 4, back two, up 4, back two. :o) 2476 only 20 points away now.
Well, if that’s the case they’ve missed a good upwards day.
Yes indeed. SPY calls literally doubled on this sharp expected move up today. Nice call Lara!
Wondering if we have started minute five up…I did not see much of a pull back today so assuming this is still wave three….