
A green daily candlestick has unfolded for Wednesday’s session exactly as was expected in yesterday’s summary. With some price confidence, now the alternate and main Elliott wave counts are swapped over.
Summary: An upwards breakout is expected. The profit target is at 2,478.
New updates to this analysis are in bold.
Last monthly and weekly charts are here. Last historic analysis video is here.
MAIN ELLIOTT WAVE COUNT
WEEKLY CHART
Click chart to enlarge.
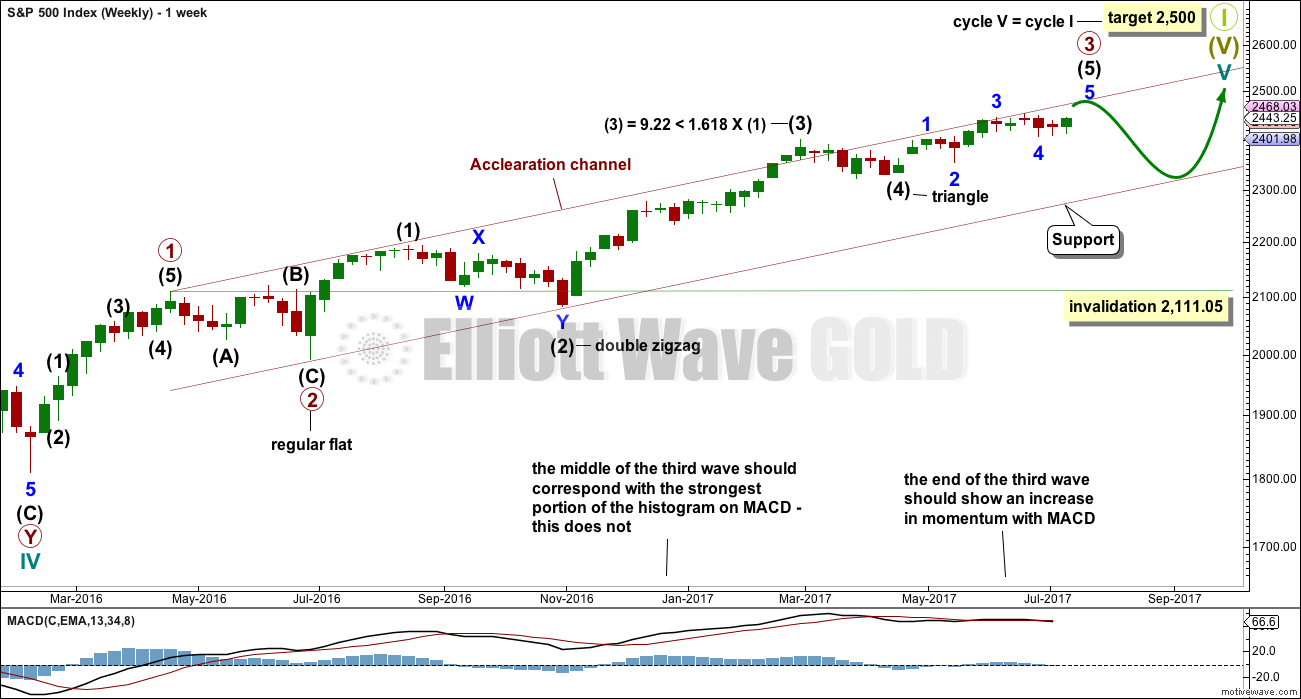
This wave count is identical to the alternate wave count up to the high labelled minor wave 3 within intermediate wave (5) within primary wave 3.
This alternate wave count sees primary wave 3 as incomplete, but close to completion.
Within primary wave 3 impulse, the final wave of intermediate wave (5) is seen as incomplete. Intermediate wave (5) is subdividing as an impulse.
When intermediate wave (5) is complete, then primary wave 3 would be complete. Primary wave 4 may not move into primary wave 1 price territory below 2,111.05.
DAILY CHART
Click chart to enlarge.
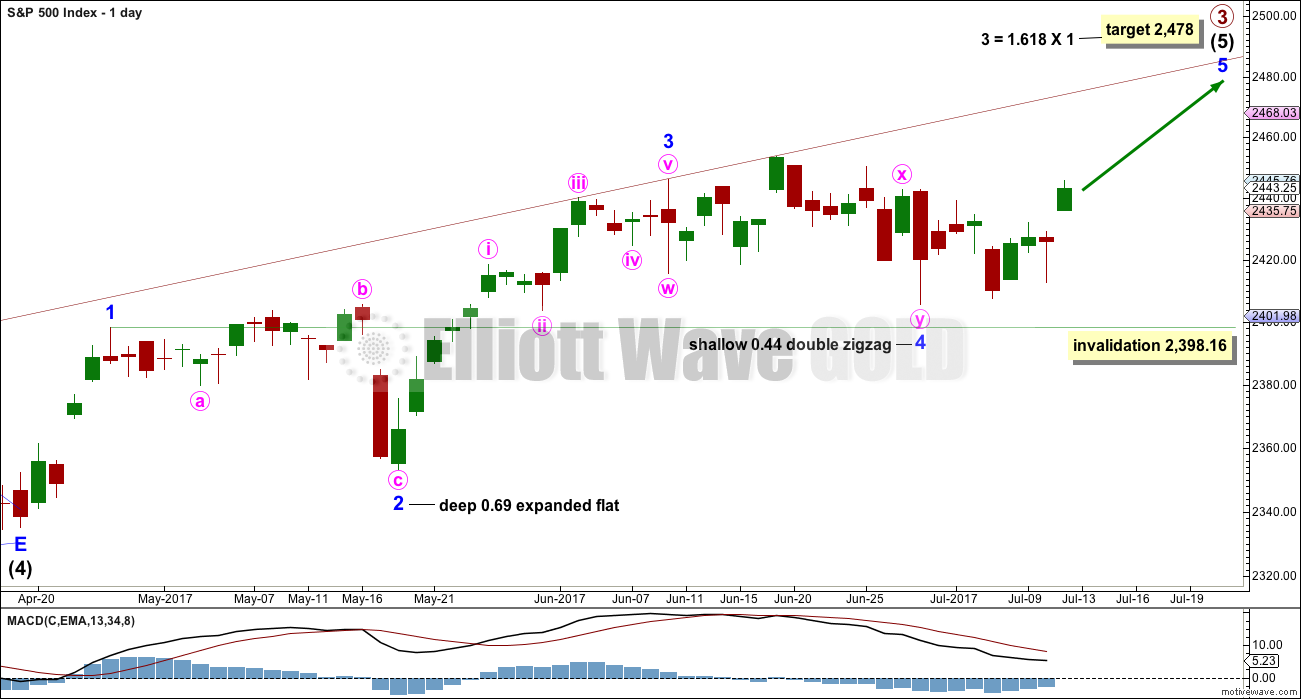
The daily chart shows only the structure of intermediate wave (5); this structure is an impulse.
Within intermediate wave (5), the correction of minor wave 4 may not move into minor wave 1 price territory below 2,398.16.
There is perfect alternation between the deep expanded flat of minor wave 2 and the shallow double zigzag of minor wave 4.
HOURLY CHART
Click chart to enlarge.
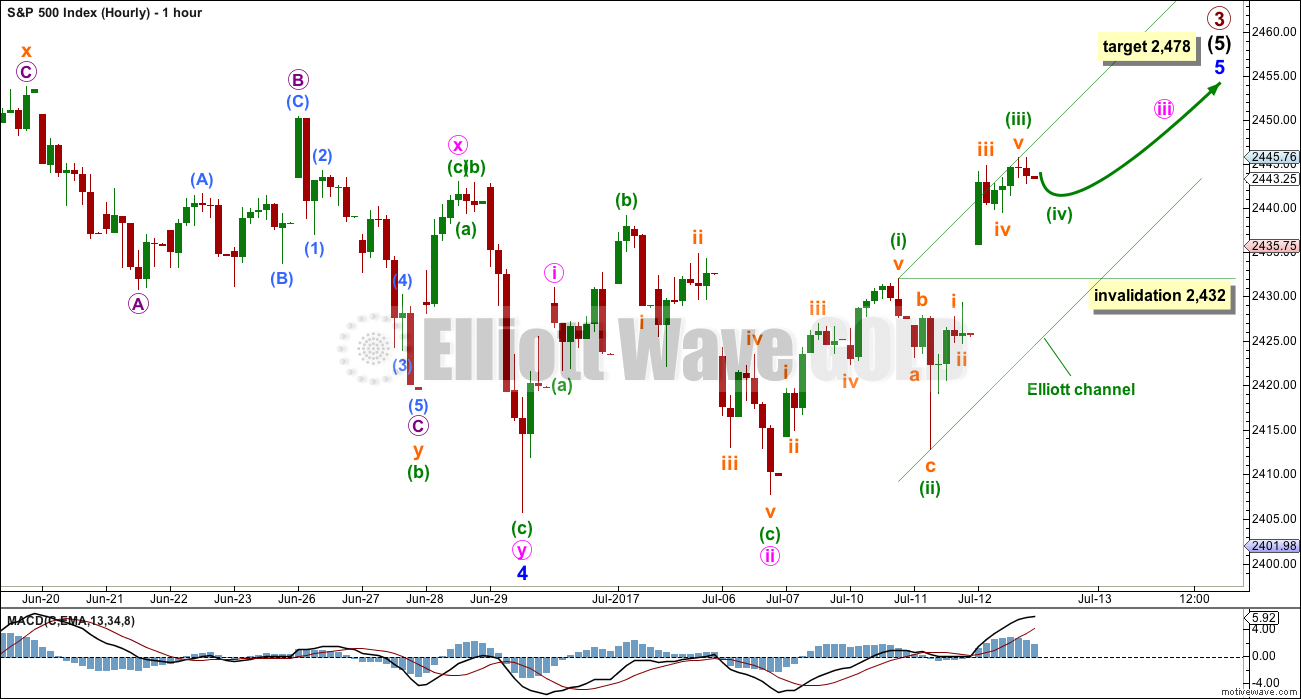
Within the double zigzag of minor wave 4, the second zigzag labelled minute wave y has deepened the correction by 10 points; so it has achieved its purpose. Minor wave 4 does have a slight downwards slope even with the middle of it being mostly sideways movement. This is acceptable.
The increase in upwards momentum for Wednesday’s session perfectly fits this wave count.
Minuette wave (iv) may not move back down into minuette wave (i) price territory below 2,432.00.
When there is a new high, then minute wave iii could possibly be over. At that stage, the invalidation point should move to the end of minute wave i at 2,430.98. Minute wave iv may not move into minute wave i price territory.
ALTERNATE ELLIOTT WAVE COUNT
WEEKLY CHART
Click chart to enlarge.
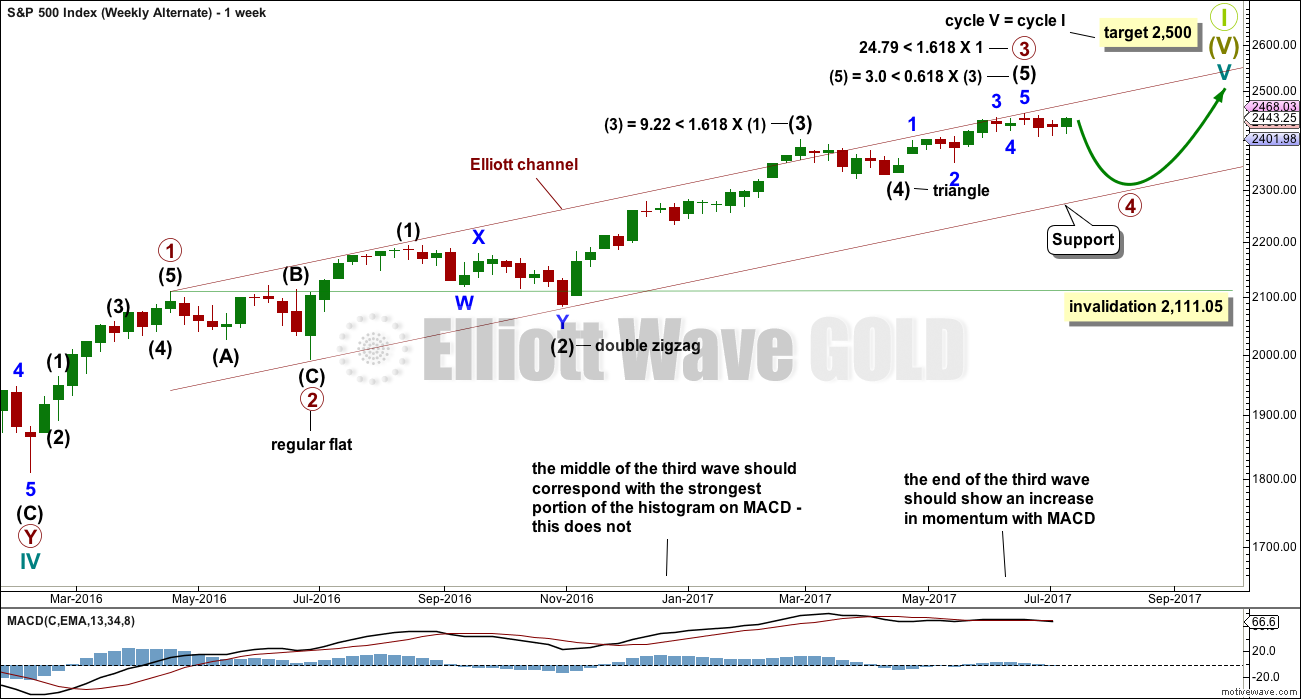
Primary wave 4 may now be underway. This is now an alternate wave count.
Primary wave 2 was a regular flat correction that lasted 10 weeks. Given the guideline of alternation, primary wave 4 may most likely be a single or multiple zigzag or a triangle and may last about a Fibonacci eight or thirteen weeks, so that the wave count has good proportion and the right look. So far it has lasted three weeks. This is far too brief to be considered complete or even close to complete.
Primary wave 4 may end within the price territory of the fourth wave of one lesser degree. Intermediate wave (4) has its range from 2,400.98 to 2,322.35.
Primary wave 4 may not move into primary wave 1 price territory below 2,111.05.
DAILY CHART
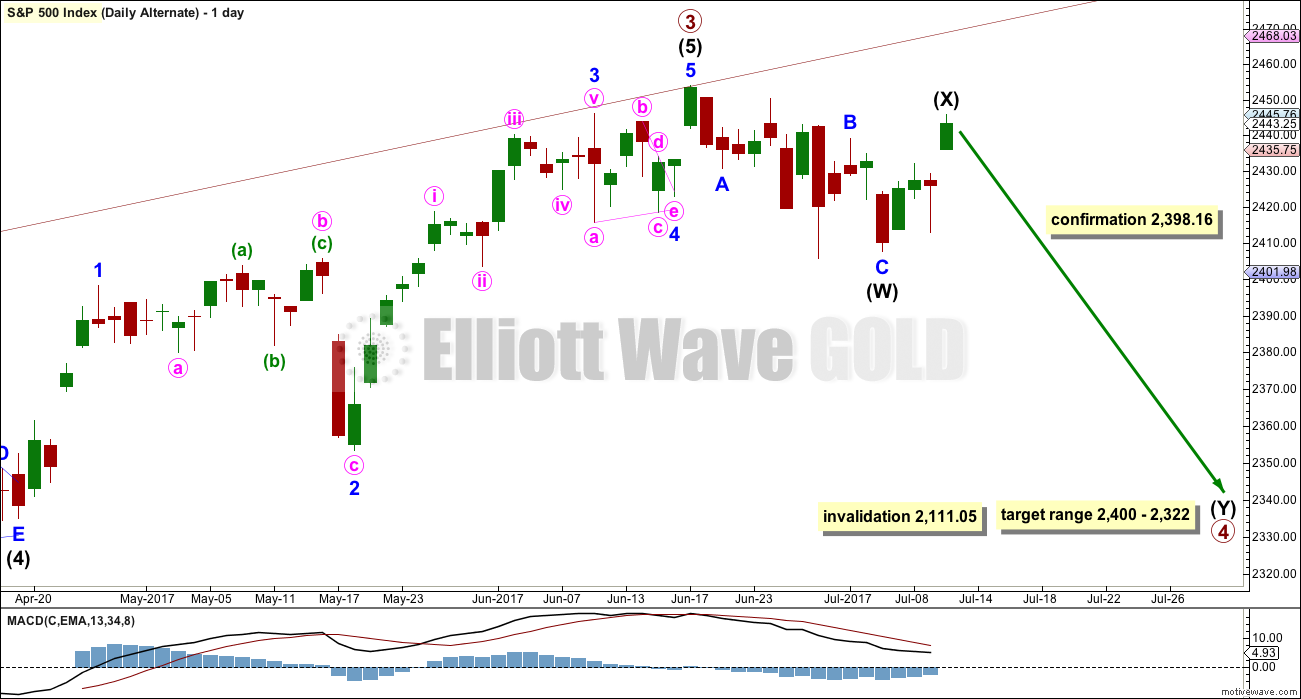
Click chart to enlarge.
Primary wave 4 may be unfolding as a double zigzag, or a double combination. A double zigzag would offer better alternation with the flat of primary wave 2, but a combination would still offer some alternation.
Labelling within primary wave 4 is today changed. The first structure in a double may be complete.
HOURLY CHART
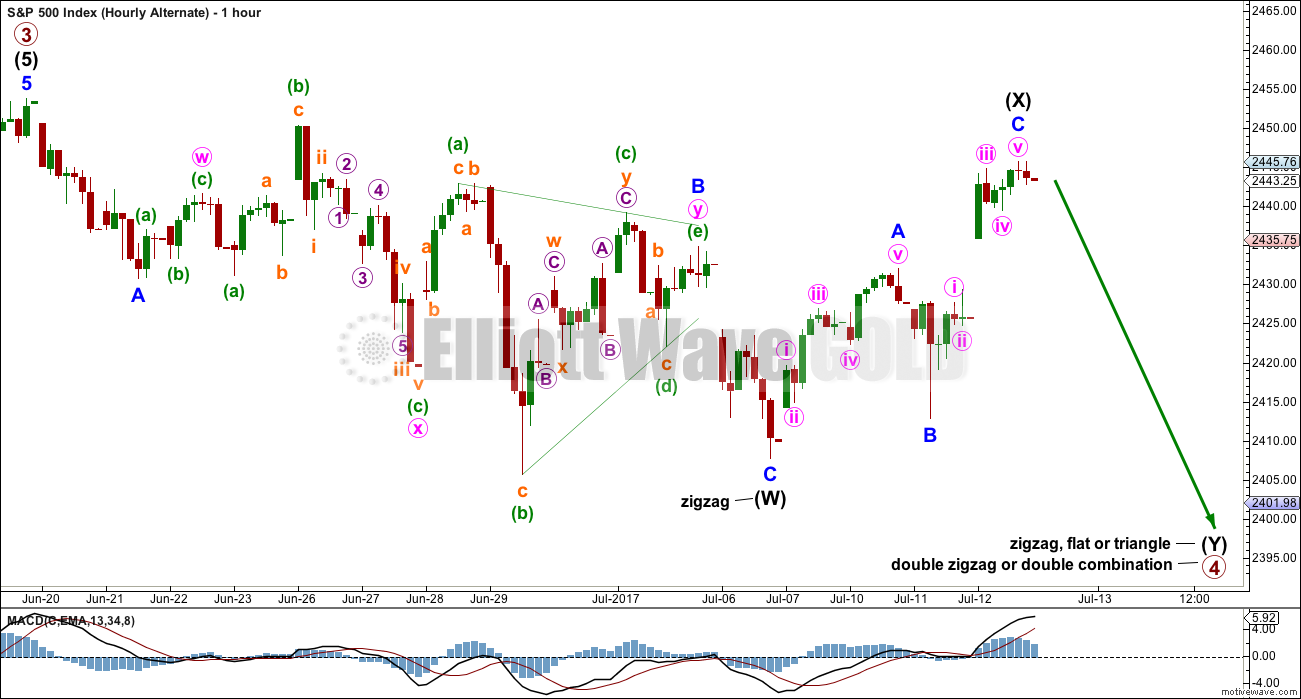
Click chart to enlarge.
The first structure in a possible double is labelled as a zigzag for intermediate wave (W), subdividing 5-3-5.
The double is joined by a now possibly complete three in the opposite direction, a zigzag labelled intermediate wave (X).
The second structure in the multiple may be a zigzag for a double zigzag (most likely), or a flat or triangle for a double combination (still possible, but less likely). It would be labelled intermediate wave (Y) and should last about two weeks.
Within double zigzags, their X waves are normally brief and shallow. So far intermediate wave (X) is neither, but primary wave 4 may still be a double zigzag.
Within double combinations, their X waves are normally deep as this one is. There is no rule stating the limit to X waves within double combinations, and they may make new price extremes beyond the start of wave W or Y. Here, intermediate wave (X) may make a new high above 2,453.82 and this wave count will remain valid. Unfortunately, there is no upper invalidation point that would see this wave count discarded. It will be discarded based upon structure and classic technical analysis, if that is the case.
TECHNICAL ANALYSIS
WEEKLY CHART
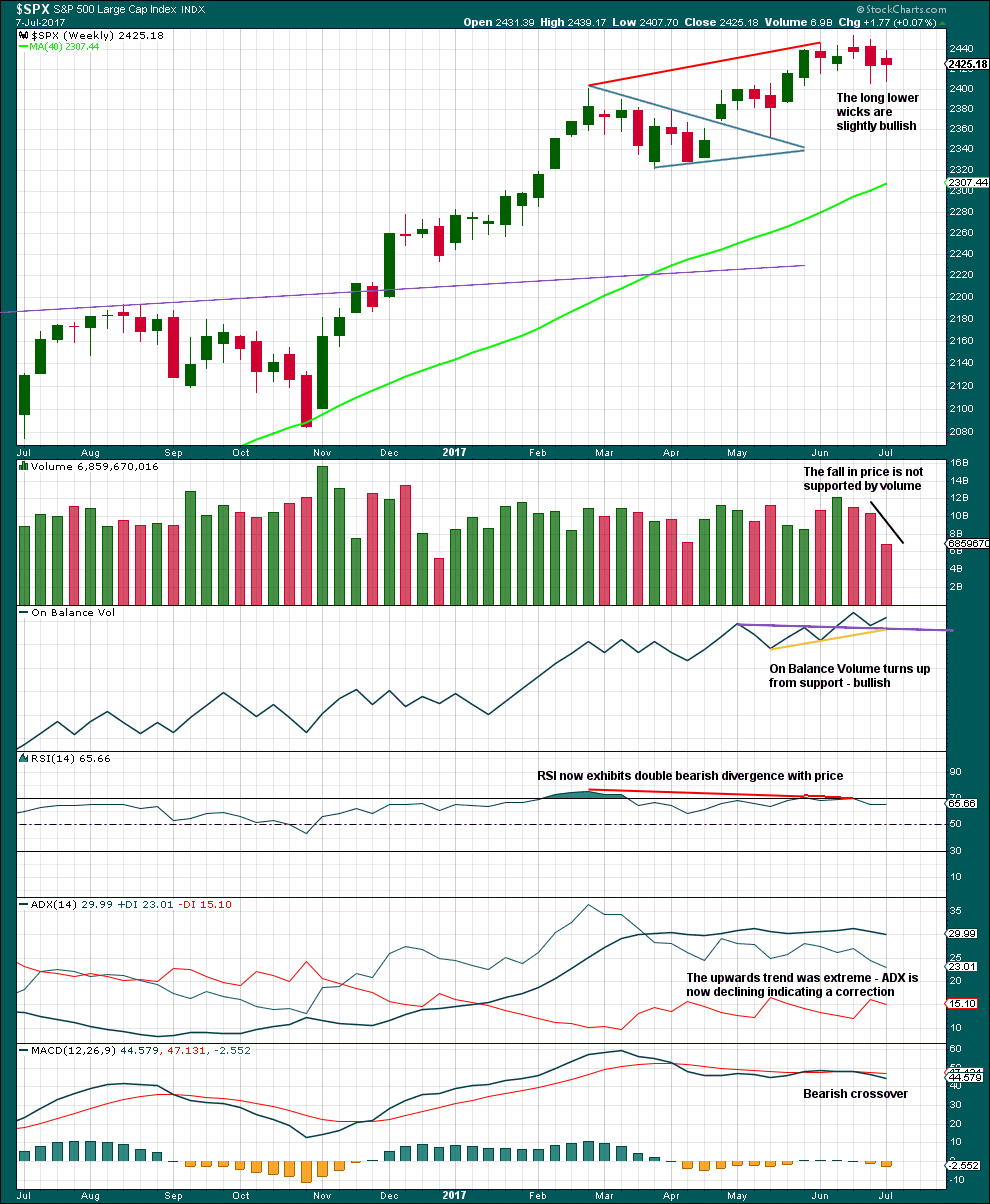
Click chart to enlarge. Chart courtesy of StockCharts.com.
Volume, candlesticks and On Balance Volume are bullish. This does not support the main Elliott wave count.
ADX, RSI and MACD still are bearish, and point to lower prices in the next few weeks.
DAILY CHART
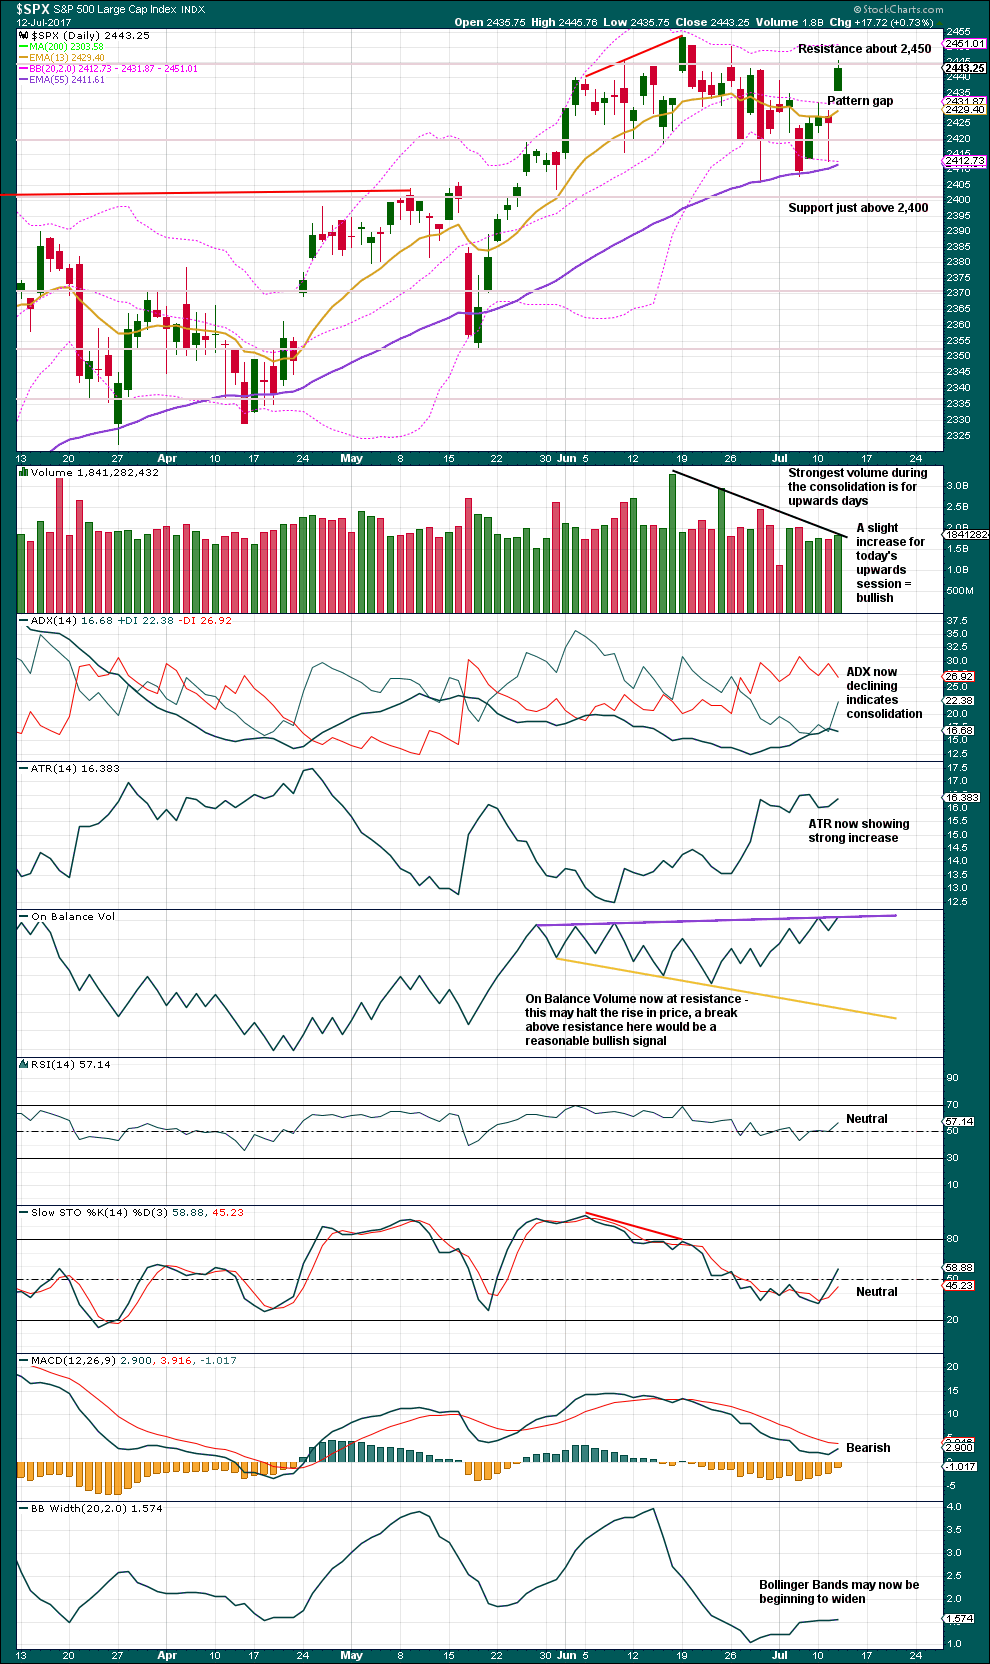
Click chart to enlarge. Chart courtesy of StockCharts.com.
Stepping back and taking a very simple approach to current market conditions sees a very obvious consolidation continuing. This view is supported by now clearly declining volume as price moves sideways.
During the consolidation, it is upwards days that have strongest volume, suggesting again another upwards breakout when the consolidation is complete. More long lower wicks than long upper wicks also looks like this view is more likely correct.
This is no longer contradicted by ADX. ADX now agrees that price is consolidating. Only ATR does not support this view today.
Support is about just above 2,400 and resistance about 2,450. The safest approach to a consolidating market is to wait patiently for a breakout and then join the trend afterwards. Often after a breakout price curves back to re-test prior support or resistance, the final “kiss goodbye”. When price behaves like that, it offers a good entry opportunity to join a trend with some confidence.
This chart offers more support to the main Elliott wave count than the alternate Elliott wave count. The picture looks a little clearer today.
VOLATILITY – INVERTED VIX CHART
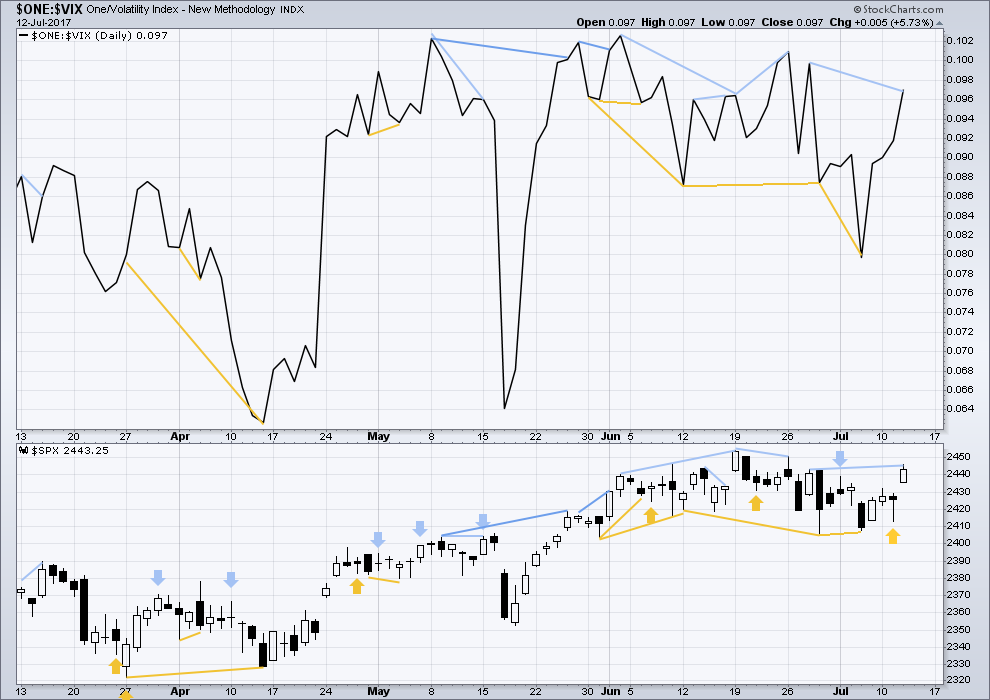
Click chart to enlarge. Chart courtesy of StockCharts.com.
Normally, volatility should decline as price moves higher and increase as price moves lower. This means that normally inverted VIX should move in the same direction as price.
Bullish divergence noted yesterday has been followed by upwards movement.
There is new short term bearish divergence today between price and inverted VIX: price has made a new high above the prior high of the 28th of June, but inverted VIX has not made a corresponding new high. This divergence indicates upwards movement from price today lacks a corresponding decline in volatility.
BREADTH – AD LINE
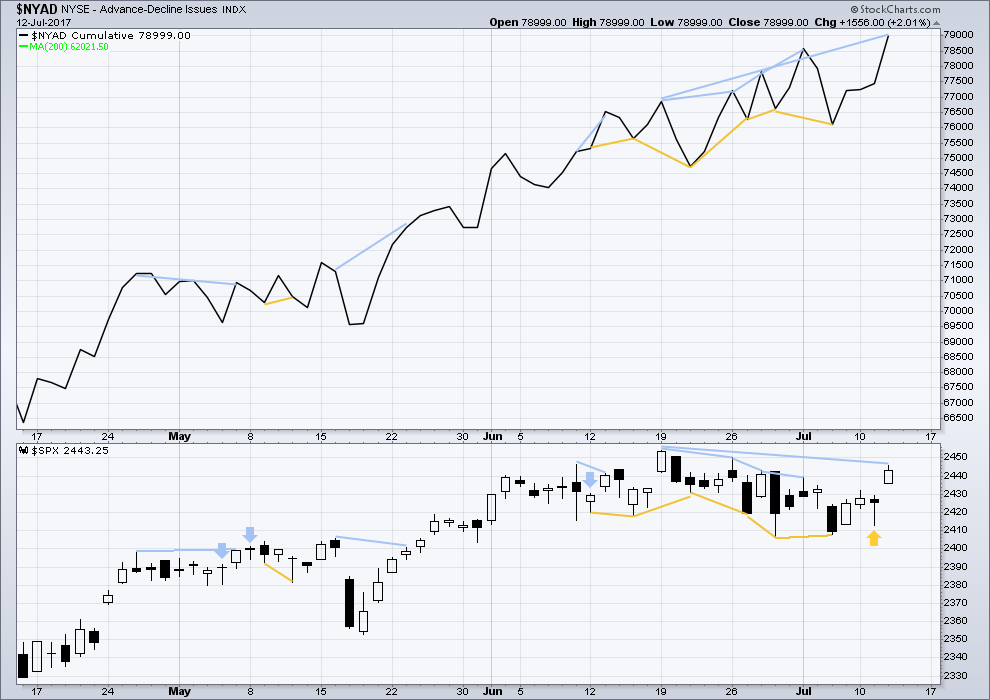
Click chart to enlarge. Chart courtesy of StockCharts.com.
With the last all time high for price, the AD line also made a new all time high. Up to the last high for price there was support from rising market breadth.
There is normally 4-6 months divergence between price and market breadth prior to a full fledged bear market. This has been so for all major bear markets within the last 90 odd years. With no divergence yet at this point, any decline in price should be expected to be a pullback within an ongoing bull market and not necessarily the start of a bear market.
Hidden bullish divergence noted after Thursday’s session has now been followed by two upwards days. It may now be resolved here.
Bullish divergence noted yesterday between price and the AD line has now been followed by an upwards day. There is new mid term bearish divergence today: the AD line has made a new all time high, but price has not. This indicates weakness within upwards movement today from price.
The mid caps and small caps have made new all time highs along with recent last all time high for large caps. The rise in price is seen across the range of the market, so it has internal strength.
While the market has moved sideways for about a month now, it has been accompanied by new highs in market breadth and improving underlying health as measured by Lowry’s buying power and selling pressure. This sideways correction should be expected to be a normal consolidation within an ongoing healthy bull market.
Historically, almost every bear market is preceded by at least 4-6 months of divergence with price and market breadth. There is no divergence at all at this time. This strongly suggests this old bull market has at least 4-6 months to continue, and very possibly longer.
DOW THEORY
The DJT today has finally made a new all time high. This confirms a continuation of the bull market.
Nasdaq still has not made a new all time high. Modified Dow Theory (adding in technology as a barometer of our modern economy) indicates some weakness at this time within the bull market, but there is zero indication that it is over.
The following lows need to be exceeded for Dow Theory to confirm the end of the bull market and a change to a bear market:
DJIA: 17,883.56.
DJT: 7,029.41.
S&P500: 2,083.79.
Nasdaq: 5,034.41.
Charts showing each prior major swing low used for Dow Theory are here.
This analysis is published @ 09:15 p.m. EST.
Hi Lara,
don’t think target for minute III can be 2414 as price is already higher than that?
You’re right. It should be 2,449. Not quite sure what went wrong there… fixed now.
Minute iii not yet done I think.
Nice alternation between minuette (ii) zigzag and minuette (iv) expanded flat.
I am one quarter filled on long volatility trade via VIX August 11.50 calls filled @ 1.50
Buy stop on another quarter when they trade at 1.75 Holding an equal quota of bull and bear spreads going out two weeks or more.
Bye all!
It is really uncanny the number of times I have managed to post exactly at the time Lara was giving her daily update! All thumbs aren’t I?? 🙂
Is 2414 typo of Minute iii? 2464 or some number else?
Yep…clearly…
I may be a bit early but I am rolling that SPY trade into VIX calls at the market. The profit was small but I would rather be long volatility than long the market. Buying August 10.50 calls for 2.00
What ever upside move remains in the market I suspect will be over intra-day and we still could get a downside flush. Things looking pretty dicey to me…..
Apparently nobody told Kohl’s that retail had died and it re-visited the 39.00 price point today- as sure a short trade as exists these days. 🙂
For option traders, trying to scalp a possible 30 point move ahead of what may well be significant trend change is not good R/R set up. I think it better to wait for closer to target to enter short with stop just above. Not yet filled on Vol at my desired price…waiting….
I’m taking the money and running on my quick SPY 244 strike calls expiring tomorrow. Let’s see if they ramp it up into the close; will reload if they do as I think the high will come tomorrow in that case.
We have to continue to assume these are all corrective moves ahead of the final wave up. So long as the important invalidation points and support pivots remain un-violated, the trend is up it seems to me….slow, boring and annoying, but up… 🙂
Exactly.
But if it’s excitement you wish for, be careful. When Grand Super Cycle I is over and Grand Super Cycle II begins (now maybe next year) it could be so fast, almost impossible to trade.
Believe it or not, I have pretty much come to that conclusion. I think the volatility is going to be exchange-crashing, with all kinds of down-limit halts of trading, and possibly even some frozen accounts. My hope is to trade the initial impulse down, and the deep second wave correction then move the bulk of my capital to a safe place. I have a strange feeling that there are going to be no winners, even those on the right side of the trade…remember brokerage instruments are not FDIC insured and if the trading houses and even the holding bank go out of business you have no recourse…
VIX will probably put in its low at the top of minute three, with a slightly higher low at the end of minute five (and minor five). A move below 10.00 means its time to buy cheap volatility. Buying the August 11.50 strike calls for limit price of 1.25 GTC. One half full position.
SPX move towards new high very labored. I am starting to think as soon as a new high is printed we are going to see a very sharp reversal as this upward movement is quite weak.
If minuette four is over it was fairly shallow compared to the second wave. We should get minute three up done today and perhaps Mr Market pulls another head-fake for minute four down ahead of a run to a final interim top tomorrow…..
Tomorrow, June 14, is an important turn date on quite a few cycles. It is possible that it heralded the current rally which got going a bit early, or that we will see an interim top this Friday. I would expect we should approach new highs today if we will indeed get a significant turn date tomorrow.
Key level for main hourly count today is 2432
Russell Gap fill is interesting, and there are all kinds of wacky moves all over the place in names like STX, and HTZ. Negative divergences on short term momentum as well.
Nasdaq also starting to print a red candle so that is most interesting. Are we topping today with no new SPX ATH?
That would be uber bearish.
Very interesting indeed. Also, for the first time in my career we are getting non-solicited business, due to high sharpe and negative correlation. People are finally actively looking for hedged/hedging products. Could be contrarian as always, but it seems like a rushed move to allocate ahead of something not so good.
That display of caution does indeed go against the grain. I realize that I have a naturally bearish bent but the kind of complacency we are seeing is absolutely stunning, beyond anything I have ever witnessed, including the 2000 and 2007 tops.
Snuck right in Doc!
Snuck in…. but just behind the Doc
Shhhhhh…!!! 🙂
Mine,,I got you wabbit