
Price remains within confidence points for the main and alternate hourly Elliott wave counts. The breakout should come soon and simple volume analysis may be used to judge which direction is most likely.
Summary: Some reasonable bullishness in classic technical analysis today indicates most likely a green candlestick tomorrow. An upwards breakout from this consolidation looks most likely.
A new high above 2,432 would see confidence in the new alternate wave count. The target would then be 2,478.
A new low now below 2,407.70 would add confidence to the main wave count. At that stage, expect the pullback has not ended. The target would be 2,390 in the first instance.
New updates to this analysis are in bold.
Last monthly and weekly charts are here. Last historic analysis video is here.
MAIN ELLIOTT WAVE COUNT
WEEKLY CHART

Click chart to enlarge.
Primary wave 4 may now be underway.
Primary wave 2 was a regular flat correction that lasted 10 weeks. Given the guideline of alternation, primary wave 4 may most likely be a single or multiple zigzag or a triangle and may last about a Fibonacci eight or thirteen weeks, so that the wave count has good proportion and the right look. So far it has lasted only one week. This is far too brief to be considered complete or even close to complete.
Primary wave 4 may end within the price territory of the fourth wave of one lesser degree. Intermediate wave (4) has its range from 2,400.98 to 2,322.35.
Primary wave 4 may not move into primary wave 1 price territory below 2,111.05.
DAILY CHART
Click chart to enlarge.
If primary wave 4 unfolds as the more common single or multiple zigzag, then it should begin with a five down at the daily chart level. This is incomplete.
If minor wave 2 is not over, and if it continues any higher (as per the alternate hourly wave count below), then it may not move beyond the start of minor wave 1 above 2,453.82.
When intermediate wave (A) is complete, then intermediate wave (B) should unfold higher or sideways for at least two weeks.
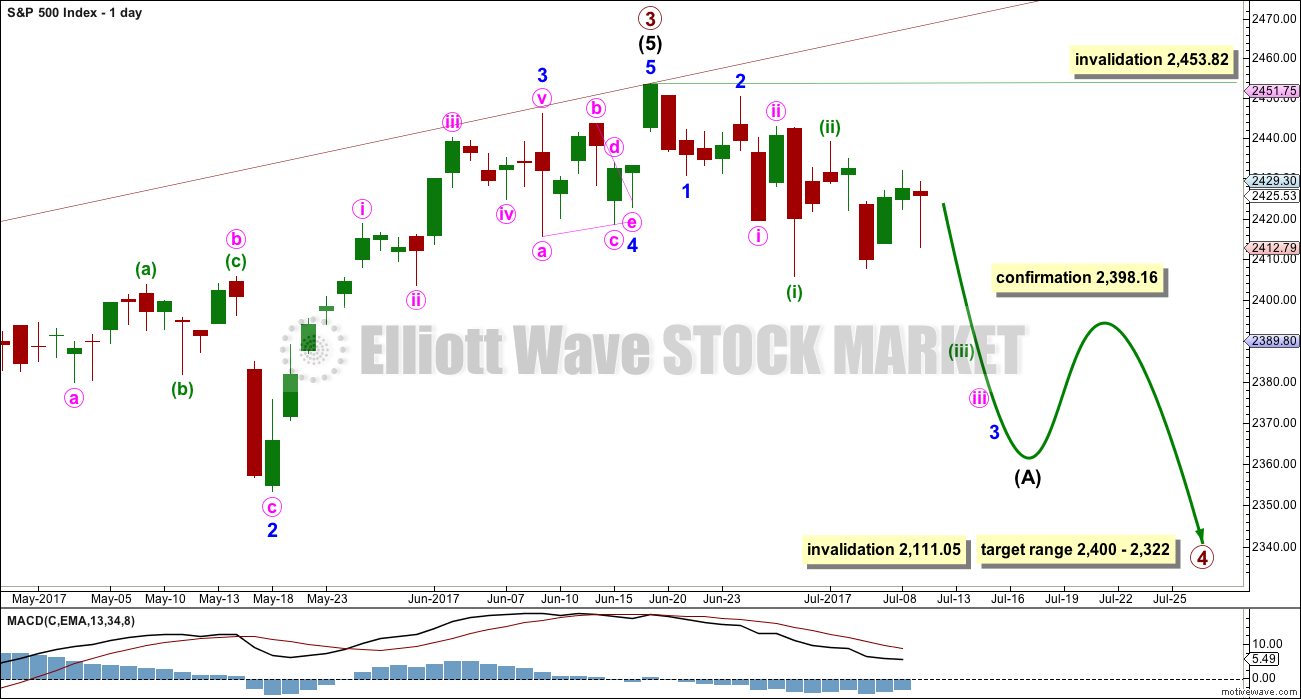
HOURLY CHART
Click chart to enlarge.
Draw the acceleration channel from the end of minor wave 1 to the last low, then place a parallel copy on the end of minor wave 2. The upper edge should provide resistance along the way down. This has not worked perfectly during Monday’s or Tuesday’s sessions, but the S&P just does not always fit neatly within channels. The small breach is acceptable now that price has returned to within the channel at the end of the session.
Keep redrawing the channel as price moves lower. When minor wave 3 is complete, then it will be an Elliott channel that shows where minor wave 4 may find resistance.
There are now five first and second waves complete.
Labelling for Tuesday’s session is problematic for this main wave count. Micro wave 2 is labelled as an expanded flat correction; all subdivisions fit on the five minute chart and this labelling meets all Elliott wave rules. However, within the expanded flat, sub-micro wave (B) is 3.17 times the length of sub-micro wave (A) and this is much longer than the maximum convention of 2. So this must reduce the probability of this wave count today, or at least my labelling of this portion. I would not be prepared to label micro wave 1 over at the low for this session, because it would then be a three and it must be a five.
The short term conclusion must be that at this time the alternate now has a better fit for most recent movement in terms of Elliott wave structure at the hourly chart level.
This wave count expects now to see a strong increase in downwards momentum this week as the middle of a third wave passes. Fourth wave corrections should be shallow and must remain below their corresponding first wave’s territory.
At 2,392 minute wave iii would reach 1.618 the length of minute wave i.
A new alternate below would now be invalidated if price makes a new low below 2,407.70. At that stage, some confidence may be had in this main wave count.
ALTERNATE ELLIOTT WAVE COUNT
WEEKLY CHART
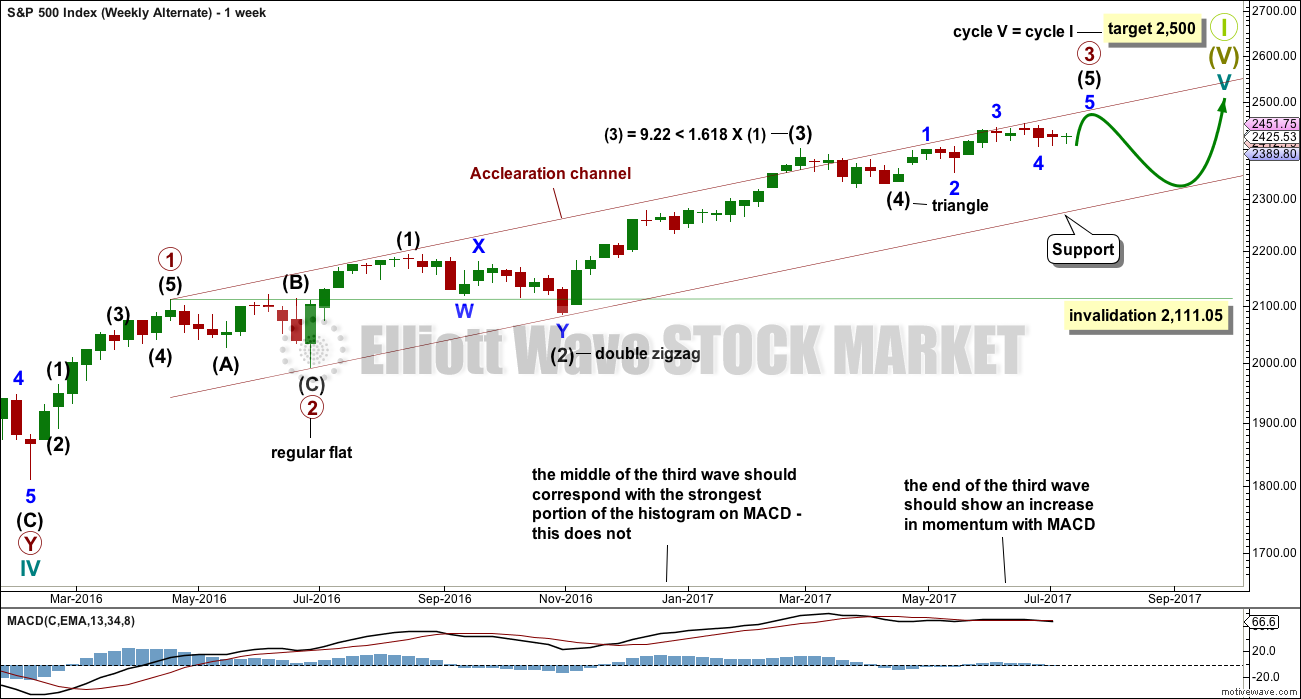
Click chart to enlarge.
This wave count is identical to the main wave count up to the high labelled minor wave 3 within intermediate wave (5) within primary wave 3.
This alternate wave count sees primary wave 3 as incomplete, but close to completion.
Within primary wave 3 impulse, the final wave of intermediate wave (5) is seen as incomplete. Intermediate wave (5) is subdividing as an impulse.
When intermediate wave (5) is complete, then primary wave 3 would be complete. Primary wave 4 may not move into primary wave 1 price territory below 2,111.05.
DAILY CHART
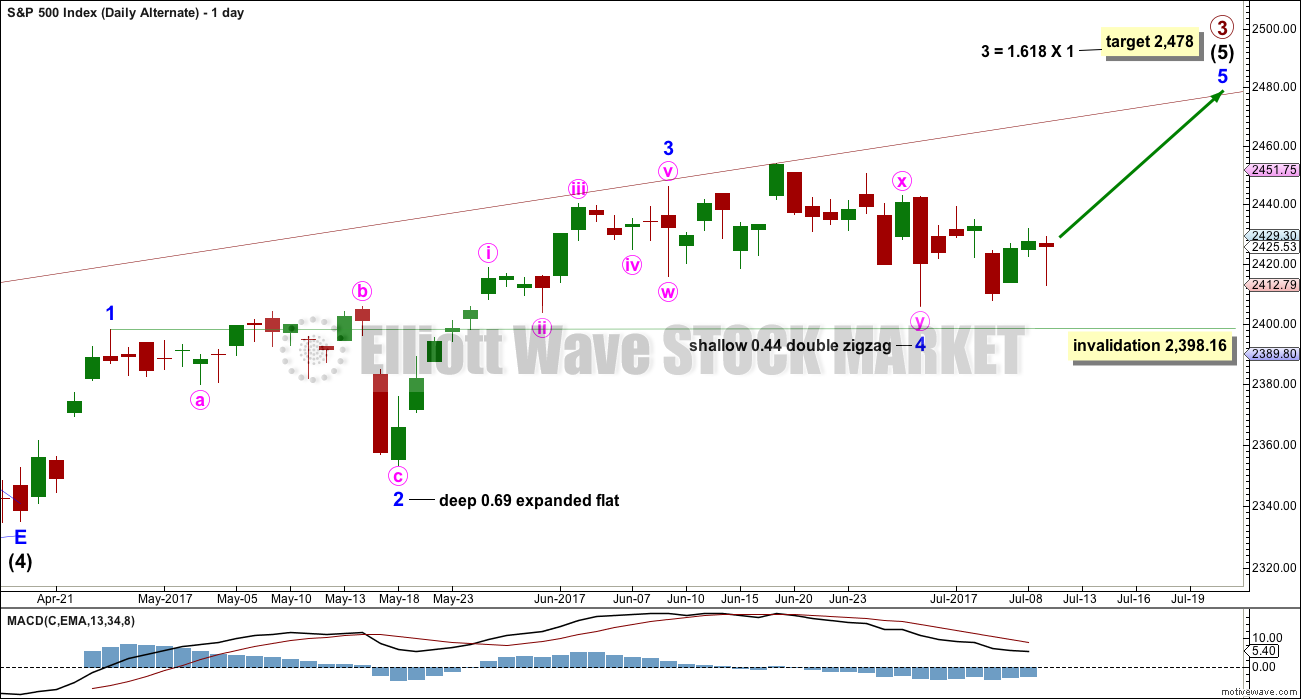
Click chart to enlarge.
The daily chart shows only the structure of intermediate wave (5); this structure is an impulse.
Within intermediate wave (5), the correction of minor wave 4 may not move into minor wave 1 price territory below 2,398.16.
There is perfect alternation between the deep expanded flat of minor wave 2 and the shallow double zigzag of minor wave 4.
The end of minor wave 3 for this alternate must be on the high of the 9th of July. At that high it fits perfectly as an impulse, and within it minute wave iv has not overlapped back down into minute wave i price territory. Thus minor wave 4 begins where minor wave 3 ends, on the high of the 9th of July. This means that any analysis of minor wave 4 must take all movement from that point into account.
I have gone through a process of looking at all the alternate scenarios I can see for the structure of minor wave 4. Members are most welcome to have a go as well and share your efforts in comments with a chart as Kkuykendoll has kindly done in last analysis; it is entirely possible someone will see something that I have missed and that we may all benefit from. If doing so, be careful to begin the analysis of minor wave 4 at the appropriate point, otherwise the structure of minor wave 3 will no longer work as an impulse.
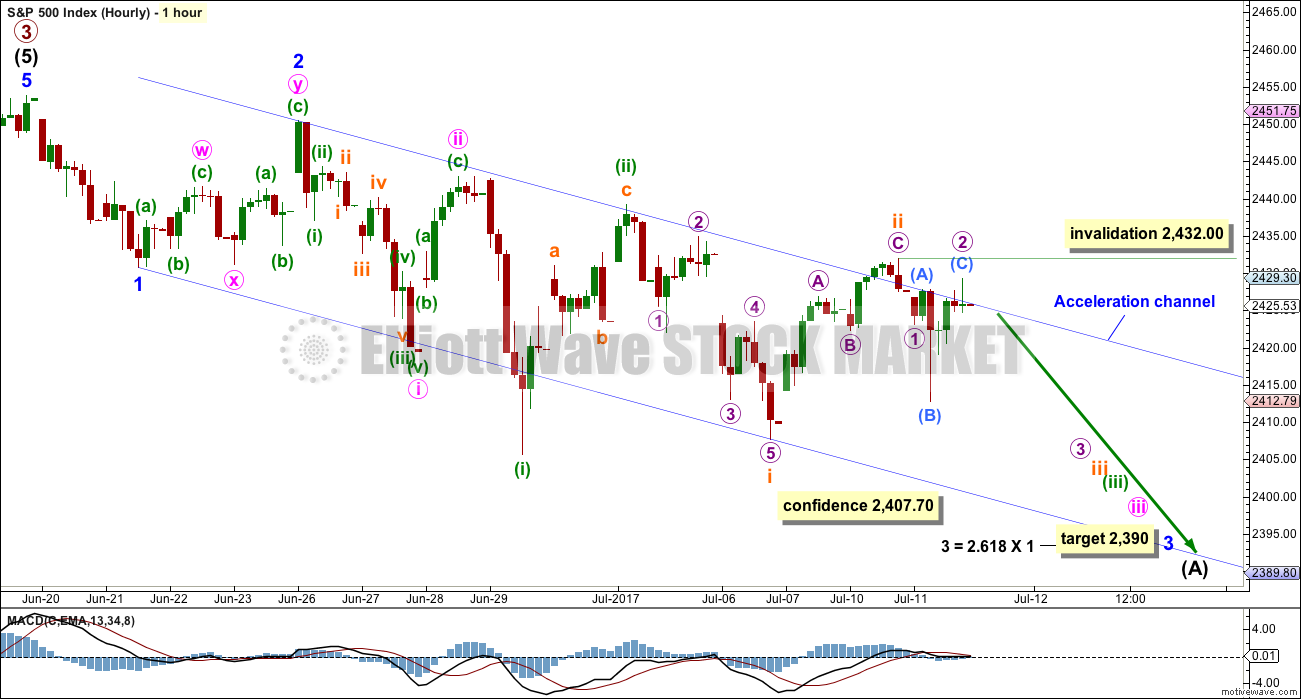
HOURLY CHART
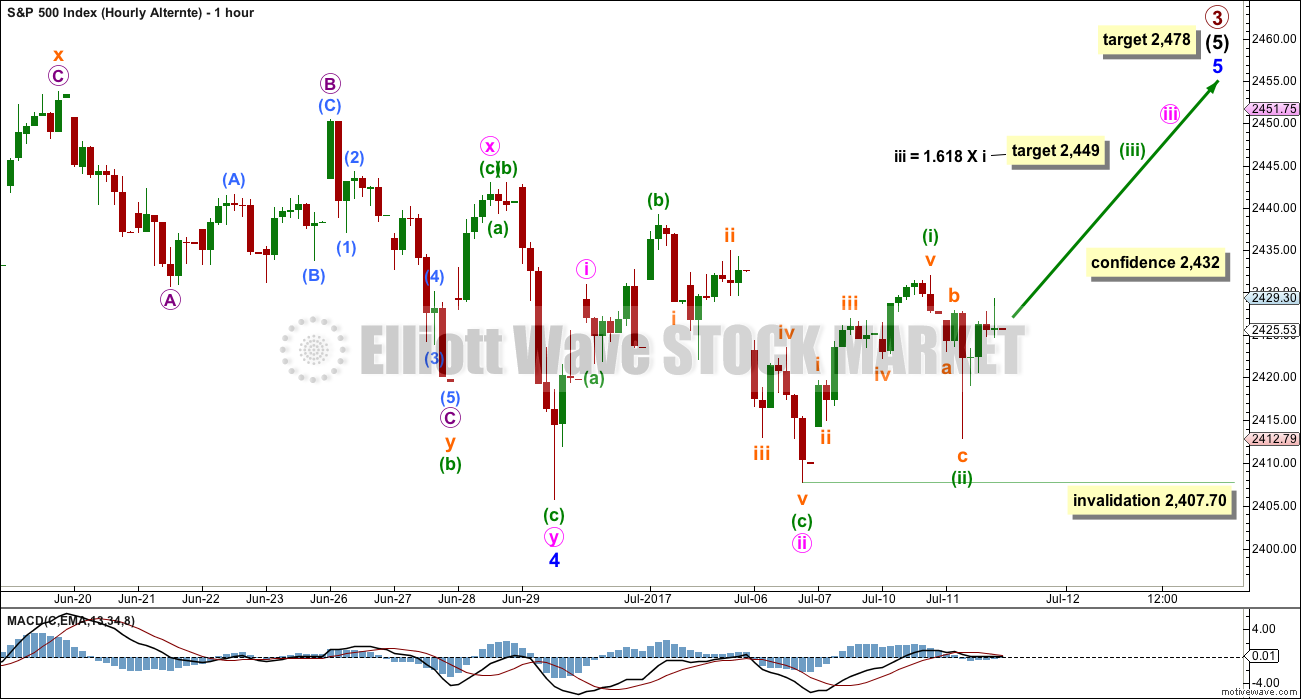
Click chart to enlarge.
Within the double zigzag of minor wave 4, the second zigzag labelled minute wave y has deepened the correction by 10 points; so it has achieved its purpose. Minor wave 4 does have a slight downwards slope even with the middle of it being mostly sideways movement. This is acceptable.
Some confidence may be had in this wave count if price makes a new high above 2,432. At that stage, expect it is more likely that price shall make new all time highs by the end of this week or next week.
This wave count expects to see an increase in upwards momentum.
At this stage, the most recent movement on the hourly chart looks like a five up from the low of the 6th of July, and this is labelled as an impulse for minuette wave (i). Downwards movement to the low for today’s session fits very well as a three, and this is labelled as minuette wave (ii). This has a better fit, so it has a higher probability than the labelling of this movement on the main hourly wave count.
Minuette wave (ii) may not move beyond the start of minuette wave (i) below 2,407.70.
TECHNICAL ANALYSIS
WEEKLY CHART
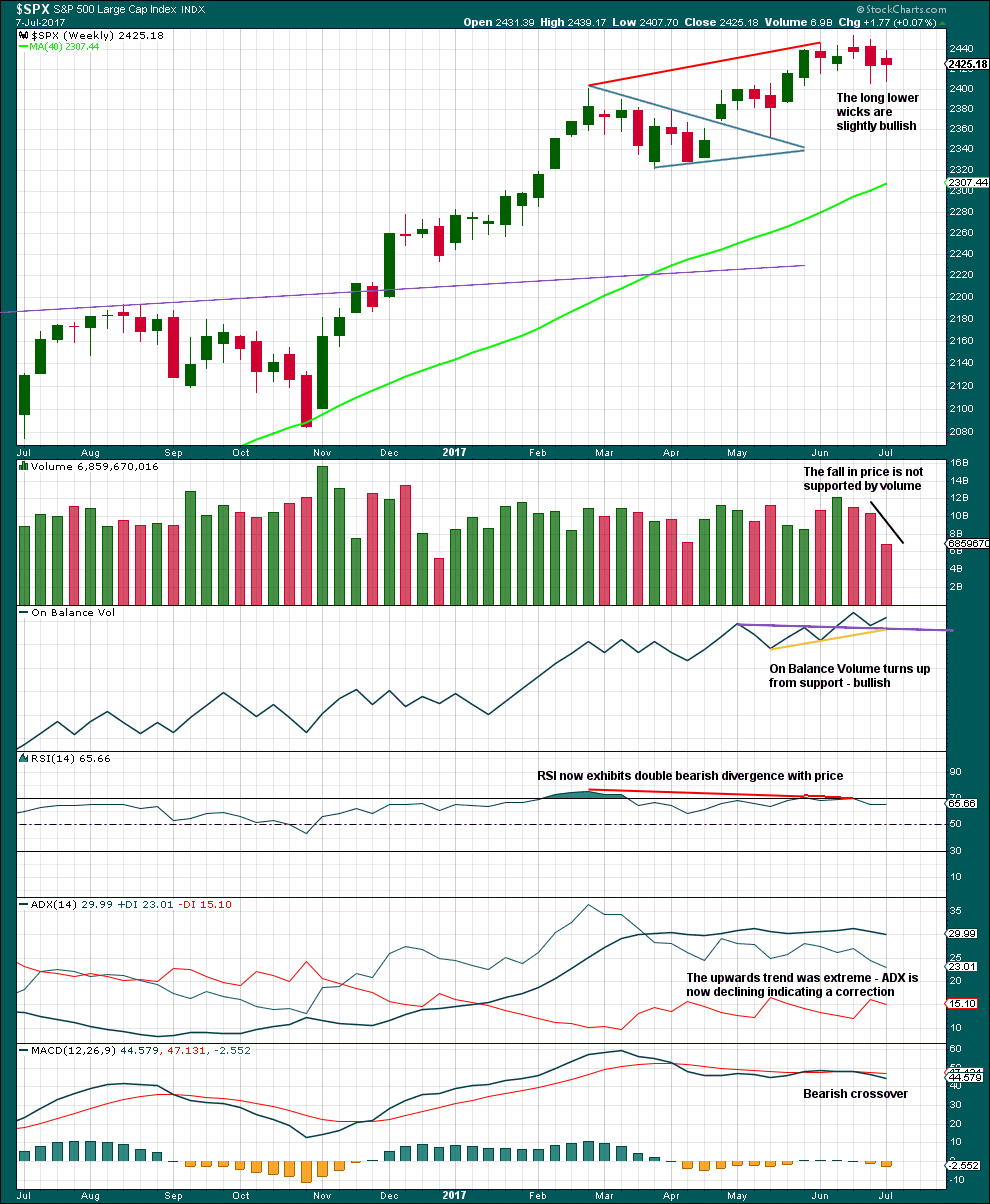
Click chart to enlarge. Chart courtesy of StockCharts.com.
Volume, candlesticks and On Balance Volume are bullish. This does not support the main Elliott wave count.
ADX, RSI and MACD still are bearish, and point to lower prices in the next few weeks.
DAILY CHART
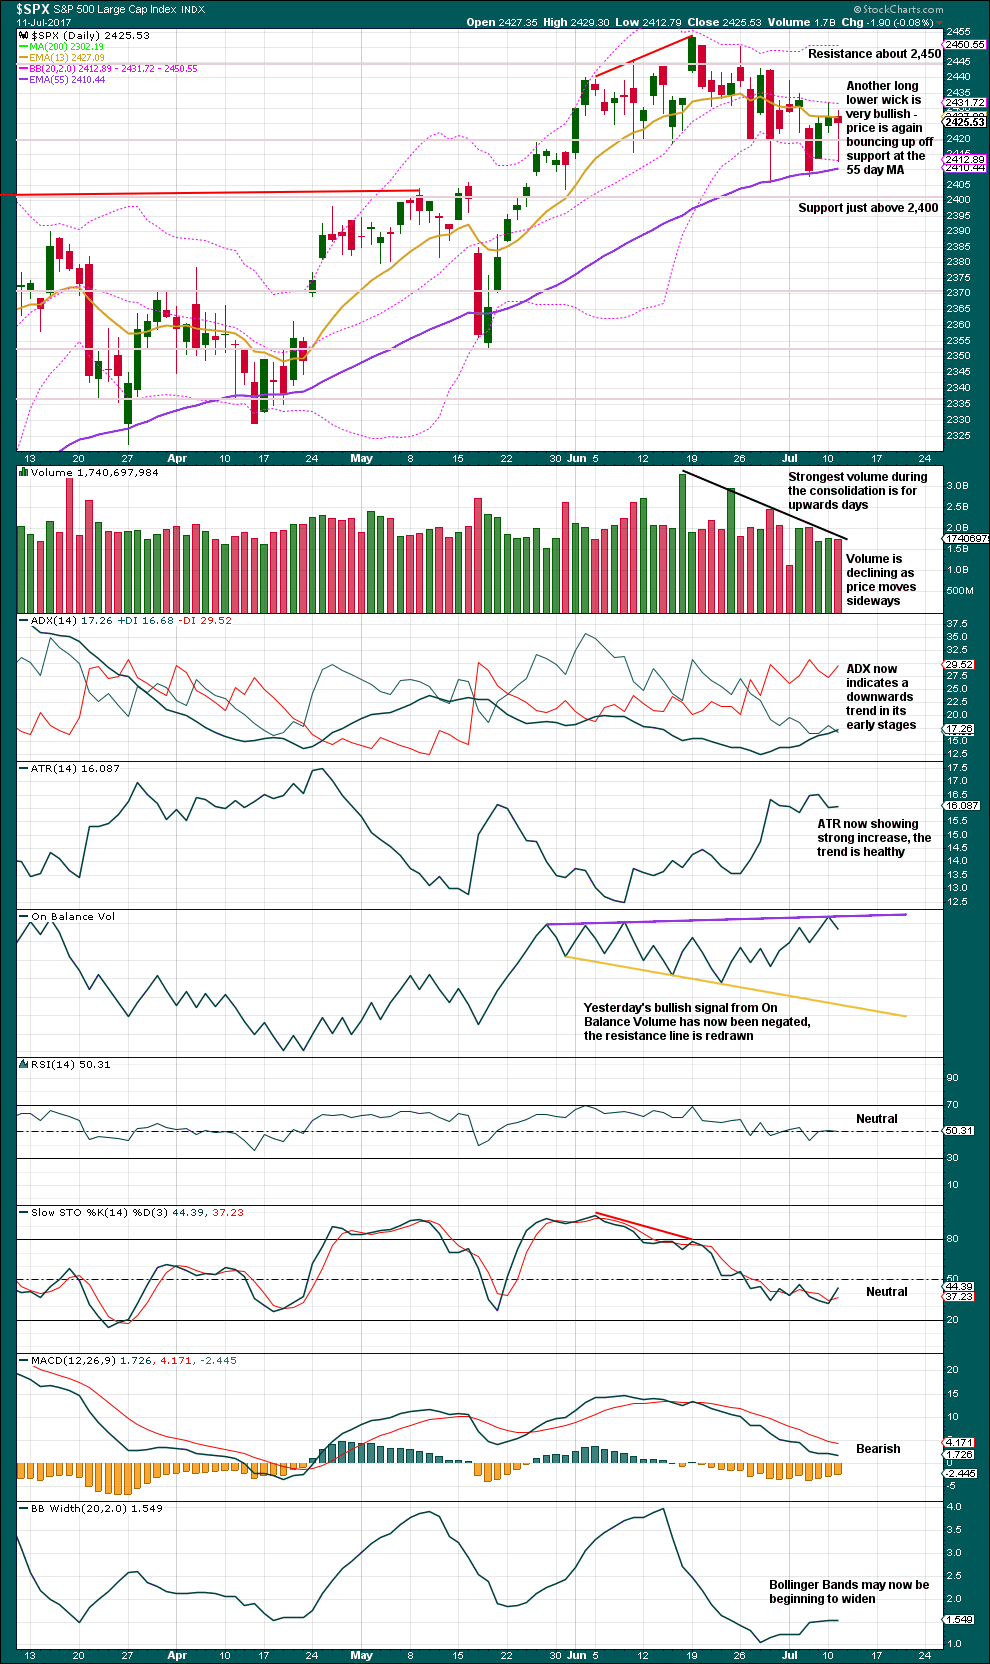
Click chart to enlarge. Chart courtesy of StockCharts.com.
Stepping back and taking a very simple approach to current market conditions sees a very obvious consolidation continuing. This view is supported by now clearly declining volume as price moves sideways.
During the consolidation, it is upwards days that have strongest volume, suggesting again another upwards breakout when the consolidation is complete. More long lower wicks than long upper wicks also looks like this view is more likely correct.
This is contradicted though by ADX indicating a downwards trend in place and ATR increasing, suggesting the market is trending.
Support is about just above 2,400 and resistance about 2,450. The safest approach to a consolidating market is to wait patiently for a breakout and then join the trend afterwards. Often after a breakout price curves back to re-test prior support or resistance, the final “kiss goodbye”. When price behaves like that, it offers a good entry opportunity to join a trend with some confidence.
This chart now offers more support to the alternate Elliott wave count than the main Elliott wave count, although the picture is still somewhat unclear.
VOLATILITY – INVERTED VIX CHART
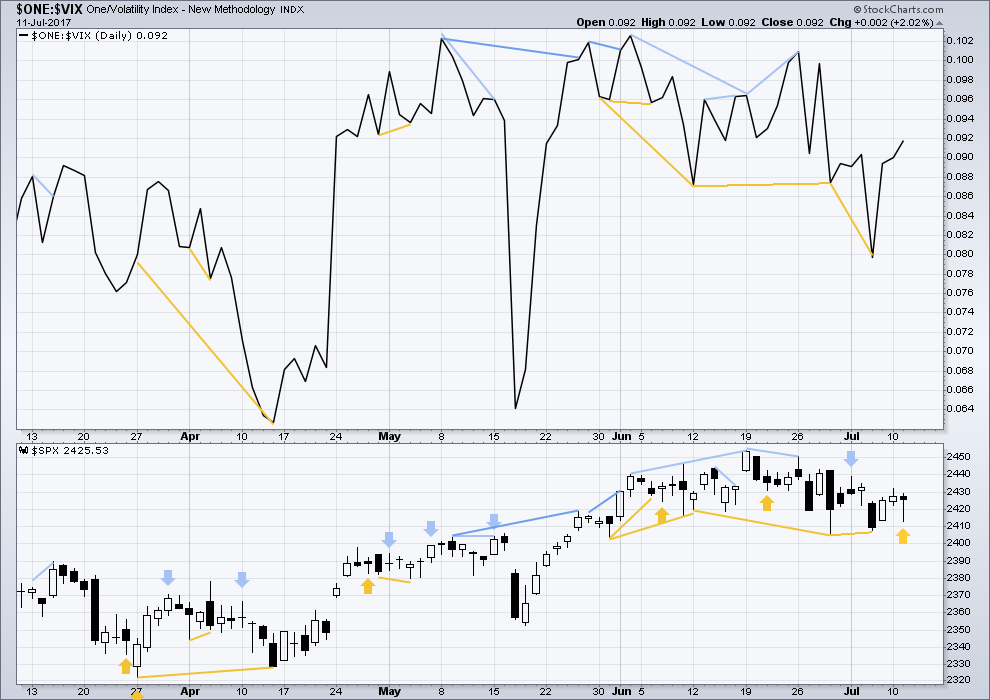
Click chart to enlarge. Chart courtesy of StockCharts.com.
Normally, volatility should decline as price moves higher and increase as price moves lower. This means that normally inverted VIX should move in the same direction as price.
There is single day divergence today between price and Inverted VIX. Price moved lower today, with a lower low and a lower high, but volatility declined (normally, volatility should increase; inverted VIX should move lower because it’s inverted). This indicates weakness today within downwards movement from price, and it is interpreted as bullish.
BREADTH – AD LINE
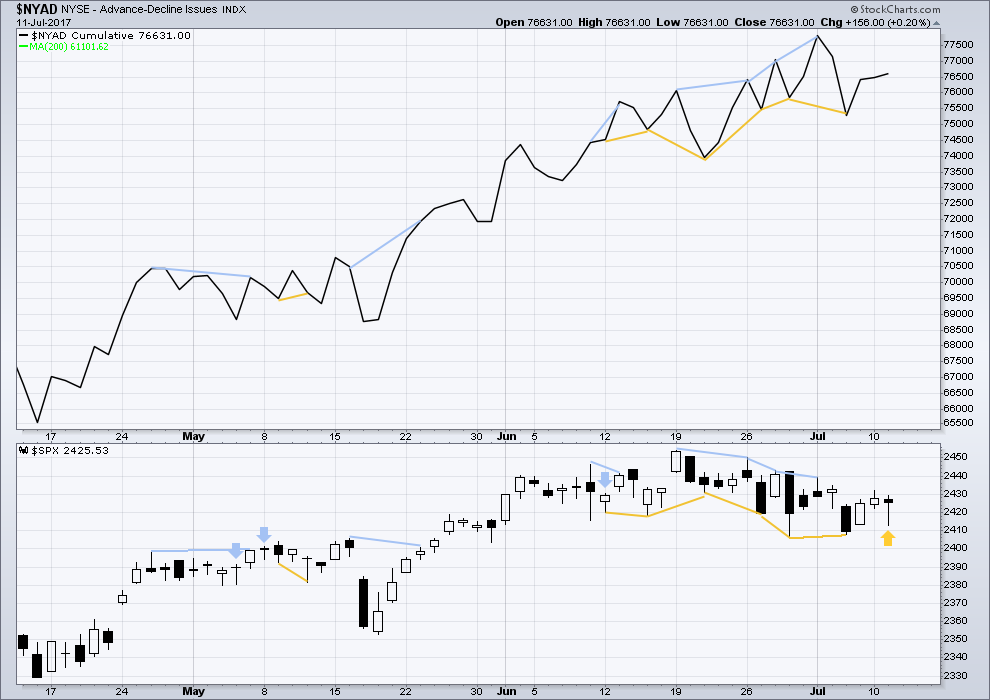
Click chart to enlarge. Chart courtesy of StockCharts.com.
With the last all time high for price, the AD line also made a new all time high. Up to the last high for price there was support from rising market breadth.
There is normally 4-6 months divergence between price and market breadth prior to a full fledged bear market. This has been so for all major bear markets within the last 90 odd years. With no divergence yet at this point, any decline in price should be expected to be a pullback within an ongoing bull market and not necessarily the start of a bear market.
Hidden bullish divergence noted after Thursday’s session has now been followed by two upwards days. It may now be resolved here.
There is the same single day divergence today between price and the AD line as is noted between price and Inverted VIX. Price has moved lower but the AD line increased. This session saw an increase in market breadth, which was not translated into an increase in price. This is interpreted as downwards movement for price during this session being weak, so the divergence is interpreted as bullish.
The mid caps and small caps have made new all time highs along with recent last all time high for large caps. The rise in price is seen across the range of the market, so it has internal strength.
While the market has moved sideways for about a month now, it has been accompanied by new highs in market breadth and improving underlying health as measured by Lowry’s buying power and selling pressure. This sideways correction should be expected to be a normal consolidation within an ongoing healthy bull market.
Historically, almost every bear market is preceded by at least 4-6 months of divergence with price and market breadth. There is no divergence at all at this time. This strongly suggests this old bull market has at least 4-6 months to continue, and very possibly longer.
DOW THEORY
The DJT today has finally made a new all time high. This confirms a continuation of the bull market.
Nasdaq still has not made a new all time high. Modified Dow Theory (adding in technology as a barometer of our modern economy) indicates some weakness at this time within the bull market, but there is zero indication that it is over.
The following lows need to be exceeded for Dow Theory to confirm the end of the bull market and a change to a bear market:
DJIA: 17,883.56.
DJT: 7,029.41.
S&P500: 2,083.79.
Nasdaq: 5,034.41.
Charts showing each prior major swing low used for Dow Theory are here.
This analysis is published @ 12:18 a.m. EST on 12th July, 2017.
Two weeks ago you said wave IV had begun and that it would be a multiweek to multimonth pullback. At the end of last week you said two weeks was too short to be a wave VI–the alternate was that wave IV was already over and we are in wave V. Then early this week you say there’s a breakout in on balance volume and it turns out wave III is not over. It is hard to decide when to open positions when the main wave count is changing so much in so short a time span.
I’m not seeing the point of your comment. You offer no analysis, nothing constructive.
Markets change daily. Traders must be flexible. And I make mistakes. You’ll not find an analyst anywhere who will always get it right.
I’m trying to get it right BEFORE the breakout. That’s the general idea.
If you find this analysis useless then by all means please cancel your membership.
And if you make further non constructive and non helpful comments I’ll do it for you.
I apologize if my comment seemed offensive. I am new to Elliot Wave Technical Analysis and so it is hard for me to grasp how and when you decide to change the wave counts. I do not find the analysis useless, but I am having a hard time identifying the patterns you describe. I have watched your videos and such, but since the actual candlestick movements are much more noisy, I tend to get lost in the clutter. I also have a hard time identifying reliable price and invalidation targets for wave counts.
Just focus on the summary. Do read the rest, but it may take some time to make sense.
Looks like the alternate is the one folks.
This thrust up today does look like a five to me. This could be minuette (iii). The invalidation point can be moved up.
If todays gap is a breakaway gap it should offer support.
Up up and away!
I like it! The sharp impulses down to complete minute Y (of minor four) and minute two were all C waves as we suspected. Just think about it. If we are getting these sharp swift moves down that are counter-trend, what do you think the impulses in a down-trend are going to look like? Lol! The impulses down even had me fooled!
It will be interesting to see if we get any commodity like behaviour for the fifth wave with a break above the acceleration channel. I plan on exiting long trades early and often on the morrow. Let’s hope we hit that 2478 target in very short order.
Thanks for checking in Lara! Updated chart makes it a lot less of a worry holding onto those bullish put spreads. 🙂
You’re welcome.
I’m finding it more difficult in the middle of a cold winter to get up early 🙂 If I’ve had a bad nights sleep, and my son is on school holiday, it’s so tempting to snuggle back down into warmth and get a bit more sleep.
Alarm will be set daily, I can’t keep slacking off!
Now to look for an entry point for a short term buy on the S&P…
I think today’s early update entitles you to several mornings of late snuggling…. 🙂
The upcoming primary wave correction should see an initial explosion in volatility after the primary three top. This is one of those set-ups where if you see a new 52 week low in VIX you know to back up the truck. Typically VIX will make an intra-day low and quickly reverse upwards as the top is put in. I like to open a few speculative “stink bids” in anticipation of the new 52 week low spike down and you know the trade has been executed to perfection when you get filled and the position immediately goes into the green. The August VIX 10.50 calls now at a bid/ask of 2.05/2.15 could easily see a 50% hair-cut on a spike down to a new 52 week low. I am opening an order to buy 100 contracts at a limit of 1.10 in the hope of getting filled as we finish out the primary wave up. At some point during this primary wave down we should see VIX trade somewhere between 15 and 20 points for a possibly 5X or 10X trade. The key is getting filled on the spike down. This can be attempted even with a single contract to get the “feel” of how the trade should be executed.
That’ll be an epic trade! Volatility may gradually pick up ahead of the high so might be smart to grab a few sooner rather than later.
Transports also at new all time highs today so SPX probably sure to follow. If I had noticed that before the close I would have augmented my long positions. As Lara said, up, up, and away!
Yellen’s hedging her bets today in her testimony aligns perfectly with the wave count. I imagine the end of primary four will coincide with an announcement of a pause in the rate hikes, and if it is deep enough (around 38% of the move up) could even foster some talk of more Q.E. I can easily imagine the pandemonium of buying that would incite as everyone rushes to get in on the gravy train, and we rocket (sorry about the mixed metaphors!) toward a blow-off top in a fifth wave up. That ought to be real interesting!
Critical point for the market. Either we continue upward with an impulse toward new ATH or we fill this morning’s gap. Either way I think the meandering should end here and now….
doesn’t look impulsive to me, gap fill would certainly confirm a bull trap, but I believe the nested 1s and 2s is likely off the table for now. Also, we had our 4 Hindenburg Omen in a row yesterday.
There is certainly an artificial look to these relentless pushes higher and I suppose that is what you get from CB pumping. I do expect them to try and make it look legit with at least one more SPX high; if not a ramp into the close, than a phony gap open tomorrow. Still holding (very gingerly!) a few bullish put spreads ahead of the possibility, but with Oh such an itchy trigger finger! 🙂
Maybe we get an outside reversal day tomorrow!
On the Hindenburg omen, I thought that was calculated after the market close. Is there a website you are using for this information? …thanks
Chris said it was yesterday. You can find new NYSE new 52 week highs and lows as well as what the MO did on most financial websites I think.
Market observers eerily quite about that flurry of Hindenburg Omens. It must be all part of the “No Worries!” attitude of traders who remain convinced that Yellen’s got this! 🙂
Well, the omens certainly are ominous. But they’re not going to pick the high. They’re just a warning, and can come weeks before price turns.
Another pice of information to add to the pile.
I’m still expecting we should see contracting buying power, expanding selling pressure and minimum 4 months divergence between price and market breadth before we can say conditions exist for a high to be in place. We have none of that at this time.
I completely agree. This is made even more evident by the fact that we are still completing primary three and so have plenty of time for those topping signals to develop over the next several months while we complete primary four and five. Kudos to Peter for suggesting on several occasions that primary three might not be quite done. It’s funny how I kept fretting that the down-side momentum just did not seem consistent with a trend change at primary degree and failed to consider the obvious- that it wasn’t! 🙂
A failure of SPX to print a new ATH would be very bearish I think…
Give it a bit of time. This may be a slower moving fifth wave.
It does make sense for one completing a primary wave up….
Well, as expected, we have our thrust from the triangle with invalidation of the main hourly count.
This market continues to throw curve balls and do the unexpected so one can never be certain what’s coming next, but I smell a bull trap in the making. While not impossible, a sustained run from these compressed VIX levels seems to me unlikely. I will be slowly unwinding my bullish put spreads during today’s session. Long lower wick on VIX as we speak.
Wow oh wow, how things have changed this morning.
????
relabel – appears to fit. Maybe ends with a slight truncation?
Paul the proportions on your waves do have a bit of a strange look I must say…are they EW labels or are you using a different numbering system?
ha ha,, its mine
Yep. All yours Doc 🙂
Make way for the king! That means you Elmer!