
Last Elliott wave analysis expected downwards movement for the short term. This is not what happened, but upwards movement remains below the invalidation point and within the base channel.
Summary: Expect now a multi week to multi month pullback has begun. The target zone for it to end is about 2,400 to 2,322.
Expect a red daily candlestick when markets open after the 4th of July holiday. The short term target is at 2,390.
If choosing to trade this correction, remember to always use a stop and invest only 1-5% of equity on any one trade. Less experienced members should reduce equity to only 1-3%.
New updates to this analysis are in bold.
Last monthly and weekly charts are here. Last historic analysis video is here.
MAIN ELLIOTT WAVE COUNT
WEEKLY CHART
Click chart to enlarge.
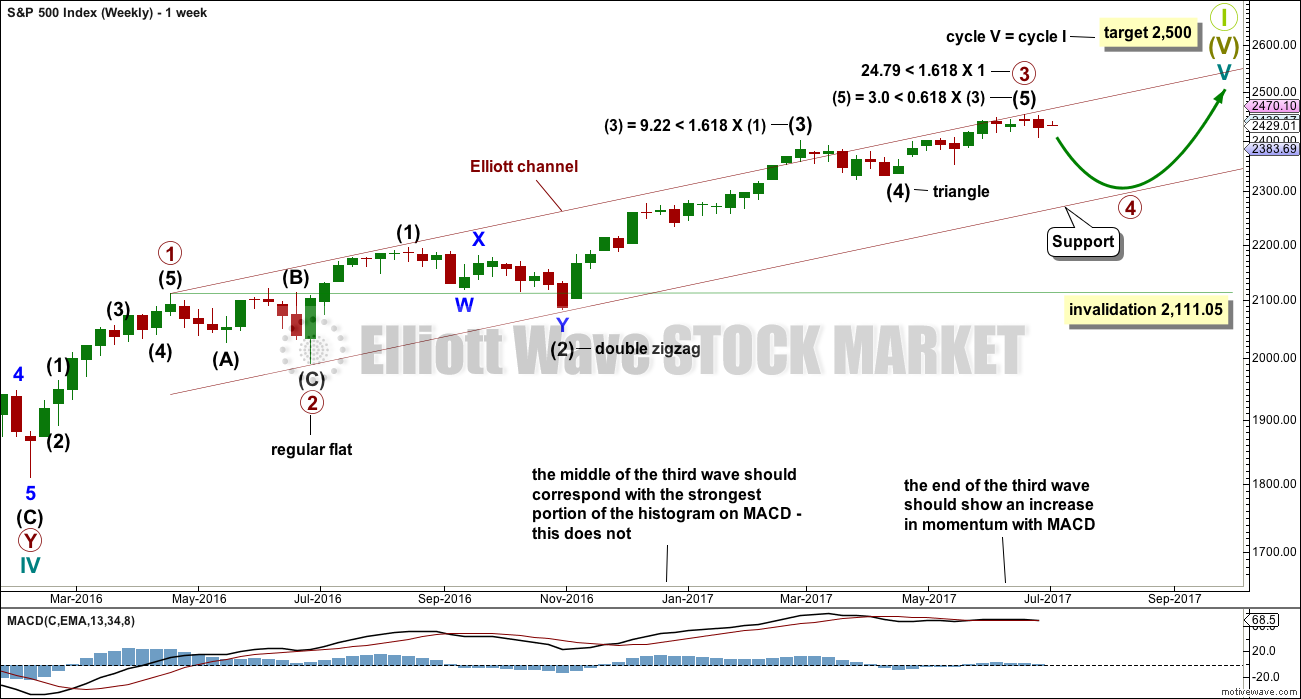
Price has indicated that this should be the main wave count.
Primary wave 4 may now be underway.
Primary wave 2 was a regular flat correction that lasted 10 weeks. Given the guideline of alternation, primary wave 4 may most likely be a single or multiple zigzag or a triangle and may last about a Fibonacci eight or thirteen weeks, so that the wave count has good proportion and the right look. So far it has lasted only one week. This is far too brief to be considered complete or even close to complete.
Primary wave 4 may end within the price territory of the fourth wave of one lesser degree. Intermediate wave (4) has its range from 2,400.98 to 2,322.35.
Primary wave 4 may not move into primary wave 1 price territory below 2,111.05.
DAILY CHART
Click chart to enlarge.
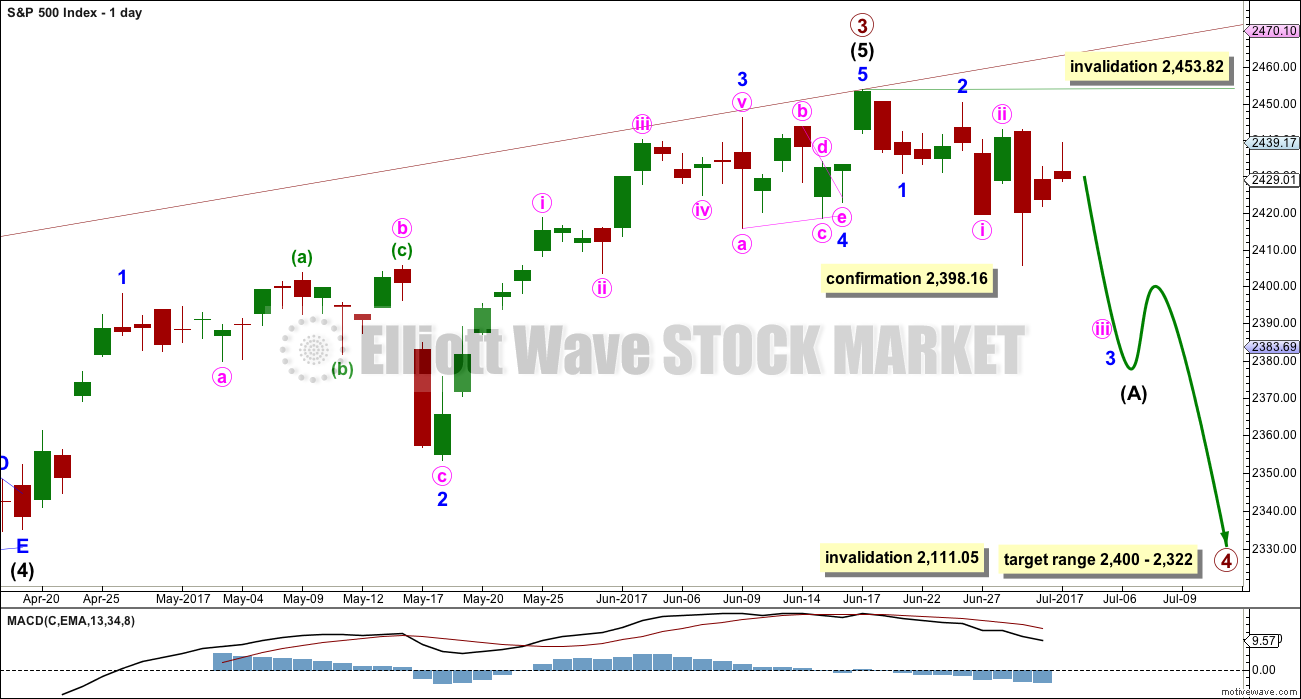
If primary wave 4 unfolds as the more common single or multiple zigzag, then it should begin with a five down at the daily chart level. This is incomplete.
If minor wave 2 is not over, and if it continues any higher (as per the new alternate hourly wave count below), then it may not move beyond the start of minor wave 1 above 2,453.82.
When intermediate wave (A) is complete, then intermediate wave (B) should unfold higher or sideways for at least two weeks.
HOURLY CHART
Click chart to enlarge.
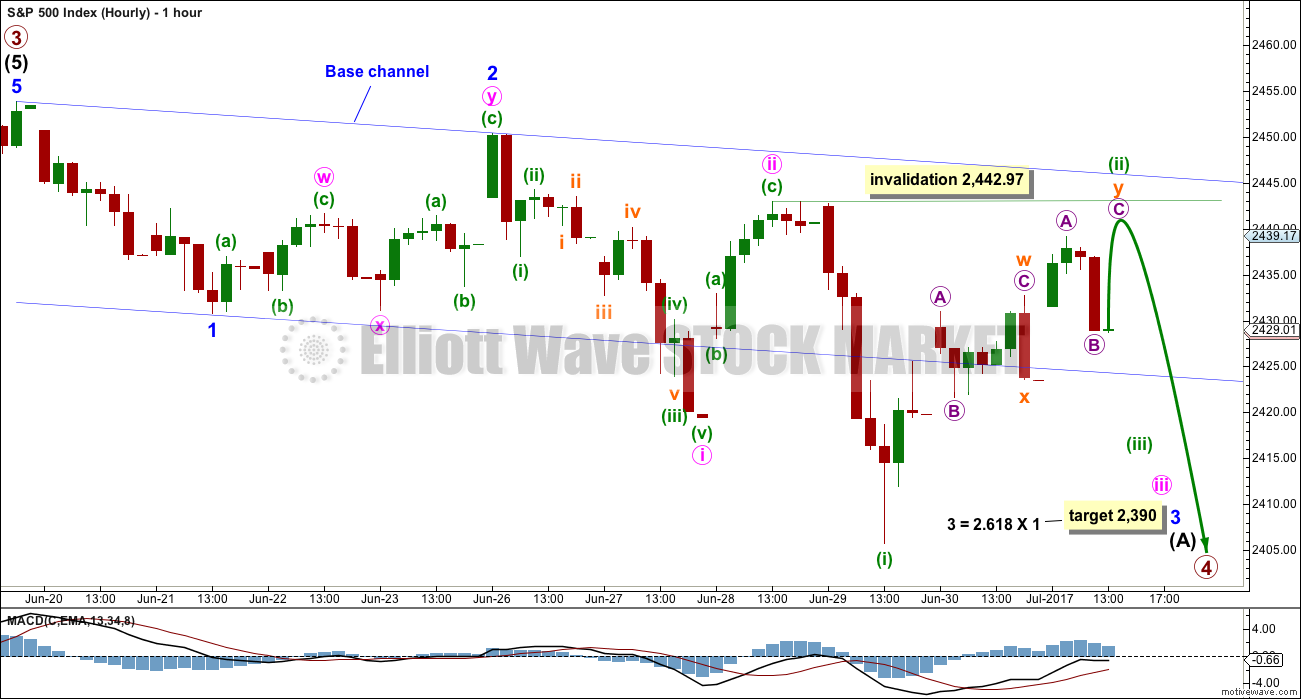
Minuette wave (ii) is another very deep correction.
There are now three overlapping first and second waves downwards. This indicates an increase in downwards momentum should happen this week, if this wave count is correct.
Minuette wave (ii) may not move beyond the start of minuette wave (i) above 2,442.97.
Minuette wave (ii) now looks like an incomplete double zigzag, which requires one more high to complete it. Thereafter, a third wave down at three degrees should begin.
Because minuette wave (ii) is now longer in duration than minute wave ii and is also very deep, an alternate idea is considered below.
At 2,392 minute wave iii would reach 1.618 the length of minute wave i.
ALTERNATE HOURLY CHART
Click chart to enlarge.
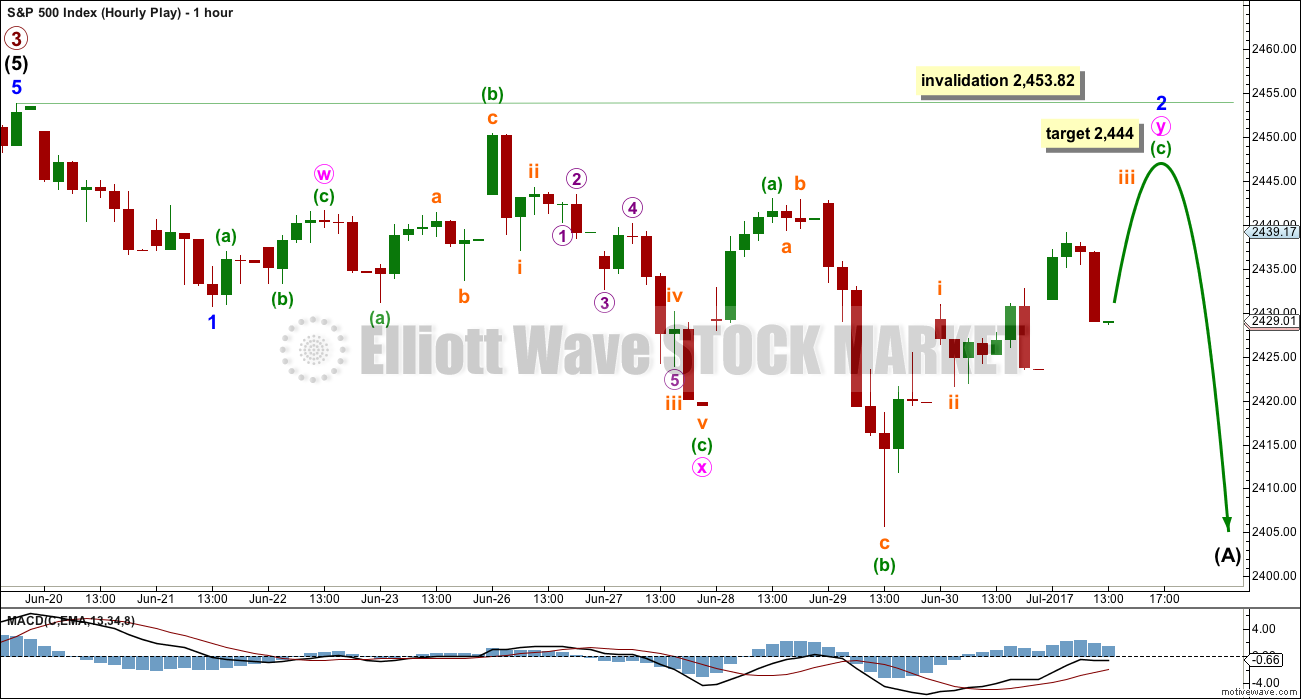
What if minor wave 2 is incomplete? It may be unfolding as an expanded flat or a combination.
Overall, so far minor wave 2 has a downwards slope and not a sideways look to it. This may be redeemed if price moves higher through this week, to complete minuette wave (c) upwards.
There is a convention within Elliott wave that when wave B of a potential expanded flat reaches more than twice the length of wave A, the idea of a flat continuing should be discarded based upon a very low probability. That idea may also be useful in thinking about combinations. When wave X within a combination reaches more than twice the length of wave W (or Y), the idea of a combination continuing should be discarded. Here, minute wave x is 2.04 times the length of minute wave w.
This wave count has a very low probability, but at this stage it is the best alternate that I can find at the hourly chart level.
Minor wave 2 may not move beyond the start of minor wave 1 above 2,453.82.
ALTERNATE ELLIOTT WAVE COUNT
WEEKLY CHART

Click chart to enlarge.
This idea is new. This alternate wave count allows for an even longer more drawn out end to cycle wave V. It may not end until next year.
The current correction may be one degree lower, intermediate wave (4), which may not move into intermediate wave (1) price territory below 2,193.81.
Intermediate wave (2) lasted 11 weeks. Intermediate wave (4) should be in proportion to intermediate wave (2) for the wave count to have the right look. So far intermediate wave (4) has only lasted one week and is now beginning its second. It is far too early to say it could be complete. At its end, it may total a Fibonacci eight or 13 weeks.
TECHNICAL ANALYSIS
WEEKLY CHART
Click chart to enlarge. Chart courtesy of StockCharts.com.
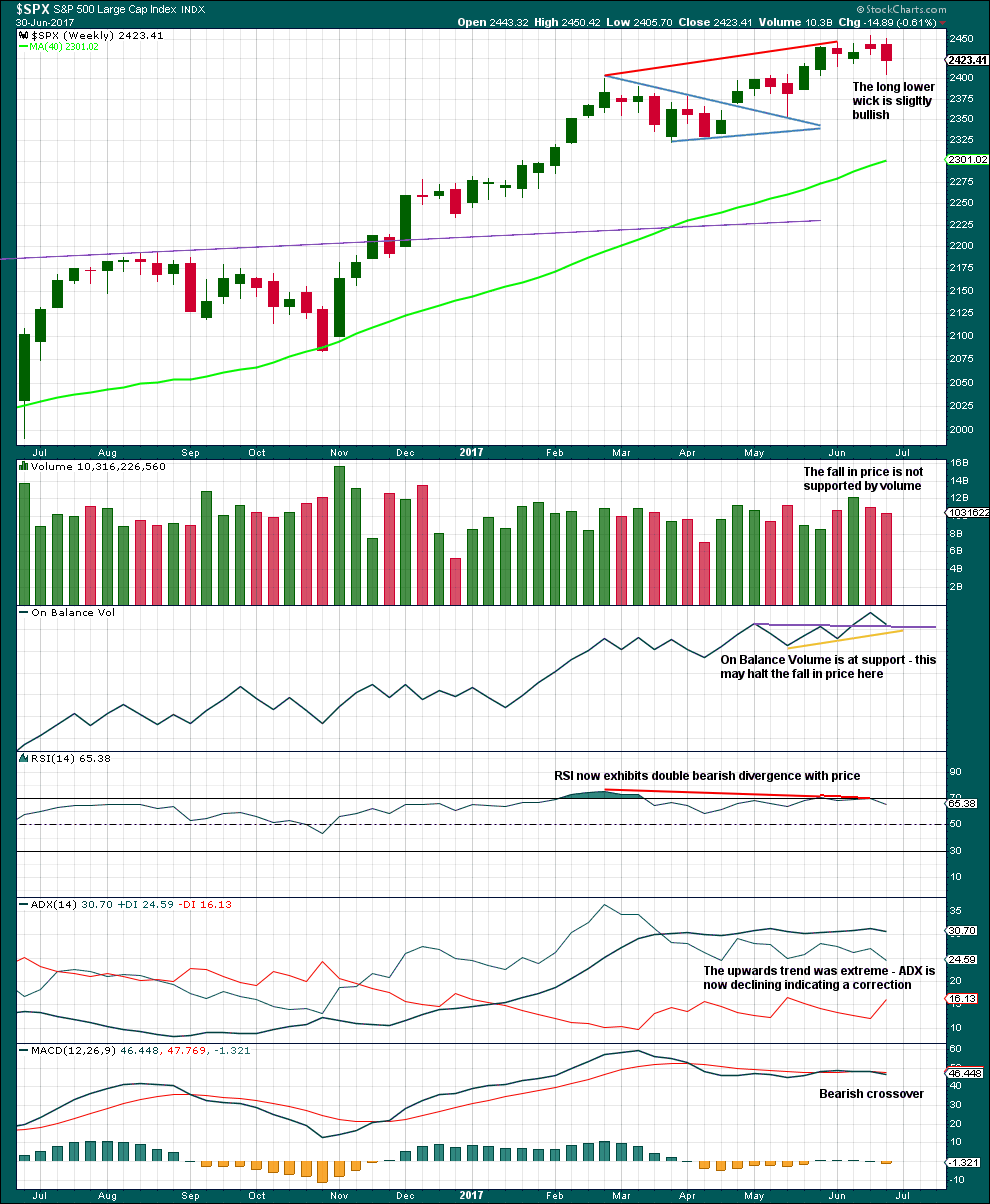
Volume and On Balance Volume last week suggest upwards movement from here. But the purple trend line for On Balance Volume has only been tested twice before, so its significance is only weak.
ADX, RSI and MACD last week point to lower prices in the next few weeks.
DAILY CHART
Click chart to enlarge. Chart courtesy of StockCharts.com.
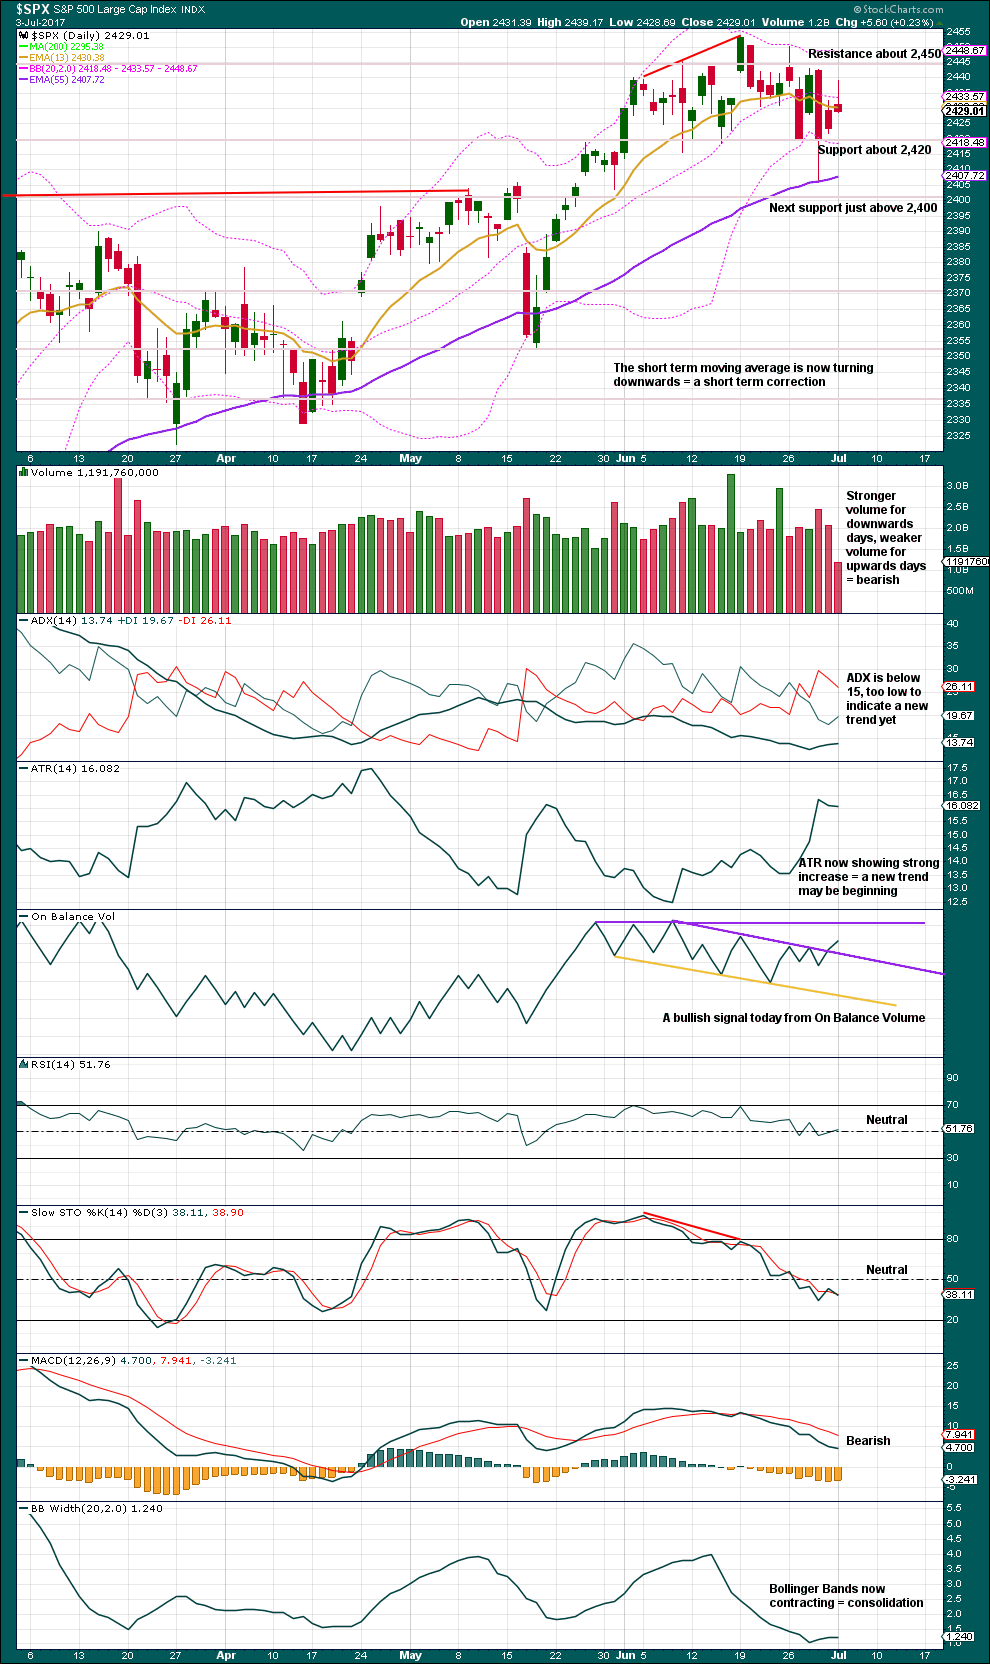
Support at 2,420 is holding.
The long upper wick today is bearish.
The bullish signal from On Balance Volume is not strong. This line has a reasonable slope. But it has been tested four times before and is reasonably long held, so it is not a weak signal either.
If ADX reaches to 15, it would signal a downwards trend in place.
VOLATILITY – INVERTED VIX CHART
Click chart to enlarge. Chart courtesy of StockCharts.com.
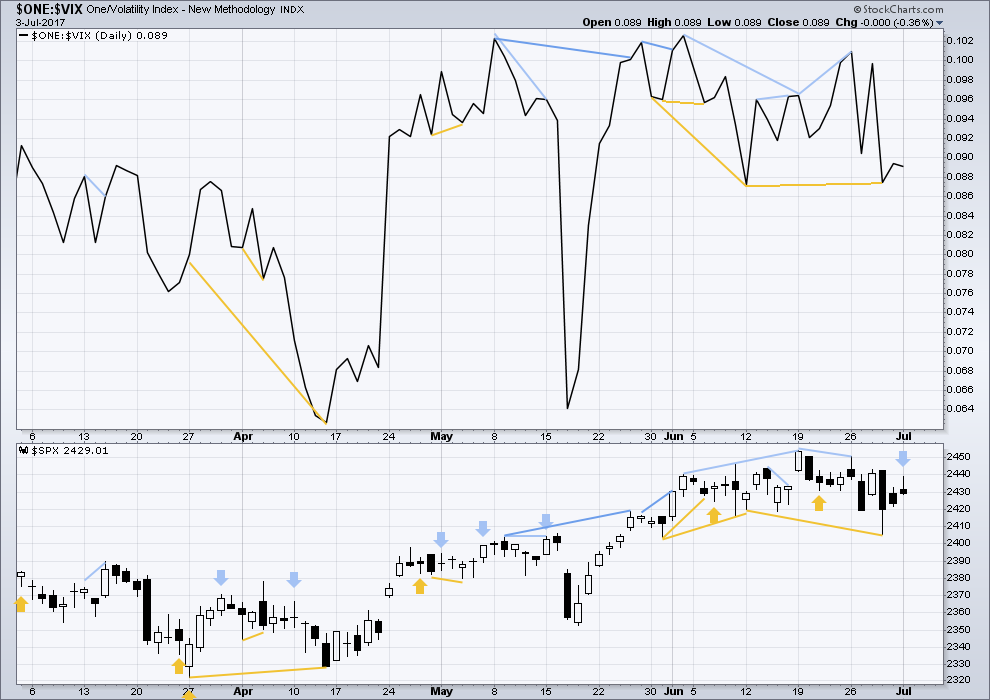
Normally, volatility should decline as price moves higher and increase as price moves lower. This means that normally inverted VIX should move in the same direction as price.
Short term bullish divergence noted two sessions ago has now been followed by two upwards days. It may now be considered resolved.
There is single day bearish divergence today: price moved higher, with a higher high and a higher low, but volatility increased. Upwards movement did not show a normal decline in volatility during the session, so there was weakness today within price.
BREADTH – AD LINE
Click chart to enlarge. Chart courtesy of StockCharts.com.
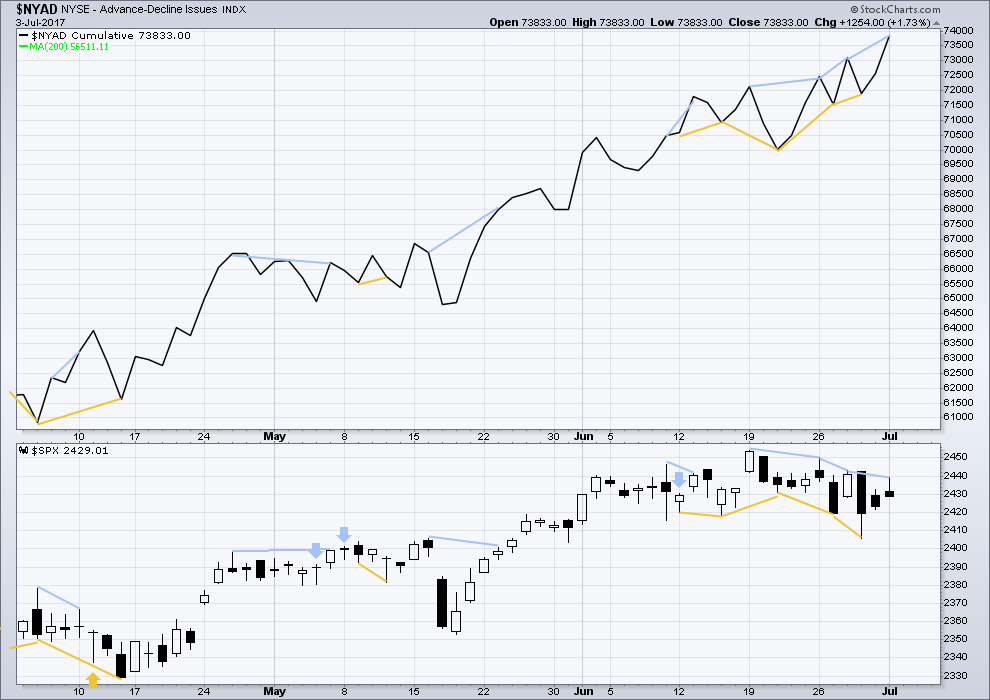
With the last all time high for price, the AD line also made a new all time high. Up to the last high for price there was support from rising market breadth.
There is normally 4-6 months divergence between price and market breadth prior to a full fledged bear market. This has been so for all major bear markets within the last 90 odd years. With no divergence yet at this point, any decline in price should be expected to be a pullback within an ongoing bull market and not necessarily the start of a bear market.
Bullish divergence noted in analysis two sessions ago has now been followed by two days of upwards movement. It may now be considered resolved.
There is new bearish divergence between price and the AD line today: while the AD line made a new all time high, price has not made a corresponding new high. This indicates weakness today within price. The rise in market breadth could not be translated into a corresponding rise in price.
The mid caps and small caps have made new all time highs along with recent last all time high for large caps. The rise in price is seen across the range of the market, so it has internal strength.
However, there is now some weakness becoming evident within small and mid caps. The number of equities down 20% or more from their all time highs is greatest in small caps, next in mid caps, and least in large caps. This is only an early sign of weakness developing.
Historically, almost every bear market is preceded by at least 4-6 months of divergence with price and market breadth. There is no divergence at all at this time. This strongly suggests this old bull market has at least 4-6 months to continue, and very possibly longer.
DOW THEORY
The DJT today has finally made a new all time high. This confirms a continuation of the bull market.
Nasdaq still has not made a new all time high. Modified Dow Theory (adding in technology as a barometer of our modern economy) indicates some weakness at this time within the bull market, but there is zero indication that it is over.
The following lows need to be exceeded for Dow Theory to confirm the end of the bull market and a change to a bear market:
DJIA: 17,883.56.
DJT: 7,029.41.
S&P500: 2,083.79.
Nasdaq: 5,034.41.
Charts showing each prior major swing low used for Dow Theory are here.
This analysis is published @ 08:57 p.m. EST.
Sometimes third waves start out slow. But this is getting a bit ridiculously slow.
With the slight new low before upwards movement today I’m going to now label minuette wave (ii) over. Otherwise it would technically have to be a double combination, and it doesn’t have a sideways look to it. It has an upwards slope like a zigzag.
So it looks over now.
I exited all my short positions today. Something about the price action does not seem quite right. The long lower wicks and inability to take out the 2420.00 support area suggest something else may be going on. I like to pay close attention to those long lower wick as they almost always presage more upward movement and that is also what has been happening after sideways lingering of late. I will wait for a surrender of 2420 on high volume for a more reliable entry. Took a small loss today as I was loaded for bear, so to speak! 🙂
Today I once more learned the futility of trying to trend trade this market. Rather than take profits on my short positions on this morning’s move down, I allowed myself to be whipsawed (once again!) and watch what should have been a decent profit turn into a small loss. The banksters have really made us all pretty much day traders and that is all there is to it. I have seen this often enough to know not to leave profits sitting in the market. 🙁
I think I will leave the indices be for a bit until we see some real downside momentum. Sticking with oil and automotive where trends can be more reliably traded. Anybody saw that plunge in ORLY today? From the topping pattern, I suspect there is much more downside after a relief bounce.
No third wave down today it would seem. Proportions for a continuing second wave not really a bit peculiar. Wondering about the tenacity around 2400.00 I would have expected an impulsive down-trend to have taken that level out already so it looks like something else is afoot.
Yes.
Things that make you go “hmmmmm”
lots of Robots banging around in my opinion, some sort of headline to kick it off will do just fine
I had an S&P analysis published in the last MTA newsletter, “Technically Speaking” if anyone wants to check that out here.
Congrats!!
Always nice to get published! 🙂
Whew! Foist!
wow look at that wabbit go,, happy 4th all you mericans