
A downwards session was expected for Thursday. This is exactly what happened.
Summary: Expect now a multi week to multi month pullback has begun. The target zone for it to end is about 2,400 to 2,322.
The situation is unclear for tomorrow’s session. Volume and On Balance Volume are bearish, but the long lower candlestick wick along with divergence between price and the AD line and inverted VIX is bullish. Use the base channel on the hourly chart as your guide: expect downwards movement while price is below the lower edge or look for a deep bounce if price moves back into the channel.
If choosing to trade this correction, remember to always use a stop and invest only 1-5% of equity on any one trade. Less experienced members should reduce equity to only 1-3%.
New updates to this analysis are in bold.
Last monthly and weekly charts are here. Last historic analysis video is here.
MAIN ELLIOTT WAVE COUNT
WEEKLY CHART
Click chart to enlarge.
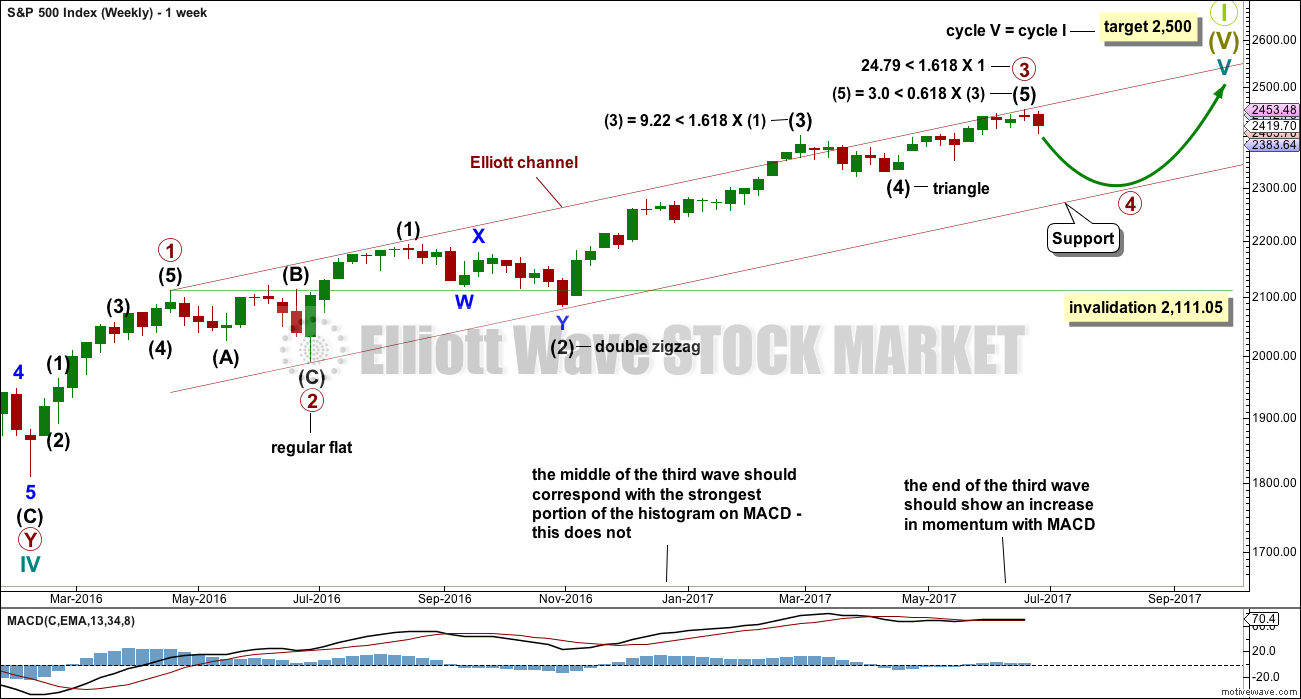
Price has indicated that this should be the main wave count.
Primary wave 4 may now be underway.
Primary wave 2 was a regular flat correction that lasted 10 weeks. Given the guideline of alternation, primary wave 4 may most likely be a single or multiple zigzag or a triangle and may last about a Fibonacci eight or thirteen weeks, so that the wave count has good proportion and the right look. So far it has lasted only one week. This is far too brief to be considered complete or even close to complete.
Primary wave 4 may end within the price territory of the fourth wave of one lesser degree. Intermediate wave (4) has its range from 2,400.98 to 2,322.35.
Primary wave 4 may not move into primary wave 1 price territory below 2,111.05.
DAILY CHART
Click chart to enlarge.
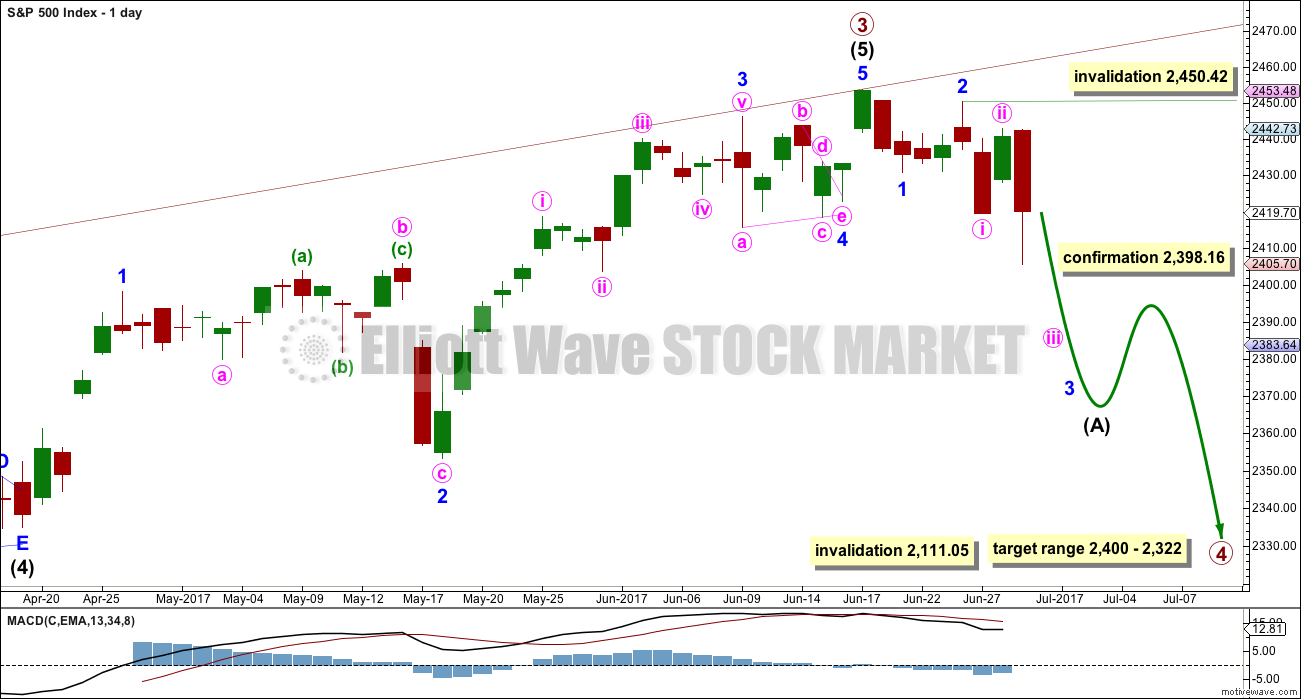
If primary wave 4 unfolds as the more common single or multiple zigzag, then it should begin with a five down at the daily chart level. This is incomplete.
So far minor waves 1 and 2 may be complete. Minute wave ii may not move beyond the start of minute wave i above 2,450.42.
When intermediate wave (A) is complete, then intermediate wave (B) should unfold higher or sideways for at least two weeks.
HOURLY CHART
Click chart to enlarge.
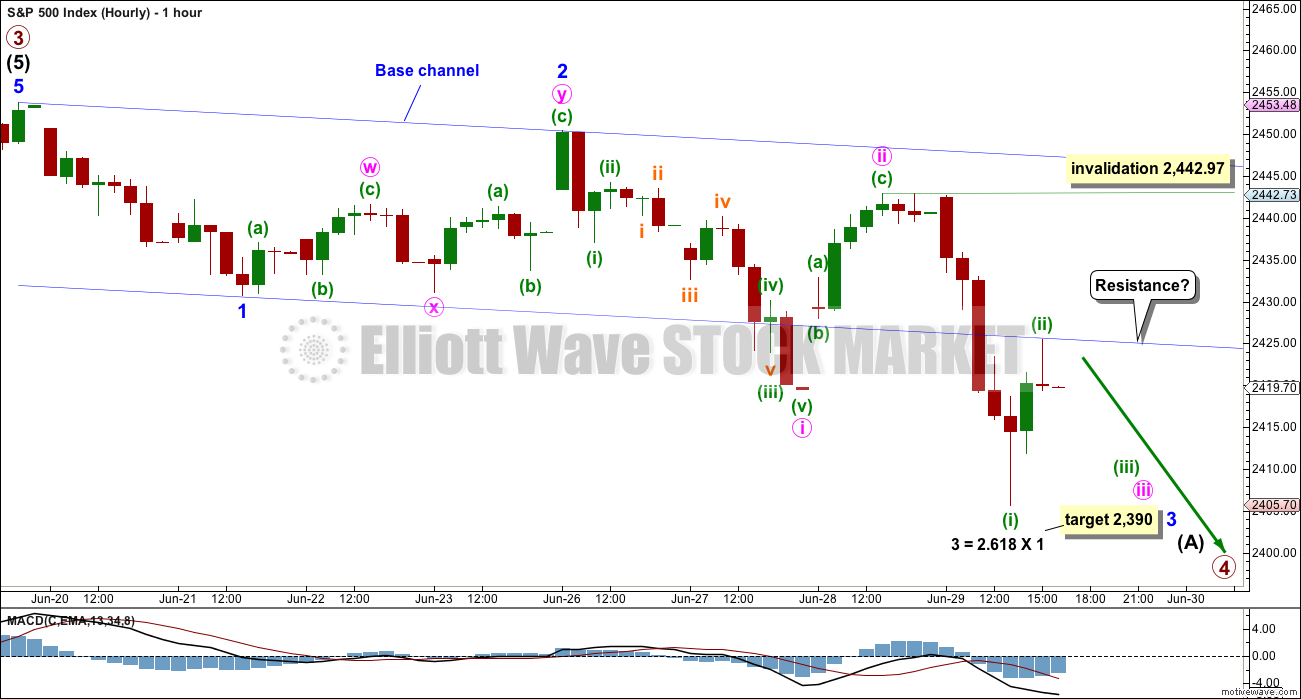
Price has broken again below the lower edge of the base channel, and at the end of today’s session the lower edge now appears to be providing resistance. This may continue tomorrow. If it does, then look out for a strong increase in downwards momentum.
If price breaks back up to within the base channel, then expect minuette wave (ii) is continuing higher. It may not move beyond the start of minuette wave (i) above 2,442.97. The Gravestone doji at the high of minuette wave (ii) suggests that this bounce is over here at resistance.
The target for minor wave 3 is now recalculated.
At 2,392 minute wave iii would reach 1.618 the length of minute wave i.
ALTERNATE ELLIOTT WAVE COUNT
WEEKLY CHART
Click chart to enlarge.
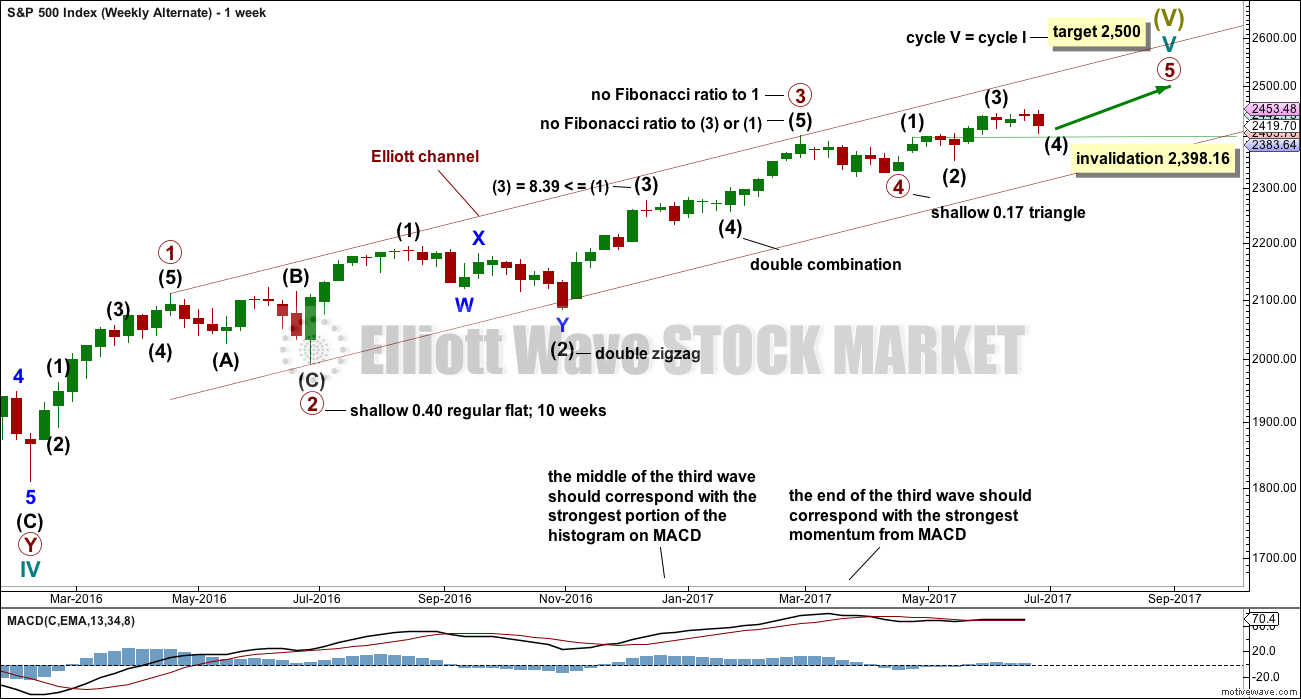
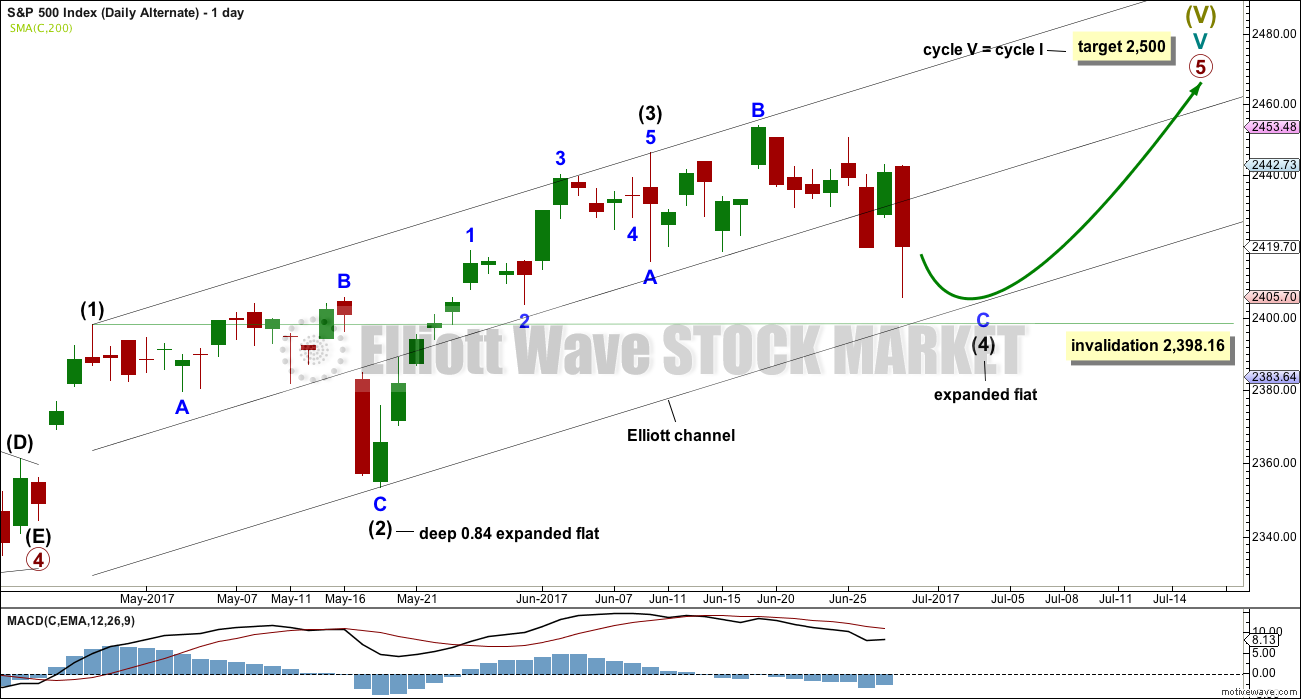
This wave count is an unlikely alternate.
Primary wave 3 may be complete. Primary wave 5 may be close to an end. Within primary wave 5, intermediate wave (4) may not move into intermediate wave (1) price territory below 2,398.16.
DAILY CHART
Click chart to enlarge.
If primary wave 5 is unfolding as an impulse, then within it there is no longer any alternation between the structures of intermediate waves (2) and (4); both would be expanded flat corrections. This has substantially reduced the probability of this alternate.
Minor wave C must complete as a five wave impulse. This alternate wave count requires more downwards movement for the structure of minor wave C to complete. There is no divergence at this stage in expected direction between the two wave counts.
TECHNICAL ANALYSIS
WEEKLY CHART
Click chart to enlarge. Chart courtesy of StockCharts.com.
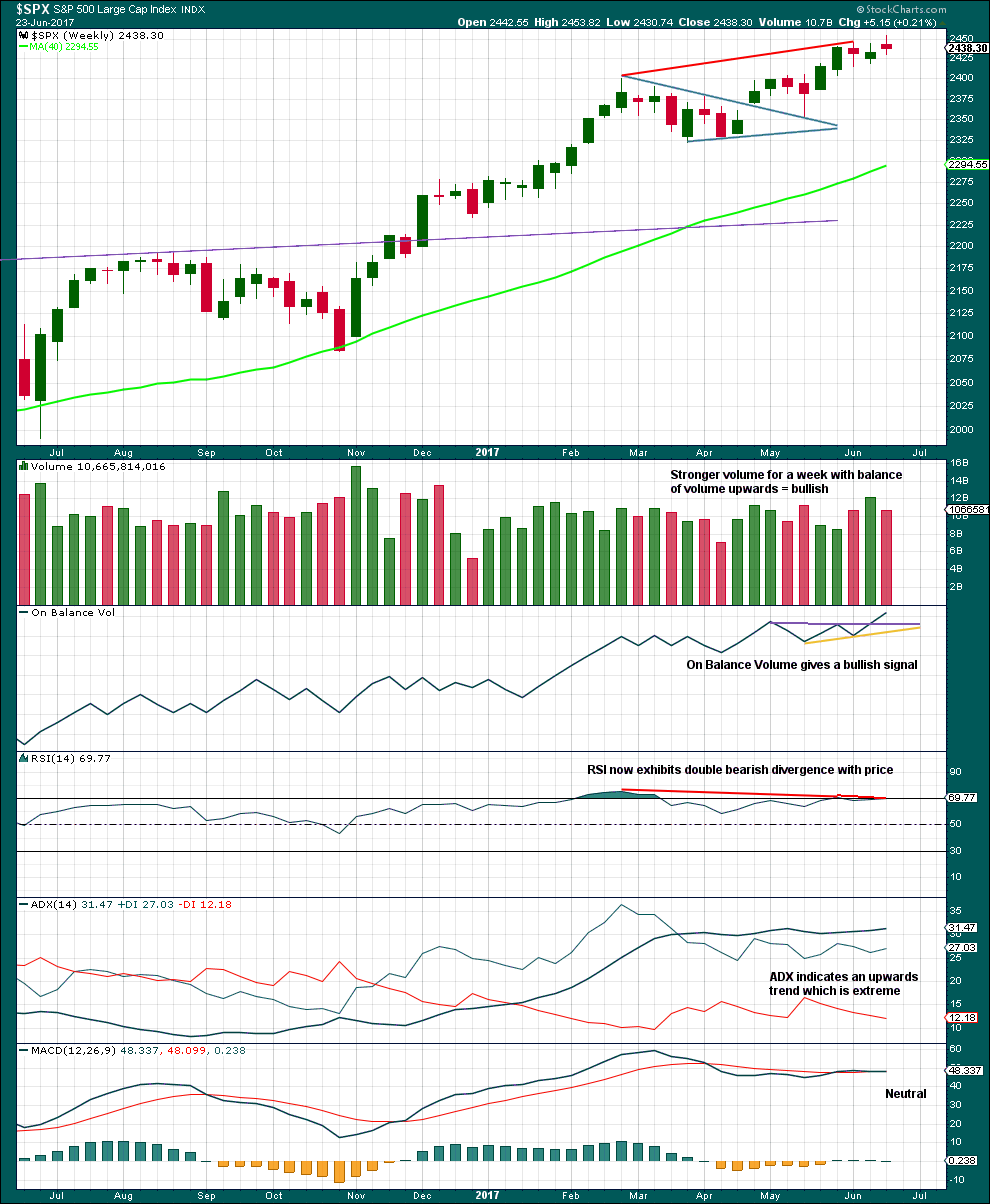
Price is moving higher with a higher high and a higher low, but upwards movement is weak. Volume is light and the candlestick is a small spinning top pattern.
The bullish signal from On Balance Volume has proven this time to be false. Unfortunately, there is nothing within technical analysis which always works. While On Balance Volume works far more often than it fails, it is not 100% reliable.
DAILY CHART
Click chart to enlarge. Chart courtesy of StockCharts.com.
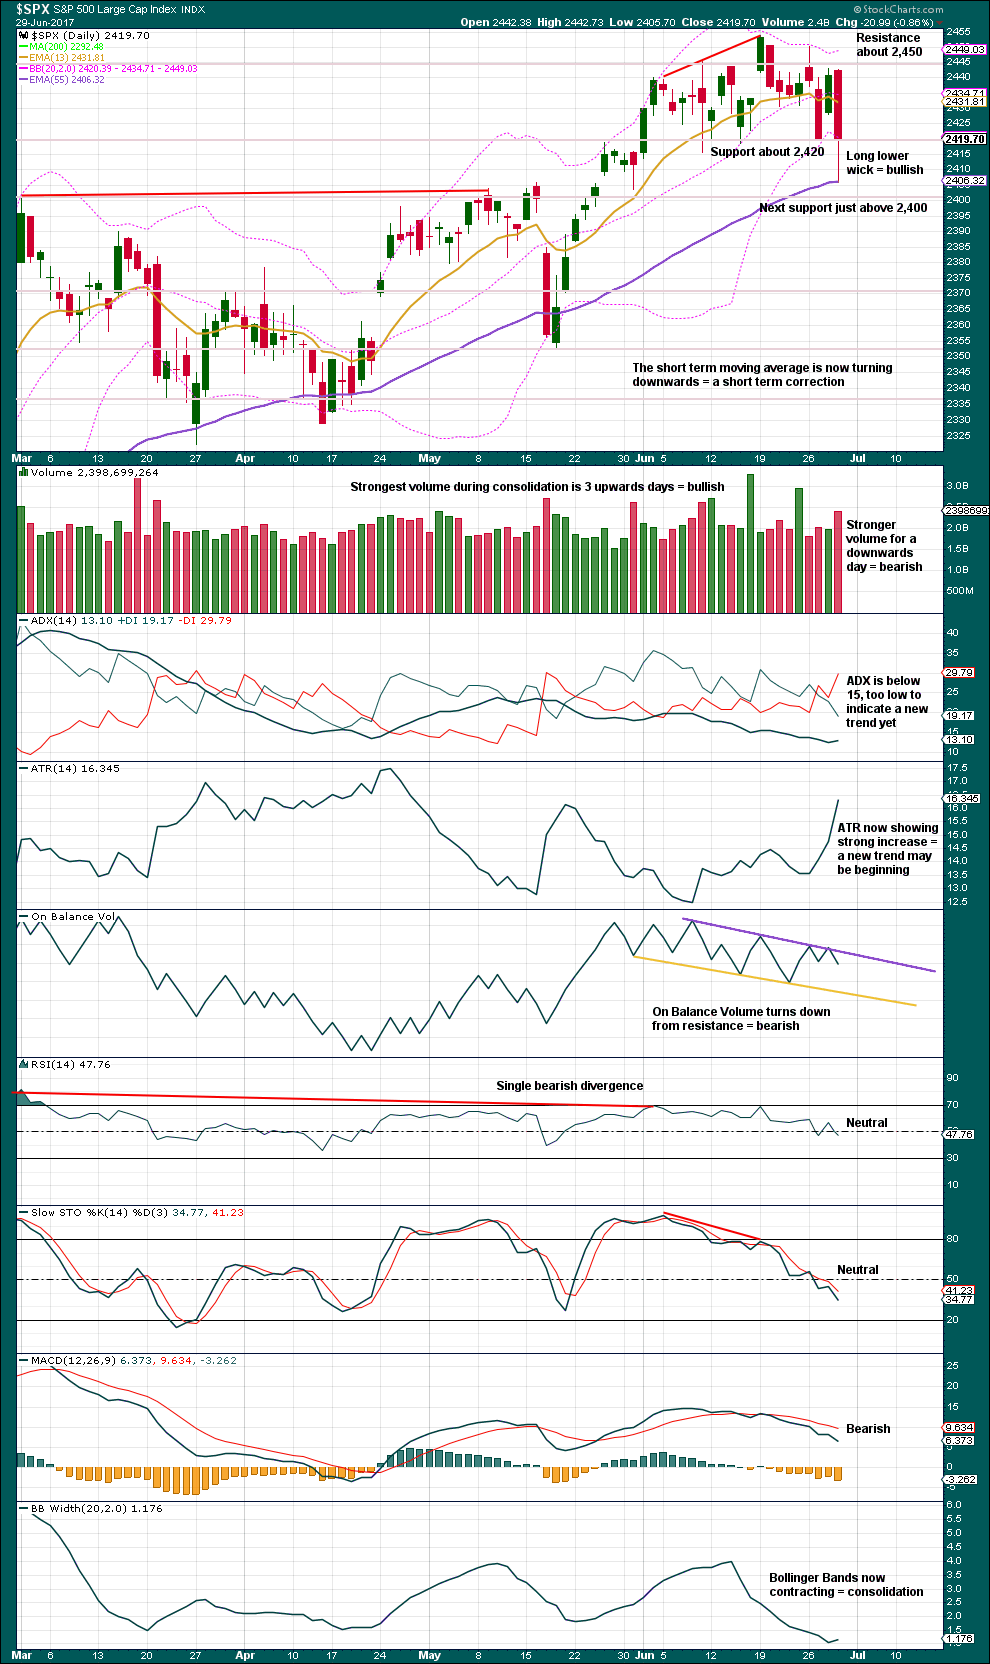
Support about 2,420 is now breaking down. It may now be offering resistance.
The long lower wick today is bullish, but the support from volume is bearish.
Increasing ATR offers support to the idea of a new downwards trend. If ADX reaches above 15, it would indicate a new downwards trend in the very early stages.
The purple resistance line for On Balance Volume has now been tested four times. It now offers some reasonable technical significance. Give weight to this bearish signal today from On Balance Volume.
The only thing that is unusual at this stage is contracting Bollinger Bands as price moves strongly lower. This suggests the pullback may possibly be more short lived than the Elliott wave count expects. If Bollinger Bands begin to widen though, that would fit the Elliott wave count neatly.
VOLATILITY – INVERTED VIX CHART
Click chart to enlarge. Chart courtesy of StockCharts.com.
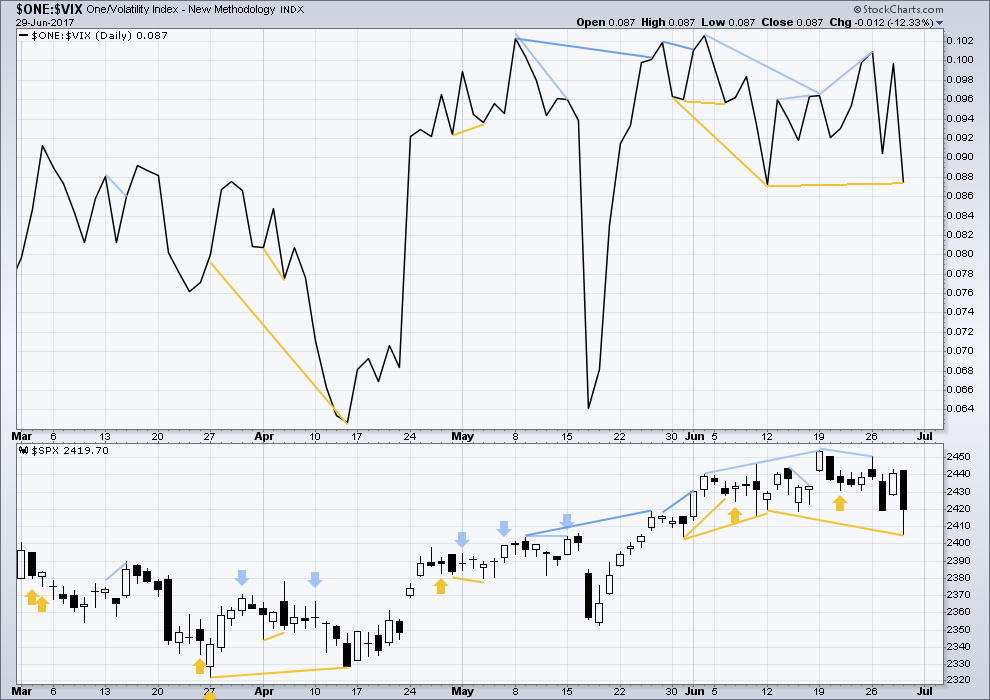
Normally, volatility should decline as price moves higher and increase as price moves lower. This means that normally inverted VIX should move in the same direction as price.
There is new short term bullish divergence today between price and inverted VIX: price has made a new low below the low of the 12th of June, but inverted VIX has not. This indicates weakness within downwards movement today because it lacks a normal increase in volatility (also seen in Bollinger Band contraction). However, this divergence is weak, so it is not given much weight today in this analysis.
BREADTH – AD LINE
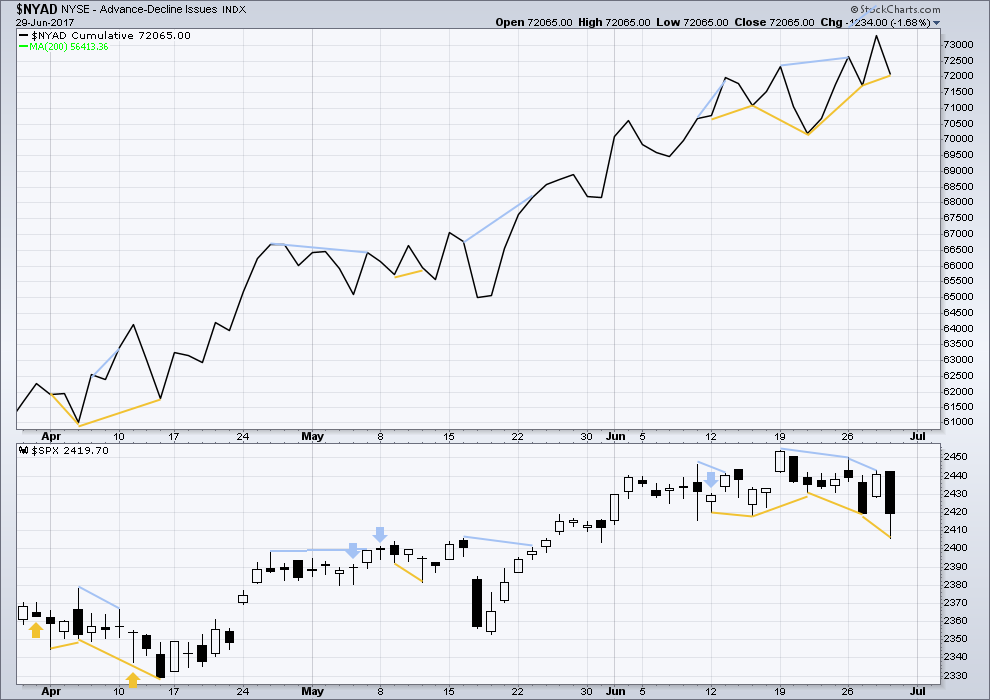
Click chart to enlarge. Chart courtesy of StockCharts.com.
With the last all time high for price, the AD line also made a new all time high. Up to the last high for price there was support from rising market breadth.
There is normally 4-6 months divergence between price and market breadth prior to a full fledged bear market. This has been so for all major bear markets within the last 90 odd years. With no divergence yet at this point, any decline in price should be expected to be a pullback within an ongoing bull market and not necessarily the start of a bear market.
There is new bullish divergence today between price and the AD line: price has made a new low below the prior low of the 27th of June, but the AD line has not made a corresponding new low. This divergence indicates weakness within downwards movement today because it lacks support from a decline in market breadth.
The mid caps and small caps have made new all time highs along with recent last all time high for large caps. The rise in price is seen across the range of the market, so it has internal strength.
However, there is now some weakness becoming evident within small and mid caps. The number of equities down 20% or more from their all time highs is greatest in small caps, next in mid caps, and least in large caps. This is only an early sign of weakness developing.
DOW THEORY
At the end of last week, DJIA and the S&P500 have all made new all time highs. DJT and Nasdaq last week did not make new all time highs. However, at this stage, that only indicates some potential weakness within the ongoing bull market and absolutely does not mean that DJT and Nasdaq may not yet make new all time highs, and it does not mean a bear market is imminent.
The following lows need to be exceeded for Dow Theory to confirm the end of the bull market and a change to a bear market:
DJIA: 17,883.56.
DJT: 7,029.41.
S&P500: 2,083.79.
Nasdaq: 5,034.41.
Charts showing each prior major swing low used for Dow Theory are here.
This analysis is published @ 07:13 p.m. EST.
Good morning Lara. Waiting for the open next week to confirm the count in order to put on a short. Looks like wave 3 will be confirmed to have ended at 1451 if we break below this last low. Is target for this wave 4 correction closer to 2300 in your view?
hourly chart updated:
price is back within the base channel. minuette (ii) now completing.
when it is done this count expects a good increase in downwards momentum for the middle of a third wave.
Thanks Lara!
One of the great benefits of having an EW analyst who knows what she is doing is that it helps to keep you from getting ambushed. I looked at that run-up into the close today and thought to my-self : ” Who the hell are you guys kidding?!”
I tracked the feint all the way up to 2432.15 on the one minute chart and added to my short positions on the second red candle at 2431.15, and sure enough, you saw what happened. They dislodged a lot of short positions at the close ahead of a probable third wave down. They know what’s a’coming.
Have a great week-end everyone!
PS You can make some spectacular trades during the initial stages of a trend change from up to down with these manic second waves. It is tough as shorting the spikes up is counter-intuitive but they present opportunities for some of the fastest gains you can make trading. I do it with complete confidence following Lara’s counts.
I am always thrown off by lower degree second waves that take as much time and travel a similar distance to one of higher degree. I have seen it now often enough to know that it is a legitimate count but it never fails to make me doubt its legitimacy when it is developing. Maybe one day I’ll get used to it…. 🙂
Psychologically we’re fighting our own nature here. Not sure you can get used to it.
I think discipline; having a plan and sticking to it, along with good risk management, is the answer.
If the main count is confirmed by a move below 2400 and VIX remains suppressed, a long volatility trade will be the best R/R trade in this market. A primary degree correction is almost certain to force an unwind of the massive short vol trade accumulated the past 8 months.
I know the count is unlikely, but the alternate is actually what I was thinking when I mistakenly said P3 might not be over. An approaching conclusion to intermediate four would sync well with what VIX did today.
EGAD!
That would mean….the end is near!!! 🙂
2 in a row
What’s with the hurry, Doc?