
A downwards day was expected for Wednesday, but this did not happen. Upwards movement invalidated the hourly Elliott wave count.
Summary: Expect now a multi week to multi month pullback has begun. The target zone for it to end is about 2,400 to 2,322. Expect downwards movement for tomorrow’s session: short term volume profile is bearish, On Balance Volume is at resistance, long upper candlestick wicks for three days are bearish, and AD line exhibits bearish divergence.
If choosing to trade this correction, remember to always use a stop and invest only 1-5% of equity on any one trade. Less experienced members should reduce equity to only 1-3%.
New updates to this analysis are in bold.
Last monthly and weekly charts are here. Last historic analysis video is here.
MAIN ELLIOTT WAVE COUNT
WEEKLY CHART
Click chart to enlarge.
Price has indicated that this should be the main wave count.
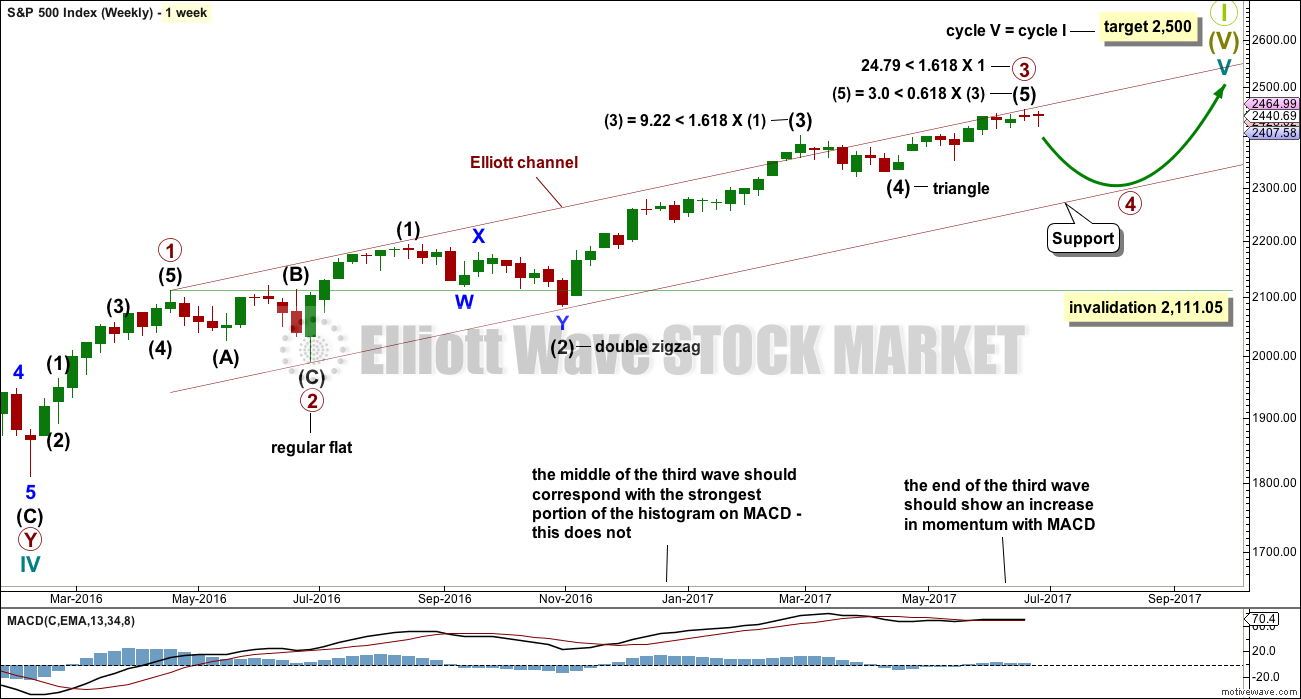
Primary wave 4 may now be underway.
Primary wave 2 was a regular flat correction that lasted 10 weeks. Given the guideline of alternation, primary wave 4 may most likely be a single or multiple zigzag or a triangle and may last about a Fibonacci eight or thirteen weeks, so that the wave count has good proportion and the right look.
Primary wave 4 may end within the price territory of the fourth wave of one lesser degree. Intermediate wave (4) has its range from 2,400.98 to 2,322.35.
Primary wave 4 may not move into primary wave 1 price territory below 2,111.05.
DAILY CHART
Click chart to enlarge.
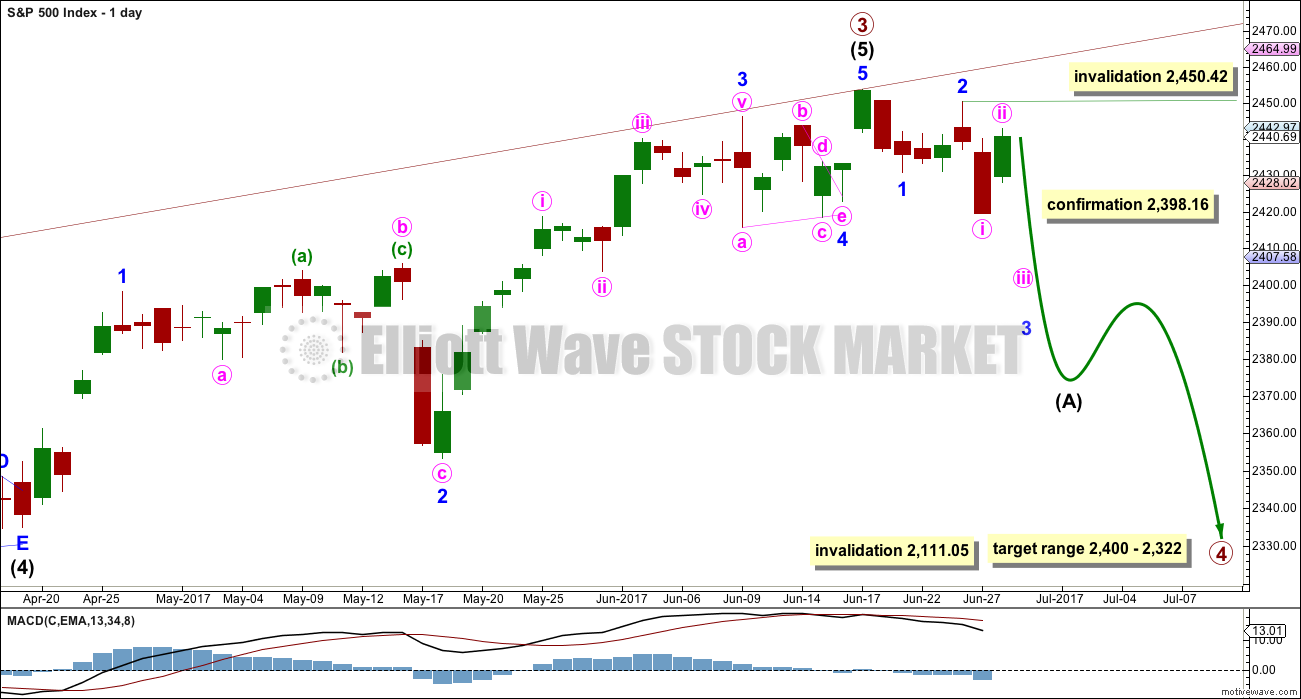
If primary wave 4 unfolds as the more common single or multiple zigzag, then it should begin with a five down at the daily chart level. This is incomplete.
So far minor waves 1 and 2 may be complete. Minute wave ii may not move beyond the start of minute wave i above 2,450.42.
When intermediate wave (A) is complete, then intermediate wave (B) should unfold higher or sideways for at least two weeks.
HOURLY CHART
Click chart to enlarge.
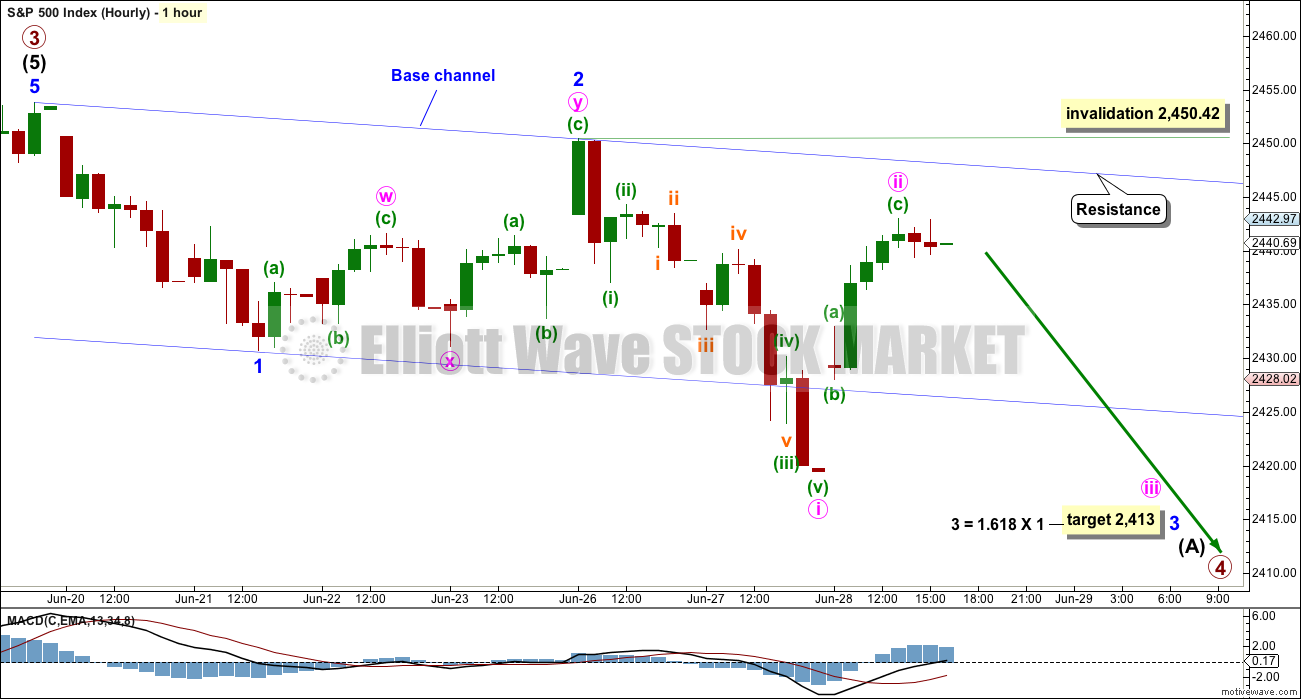
The lower edge of the base channel did not provide resistance. Price gapped up back to within the channel at the open of the session.
If minute wave ii continues higher, then it should find very strong resistance at the upper edge of the channel. Lower degree second wave corrections should remain within base channels drawn about first and second waves one or more degrees higher.
Minute wave ii may not move beyond the start of minute wave i above 2,450.42.
Minute wave iii within minor wave 3 should exhibit a strong increase in downwards momentum. If it is extended, then the subdivisions within it would also be extended in time, showing up possibly on the daily chart.
ALTERNATE ELLIOTT WAVE COUNT
WEEKLY CHART
Click chart to enlarge.
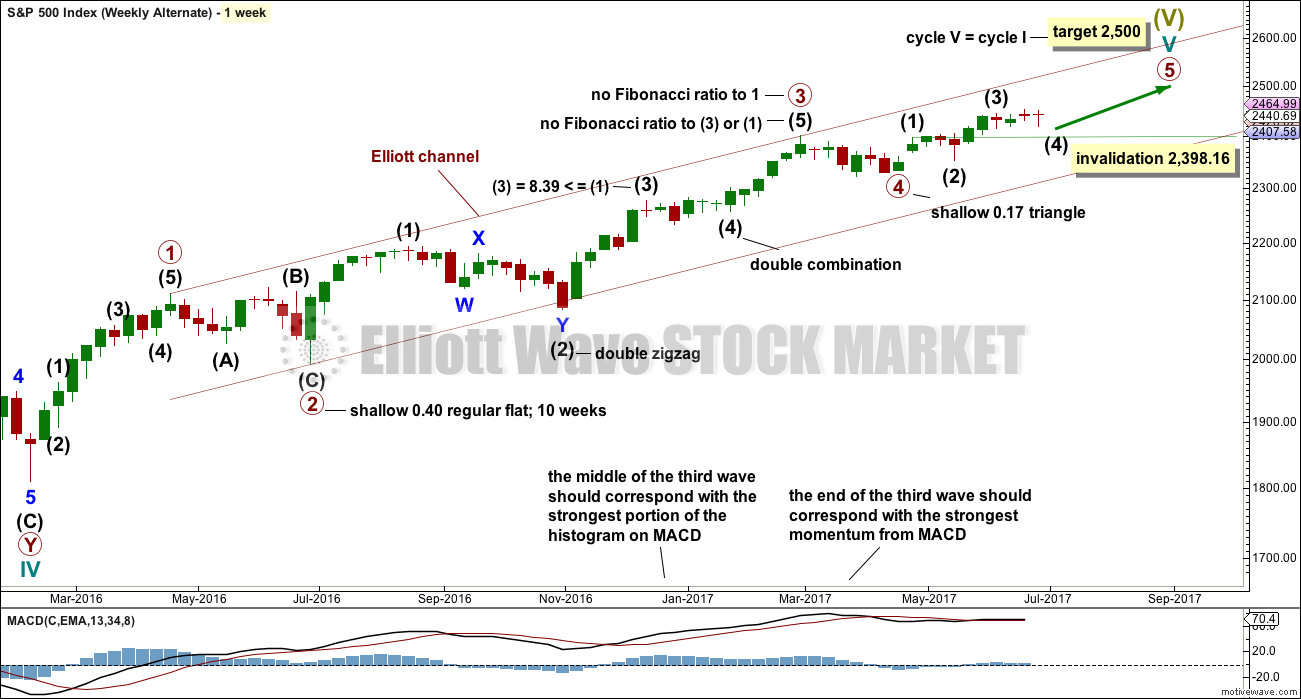
This wave count is an unlikely alternate.
Primary wave 3 may be complete. Primary wave 5 may be close to an end. Within primary wave 5, intermediate wave (4) may not move into intermediate wave (1) price territory below 2,398.16.
DAILY CHART
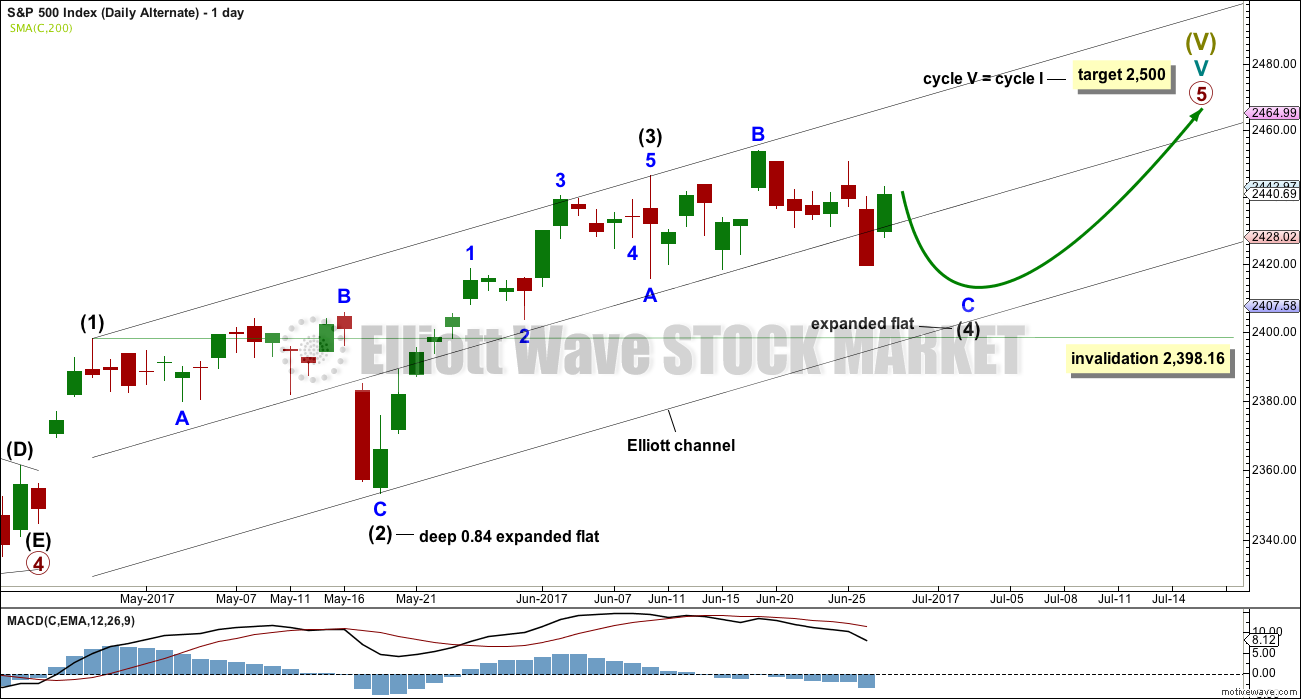
Click chart to enlarge.
If primary wave 5 is unfolding as an impulse, then within it there is no longer any alternation between the structures of intermediate waves (2) and (4); both would be expanded flat corrections. This has substantially reduced the probability of this alternate.
Minor wave C must complete as a five wave impulse. This alternate wave count requires more downwards movement for the structure of minor wave C to complete. There is no divergence at this stage in expected direction between the two wave counts.
TECHNICAL ANALYSIS
WEEKLY CHART
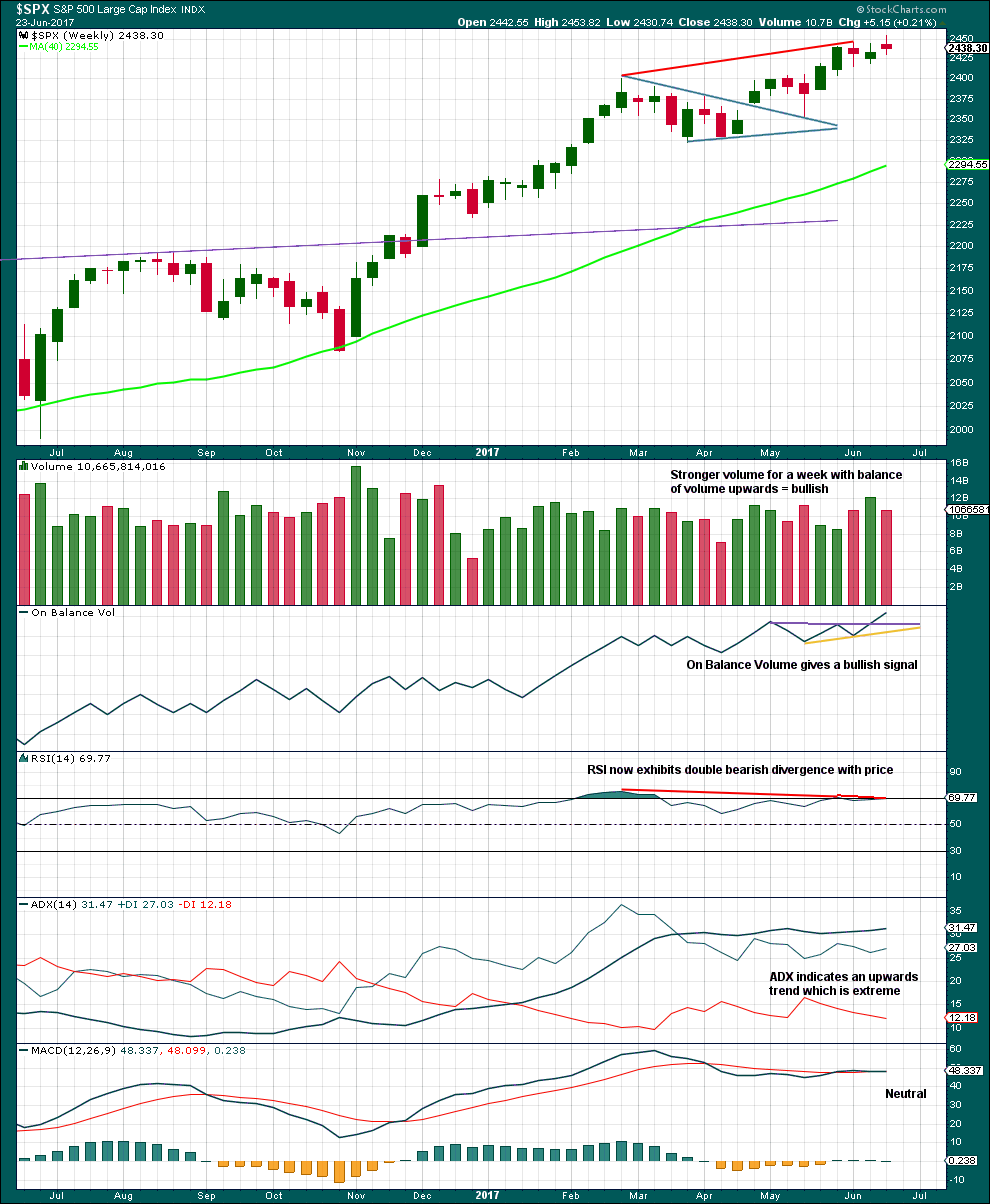
Click chart to enlarge. Chart courtesy of StockCharts.com.
Price is moving higher with a higher high and a higher low, but upwards movement is weak. Volume is light and the candlestick is a small spinning top pattern.
The bullish signal from On Balance Volume has proven this time to be false. Unfortunately, there is nothing within technical analysis which always works. While On Balance Volume works far more often than it fails, it is not 100% reliable.
DAILY CHART
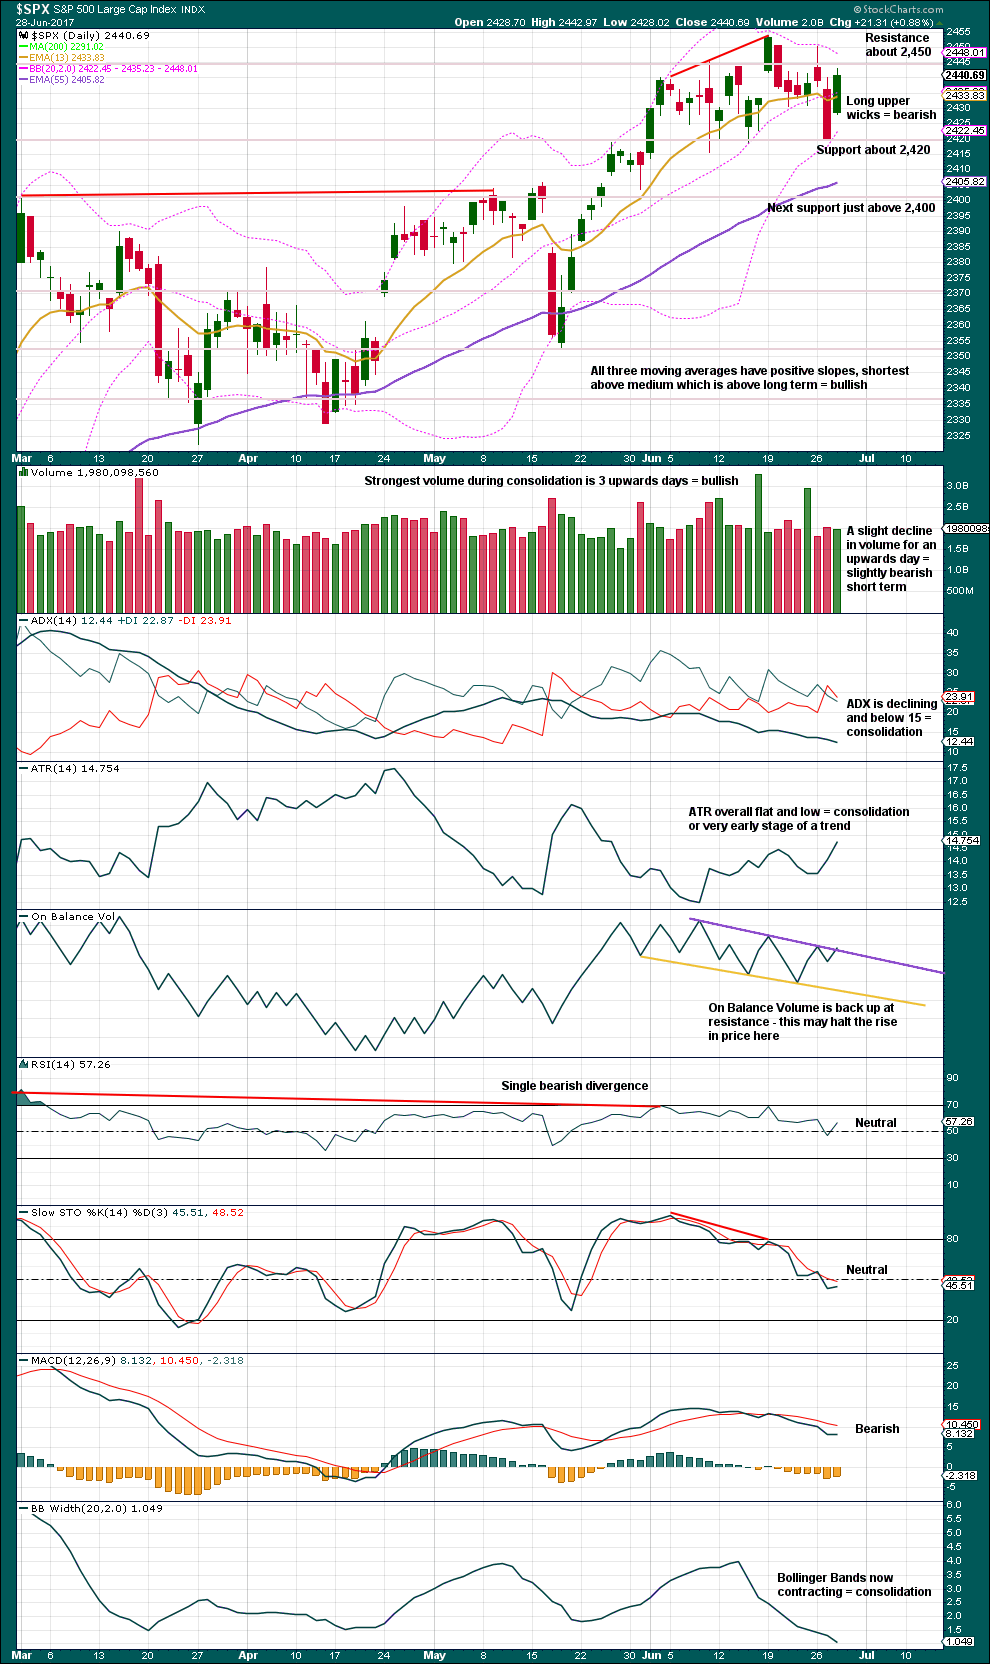
Click chart to enlarge. Chart courtesy of StockCharts.com.
Price is still range bound with resistance about 2,450 and support about 2,420. During the consolidation period, it is still upwards days that have strongest volume suggesting an upwards breakout is more likely than downwards. This technique does not always work, but it works more often than it fails. This does not support the new main Elliott wave count.
On Balance Volume, the volume profile, and long upper candlestick wicks suggest a red daily candlestick for tomorrow.
VOLATILITY – INVERTED VIX CHART
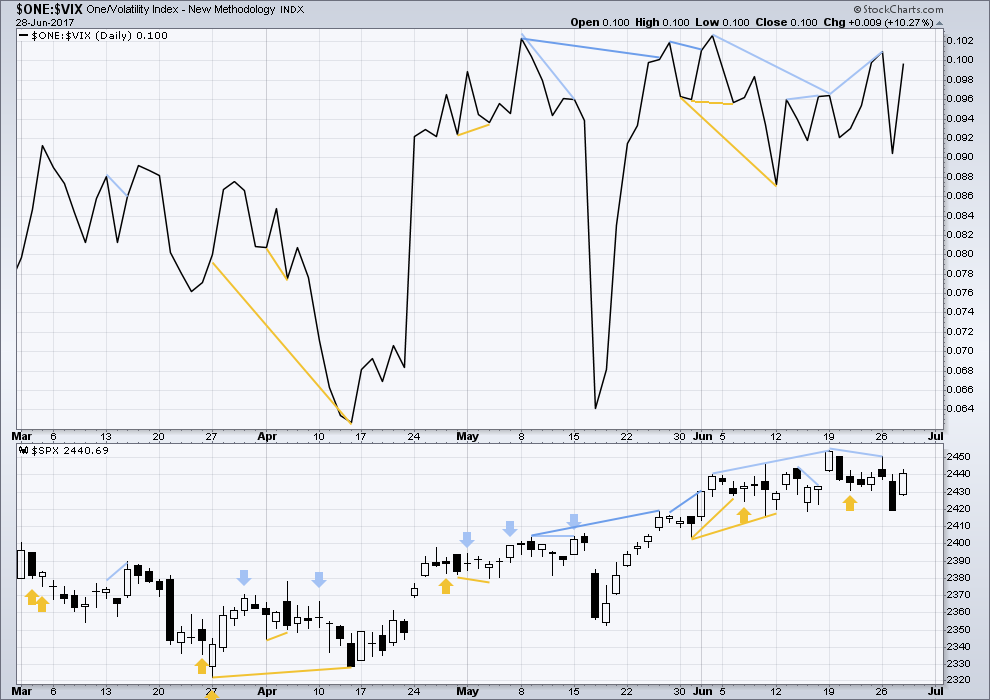
Click chart to enlarge. Chart courtesy of StockCharts.com.
Normally, volatility should decline as price moves higher and increase as price moves lower. This means that normally inverted VIX should move in the same direction as price.
There is no new divergence today with price and inverted VIX.
BREADTH – AD LINE
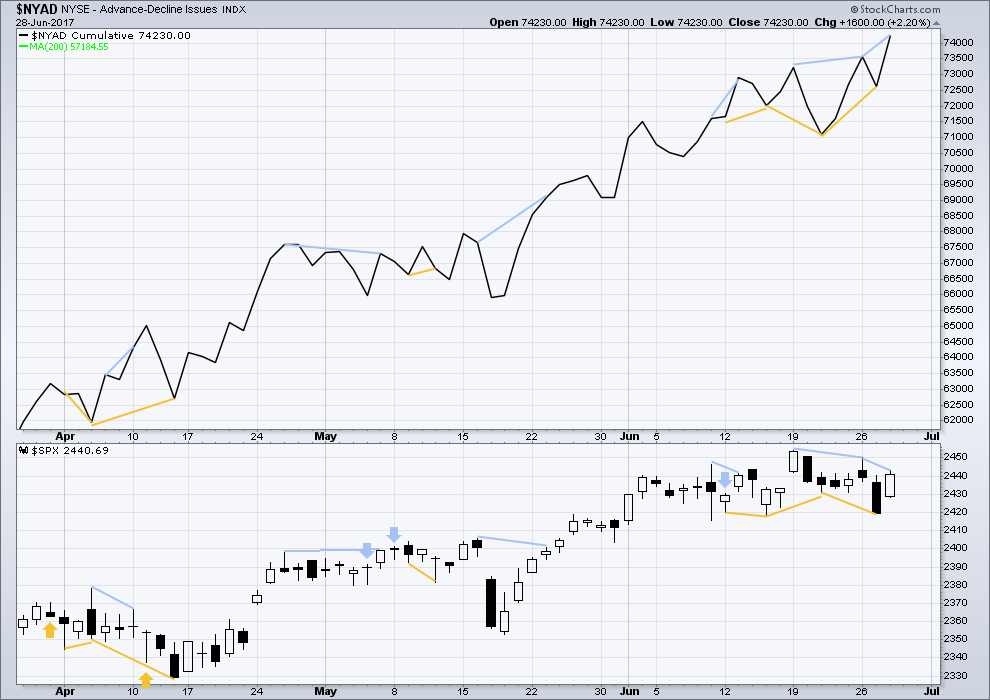
Click chart to enlarge. Chart courtesy of StockCharts.com.
With the last all time high for price, the AD line also made a new all time high. Up to the last high for price there was support from rising market breadth.
There is normally 4-6 months divergence between price and market breadth prior to a full fledged bear market. This has been so for all major bear markets within the last 90 odd years. With no divergence yet at this point, any decline in price should be expected to be a pullback within an ongoing bull market and not necessarily the start of a bear market.
There is new bearish divergence today between price and the AD line: the AD line has made a new all time high, but price has not. This indicates weakness within price during today’s session.
The mid caps and small caps have made new all time highs along with recent last all time high for large caps. The rise in price is seen across the range of the market, so it has internal strength.
However, there is now some weakness becoming evident within small and mid caps. The number of equities down 20% or more from their all time highs is greatest in small caps, next in mid caps, and least in large caps. This is only an early sign of weakness developing.
DOW THEORY
At the end of last week, DJIA and the S&P500 have all made new all time highs. DJT and Nasdaq last week did not make new all time highs. However, at this stage, that only indicates some potential weakness within the ongoing bull market and absolutely does not mean that DJT and Nasdaq may not yet make new all time highs, and it does not mean a bear market is imminent.
The following lows need to be exceeded for Dow Theory to confirm the end of the bull market and a change to a bear market:
DJIA: 17,883.56.
DJT: 7,029.41.
S&P500: 2,083.79.
Nasdaq: 5,034.41.
Charts showing each prior major swing low used for Dow Theory are here.
This analysis is published @ 10:55 p.m. EST.
Could low of today be a 3 wave structure from recent high to end wave 4, with the last wave down of consecutive red candles on hourly chart being the C wave.
To end primary wave 4? All of it?
No. From the end of primary wave 3 that would be five waves down, it needs to be three.
Also, that would be a remarkably brief primary degree fourth wave. Primary 1 lasted 10 weeks, primary 2 also 10 weeks, primary 3 lasted 50 weeks…. so far primary 4 has only one weekly candlestick. That is far far too brief for any serious consideration.
Referring to intermediate wave 4 as per alternate daily.
Another first and second wave. That’s three I count now.
An increase in downwards momentum.
Lets see if the lower edge of the base channel can provide resistance. If it doesn’t (and it doesn’t have to, only might) then another deep second wave correction for minuette (ii) to see a green candlestick for Friday.
There was absolutely no expansion of BBs for VIX today and the candle is sporting a huge upper wick. I would have expected today to be just the start of a much longer correction but that long upper wick, coupled with no BB expansion is short term, at the very least, bullish. The BB compression does suggest we should see some increase in volatility soon.
Yep! I guess the volatility BB explosion must be waiting for the triple threes….
I have that as well Lara; hard to imagine it gets gnarly around the holiday, but so be it…
That would really be confirmatory of a sizeable trend change..
I know I sound like a broken record but something is not right about the way VIX is acting today. It is behaving like the end of a downtrend and not the start. BBs remained very compressed and really should be expanding to contain price movement at the start of a substantial decline . The long upper wick is also bullish. Of course the relentless shorting of volatility could be resulting in signal distortions, as has been the case with this inflated market for quite some time.
Although volume supported the decline, all the indices put in long lower wicks today which is also somewhat bullish.
Even more interesting is how transports were relatively immune to the sell-off.
It seems as if the bots kicked in precisely at the 50 dmsa today. It will be interesting to see how much of a bounce we get and how long it lasts.
Breakdown!
The bears need to take out SPX 2400.00 and they need to do it with gusto today. The banksters are now quite confident that they will be able to buy back this decline starting now, as they did all day yesterday. A strong move down that demolishes SPX 2400.00 is a game changer. If we do not take it out today I am going to think that P3 is not yet done and we go higher. I doubt it though. That is one huge bearish engulfing candle. Let see what the bears have got, or not… 🙂
They’ve defended it very well.
But I don’t think that means we must now see new ATHs.
There’s a lot of downwards pressure here. It’s just starting off with overlapping first and second waves.
Frau Yellen’s remarks this week revealed something quite remarkable. She stated something to the effect that the era of financial crises is over.
When you think about it, it is they very height of hubris.
The absolute acme of hutzpah.
Here is what I find even more interesting about her comment.
Arguably, the central banks are by far the largest buyers of equities today.
The ECB has added 1T to European markets already this year.
Despite their jawboning about tapering their balance sheet, the FED has added 1.5 T albeit by round about mechanisms. Since these guys are the biggest buyers, their sentiment carries substantial weight.
I use to believe in the machiavellian view of the banksters in that they would deliberately engineer market crashes but no longer. I now believe that these people actually think themselves invincible, and that they can exert complete control over market behaviour. Some might argue that they might now want to precipitate a crash to make Trump look bad, but these people are business owners. The central banks are in business to make a profit, not put themselves out of business.
The point I am making is that Yellen’s comments represent a level of optimism that is nothing short of incredible- beyond irrational exuberance. I think she believes it.
You do have to hand it to them. After all, look at how massively they have manged to inflate the equities markets with nary an even slight correction going months on end.
Make no mistake about it; they are going to keep buying. Their survival depends on their doing so. Her euphoric comments suggest we are getting quite close to a top, and I suspect that when we do, and the market heads down, it will follow the same remarkable pattern it has the last few years, with one possible huge exception- and that is that it will do so far more swiftly.
She said, we will never again see a financial crisis “in our lifetime.” Sitting on a limb while sawing if off the tree!
Wow! Nothing new under the sun. Like good ‘ole Ben who was so certain that the housing crisis would be “contained”….another sign of the end?!
Indeed, from an EW POV this is a good indicator of a top.
At the end of every bubble in the history of bubbles, when they’re fully inflated there is talk from those in powerful positions that “this time is different” and the bubble cannot possibly pop, or even that there is no bubble at all. Talk of a “new era” is exactly what we should look for to see highs in place or coming up very soon.
I give it 4-9 months. I’m looking for October this year, but if it doesn’t turn then lets look for March 2018.
I am curious about whether the HO is telling us what to expect on the current decline or is looking to later in the year. The window lasts until September 30 so a lot could happen between now and then. For example, we could see another cluster of HOs after the current correction is finished.
It is the height of foolishness for Yellen to be anything but cautious since the Fed has used up most of it’s tools for affecting interest rates and has neither replaced them nor found anything new to use in the event of a breakdown.
She is extremely bright by all accounts. I sometimes wonder how much of her propaganda she actually buys. We have so much history on these matters that is it really amazing she would say something like that with a straight face. When I think about the more obvious things like the flattening yield curve, the size of her balance sheet, the clearly anemic and slowing GDP, consumer and Government indebtedness, and the absence of any room to materially ease rates…it does make one wonder if she is just playing us….
Triple Qs at critical neckline support at 137.40. A break here triggers sell signal with downside target around 132.00
We will see if Martin zweigs analysis in his book winning on Wall Street, plays out. In it he notes markets more often than not rise in sessions before a holiday
Perhaps tomorrow it will rise?
One of the things that happens at major trend changes is a departure from what is normally seen, not just broken support lines but also deviation from seasonal biases. It will be interesting to see if we get an impulse down complete tomorrow and a reversal into the week-end.
this is going to the absolute limit here pushed by the Banksters. Will the main count prevail?
well ok,, I will be first
Well…bugs got here first but he got stuck in moderation… 🙂
Didja miss me Doc?