
A new low below 2,422.88 has invalidated the main Elliott wave count and confirmed the alternate. Yesterday’s bearish divergence between price and the AD line and VIX did warn of a possible breakdown.
Summary: Expect now a multi week to multi month pullback has begun. The target zone for it to end is about 2,400 to 2,322. In the short term, expect another downwards day tomorrow towards a short term target at 2,413.
If choosing to trade this correction, remember to always use a stop and invest only 1-5% of equity on any one trade. Less experienced members should reduce equity to only 1-3%.
New updates to this analysis are in bold.
Last monthly and weekly charts are here. Last historic analysis video is here.
MAIN ELLIOTT WAVE COUNT
WEEKLY CHART
Click chart to enlarge.
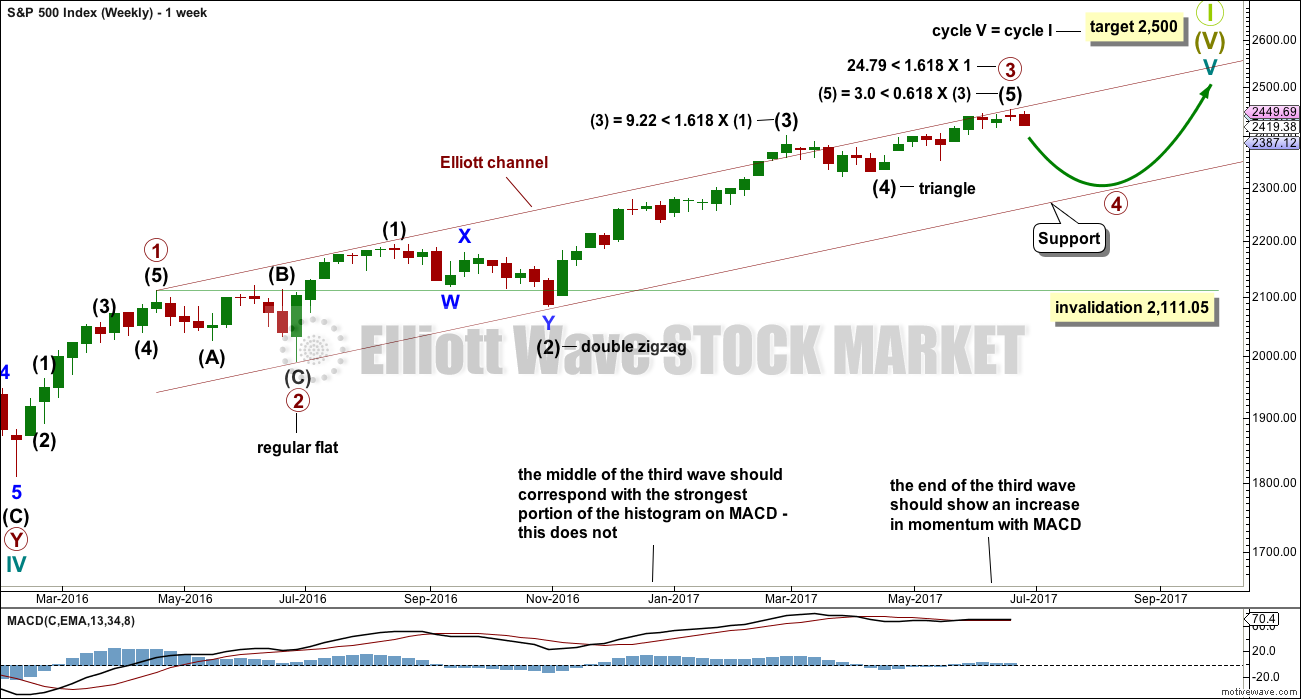
Price today has indicated that this should be the main wave count.
Primary wave 4 may now be underway.
Primary wave 2 was a regular flat correction that lasted 10 weeks. Given the guideline of alternation, primary wave 4 may most likely be a single or multiple zigzag or a triangle and may last about a Fibonacci eight or thirteen weeks, so that the wave count has good proportion and the right look.
Primary wave 4 may end within the price territory of the fourth wave of one lesser degree. Intermediate wave (4) has its range from 2,400.98 to 2,322.35.
Primary wave 4 may not move into primary wave 1 price territory below 2,111.05.
DAILY CHART
Click chart to enlarge.
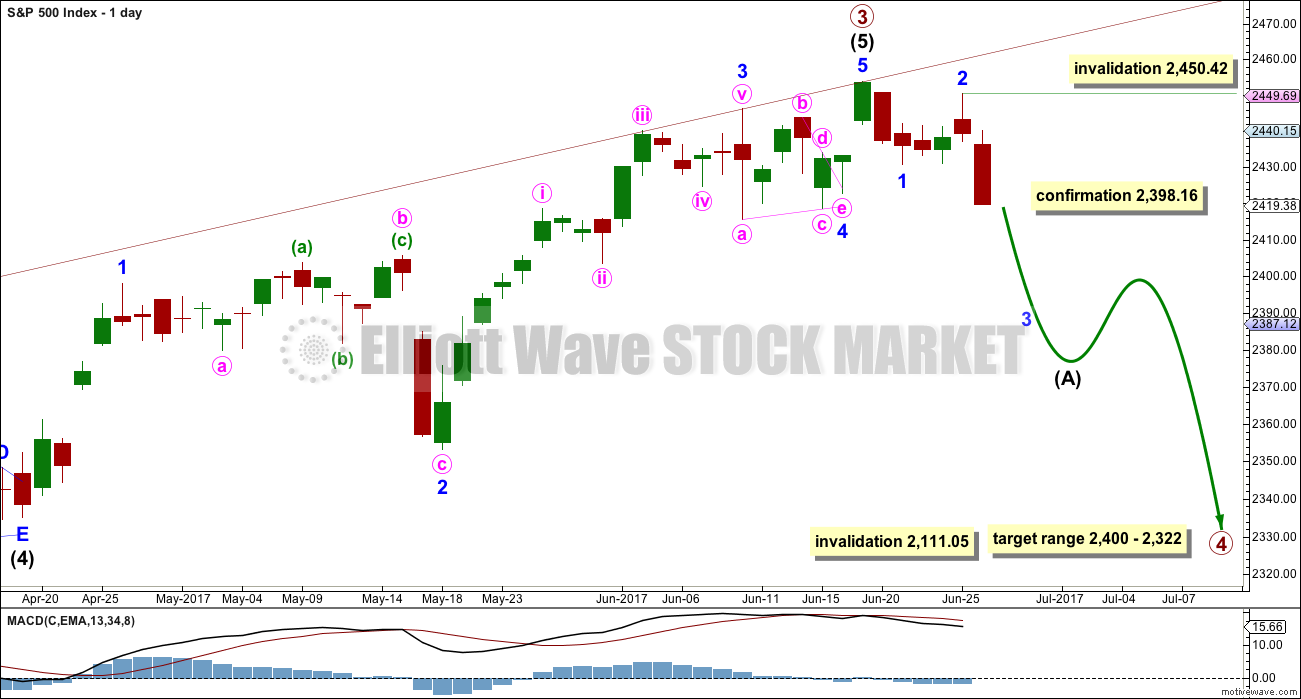
If primary wave 4 unfolds as the more common single or multiple zigzag, then it should begin with a five down at the daily chart level.
So far minor waves 1 and 2 may be complete. Within minor wave 3, no second wave correction may move beyond the start of its first wave above 2,450.42.
When intermediate wave (A) is complete, then intermediate wave (B) should unfold higher or sideways for at least two weeks.
HOURLY CHART
Click chart to enlarge.
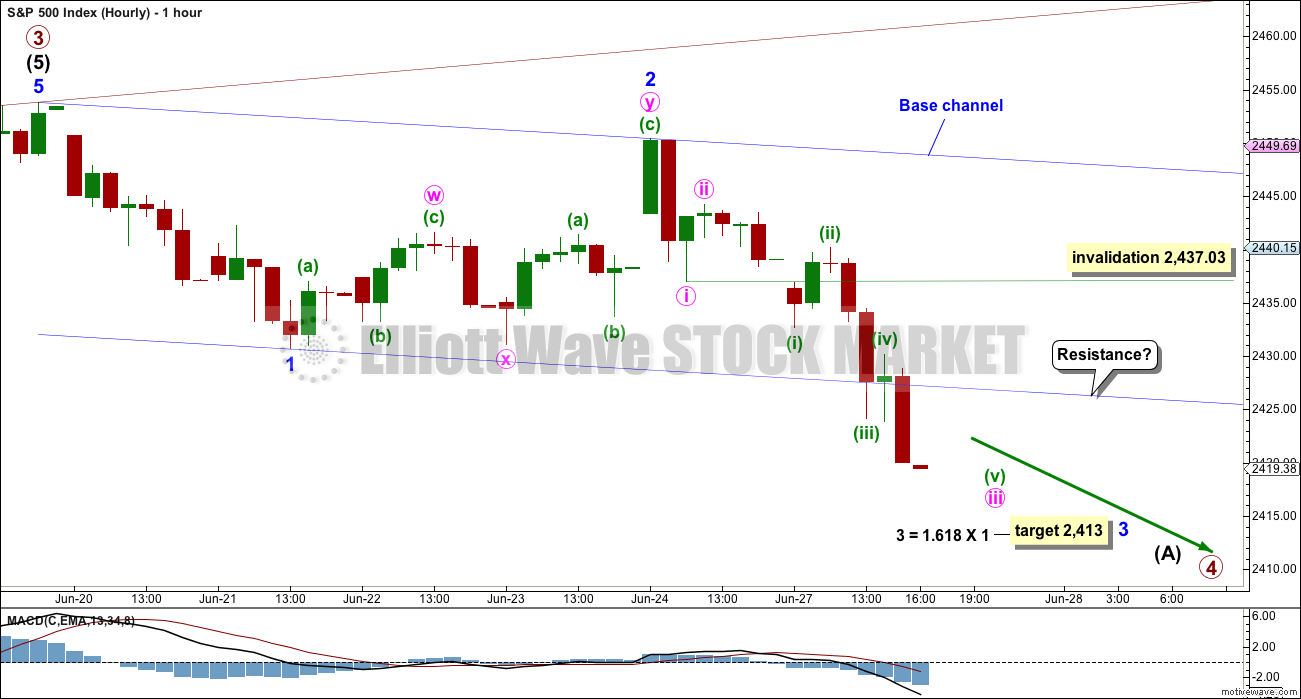
The structure of minor wave 1 downwards can be resolved as a five wave impulse. Five and one minute charts were published in comments after the close of this session today for those members who may be interested in viewing the breakdown. Some gross disproportion must be accepted; the wave count does not have the right look at the five and one minute chart level. However, strong downwards movement this session indicates this is the correct wave count.
Now that price is below the lower edge of the base channel, it may provide resistance.
Minor wave 3 must complete as a five wave impulse structure. This wave count expects downwards movement tomorrow with a small fourth wave correction along the way for minute wave iv.
Minute wave iv may not move into minute wave i price territory above 2,437.03.
ALTERNATE ELLIOTT WAVE COUNT
WEEKLY CHART
Click chart to enlarge.
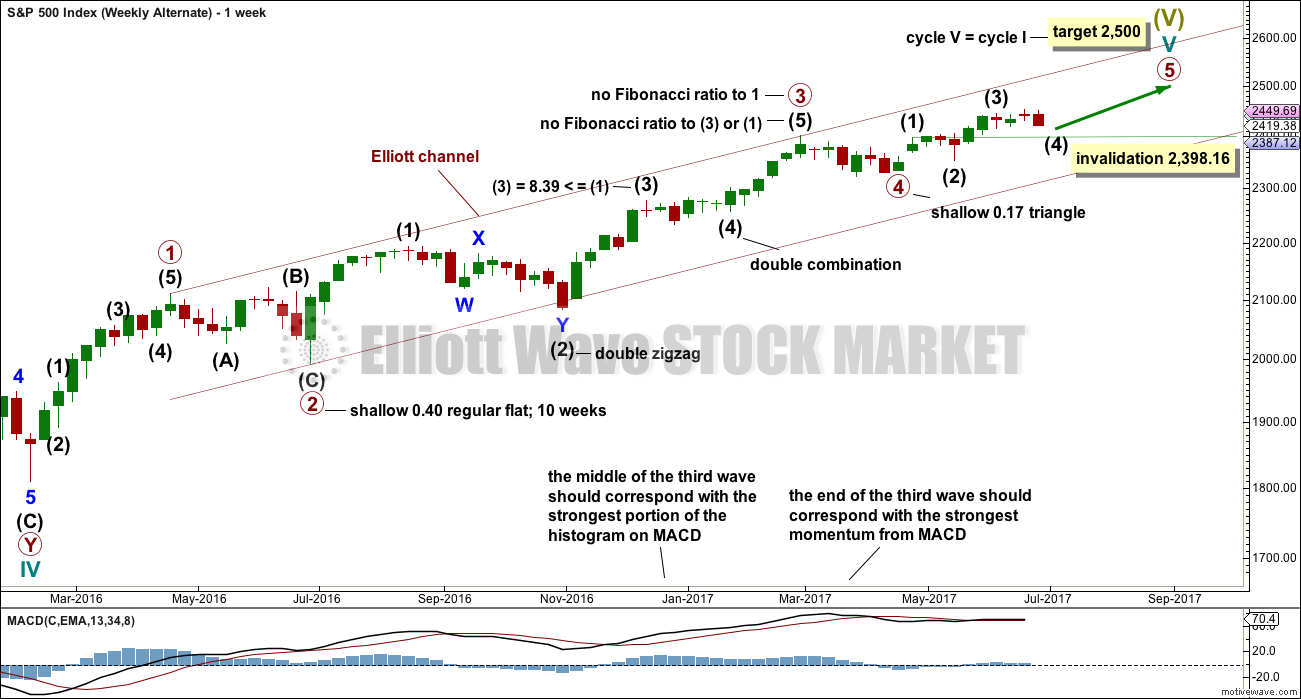
This wave count is now an unlikely alternate.
Primary wave 3 may be complete. Primary wave 5 may be close to an end. Within primary wave 5, intermediate wave (4) may not move into intermediate wave (1) price territory below 2,398.16.
DAILY CHART
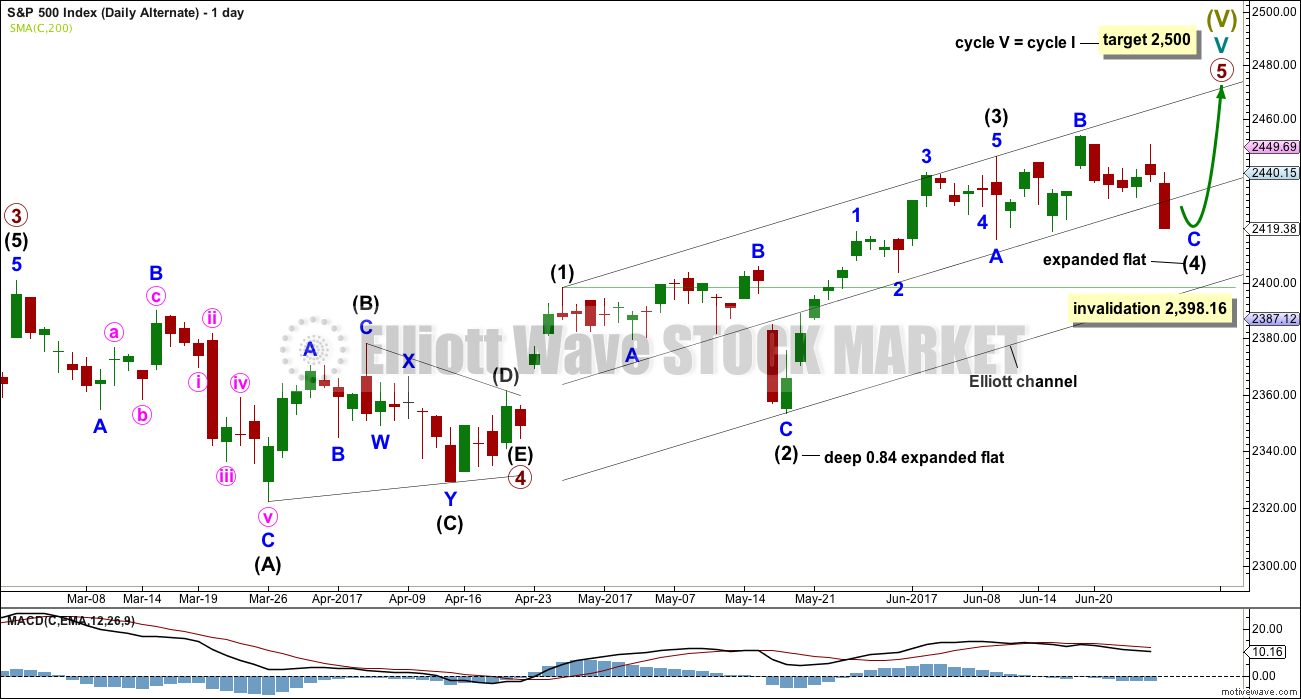
Click chart to enlarge.
At this stage, this is the only alternate wave count that remains.
If primary wave 5 is unfolding as an impulse, then within it there is no longer any alternation between the structures of intermediate waves (2) and (4); both would be expanded flat corrections. This has substantially reduced the probability of this alternate.
Minor wave C must complete as a five wave impulse. This alternate wave count requires more downwards movement for the structure of minor wave C to complete. There is no divergence at this stage in expected direction between the two wave counts.
TECHNICAL ANALYSIS
WEEKLY CHART
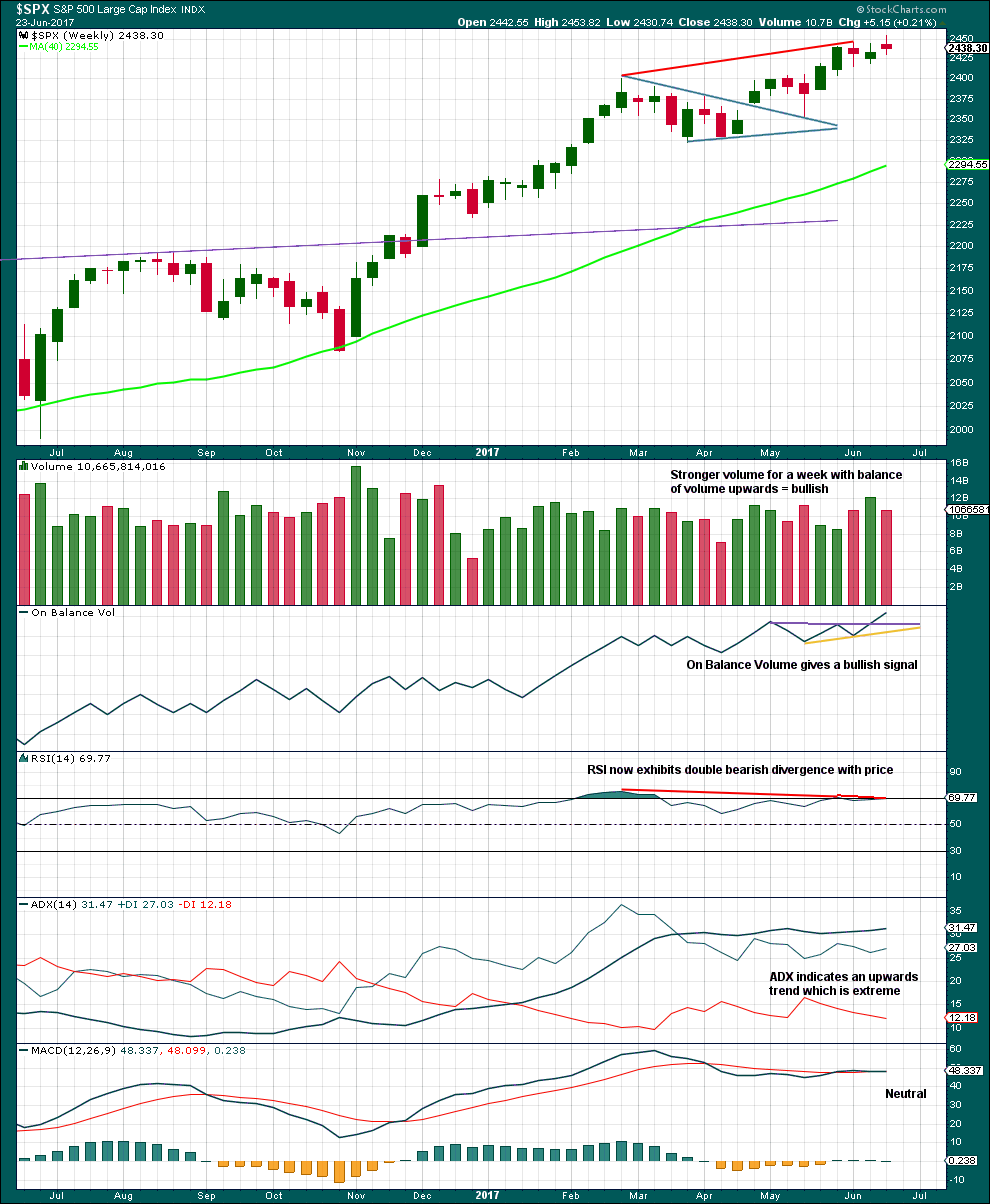
Click chart to enlarge. Chart courtesy of StockCharts.com.
Price is moving higher with a higher high and a higher low, but upwards movement is weak. Volume is light and the candlestick is a small spinning top pattern.
The bullish signal from On Balance Volume has proven this time to be false. Unfortunately, there is nothing within technical analysis which always works. While On Balance Volume works far more often than it fails, it is not 100% reliable.
DAILY CHART
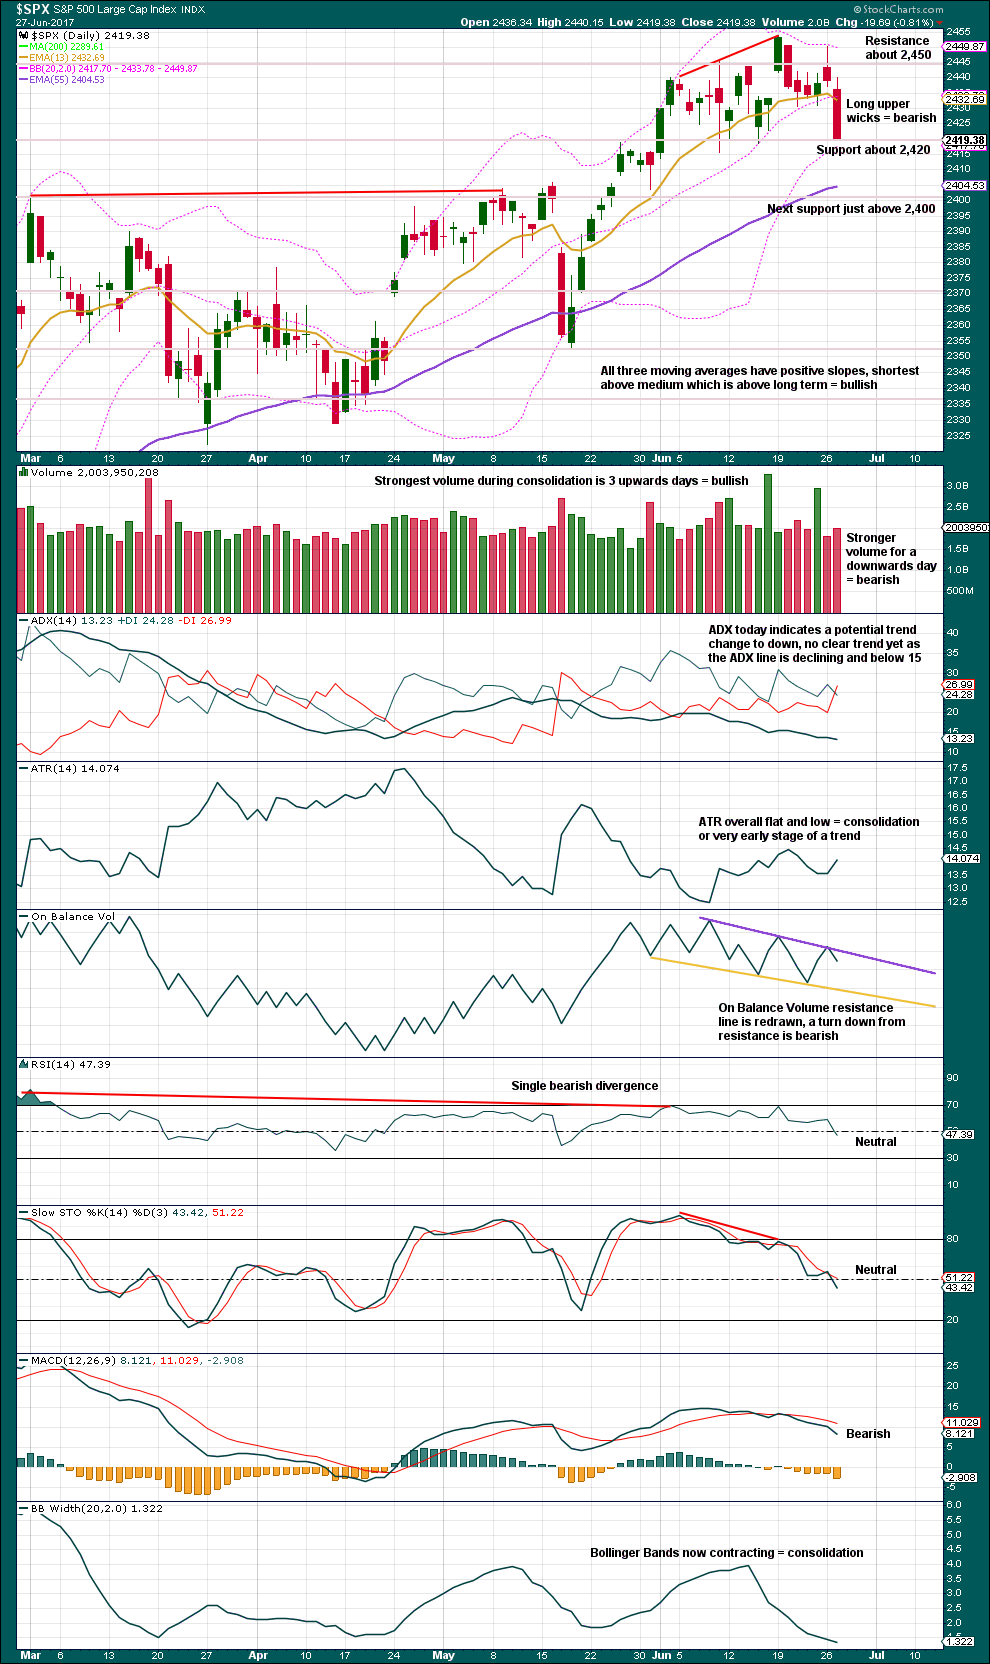
Click chart to enlarge. Chart courtesy of StockCharts.com.
Price is still range bound with resistance about 2,450 and support about 2,420. During the consolidation period, it is still upwards days that have strongest volume suggesting an upwards breakout is more likely than downwards. This technique does not always work, but it works more often than it fails. This does not support the new main Elliott wave count.
In the short term, On Balance Volume and the volume profile are bearish today.
VOLATILITY – INVERTED VIX CHART
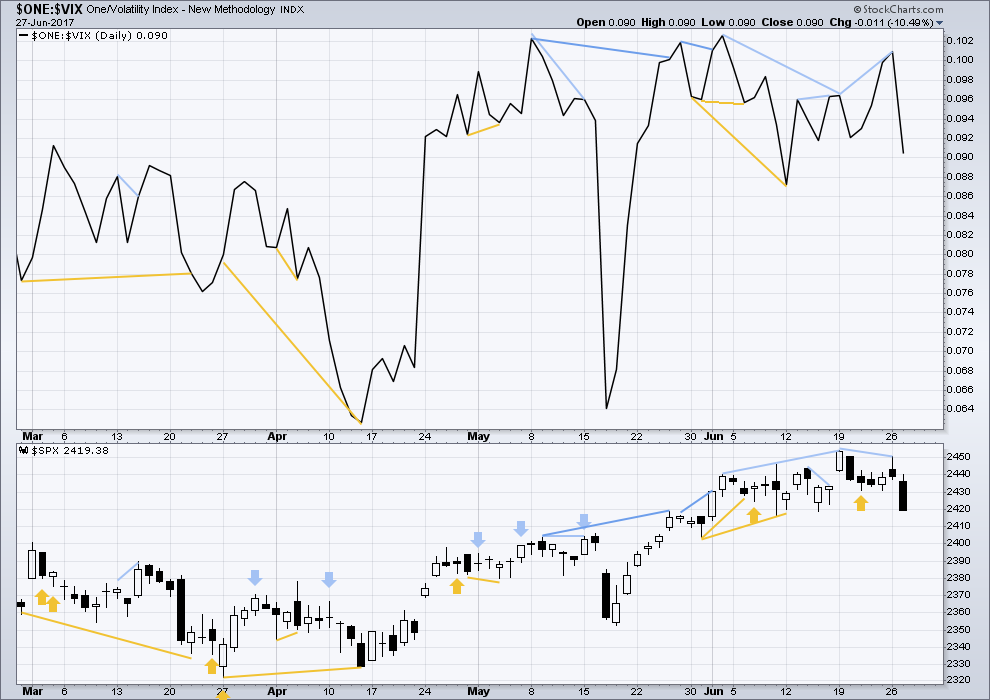
Click chart to enlarge. Chart courtesy of StockCharts.com.
Normally, volatility should decline as price moves higher and increase as price moves lower. This means that normally inverted VIX should move in the same direction as price.
Bearish divergence noted in last two analyses has now been followed by a strong downwards day. This divergence may now be resolved, or it may yet require another downwards day to resolve it.
There is no new divergence today with price and inverted VIX.
BREADTH – AD LINE
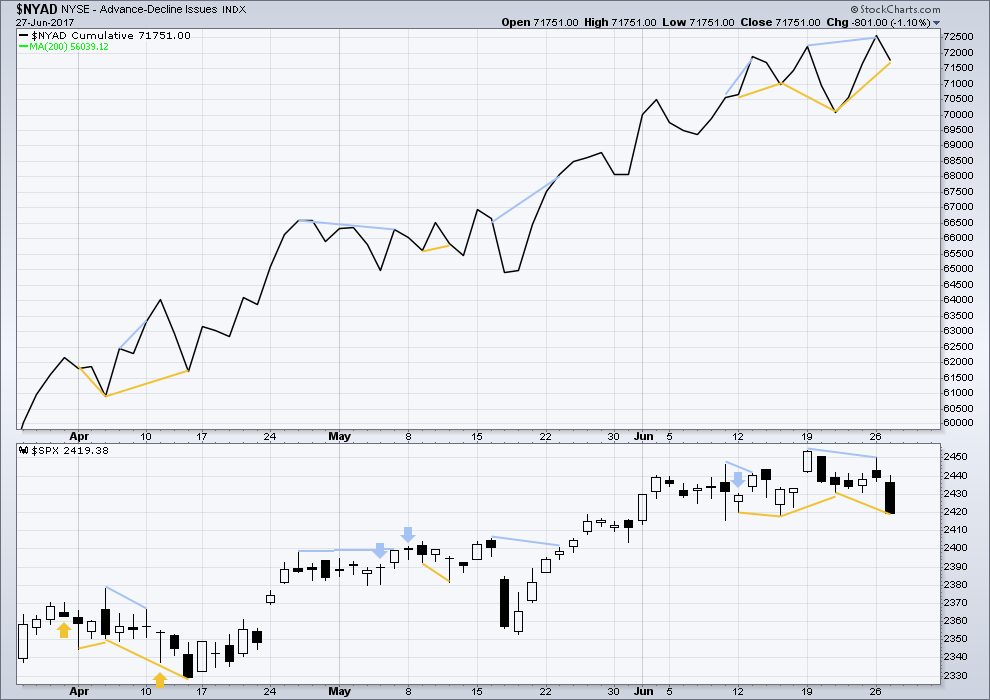
Click chart to enlarge. Chart courtesy of StockCharts.com.
With the last all time high for price, the AD line also made a new all time high. Up to the last high for price there was support from rising market breadth.
There is normally 4-6 months divergence between price and market breadth prior to a full fledged bear market. This has been so for all major bear markets within the last 90 odd years. With no divergence yet at this point, any decline in price should be expected to be a pullback within an ongoing bull market and not necessarily the start of a bear market.
Bearish divergence noted in last analysis has now been followed by one strong downwards day. This divergence may now be resolved, or it may need one more day to resolve it.
There is today new bullish divergence between price and the AD line: price has made a new low below the low of the 21st of June, but the AD line has not made a corresponding new low. Downwards movement today lacks support from a decline in market breadth.
The mid caps and small caps have made new all time highs along with recent last all time high for large caps. The rise in price is seen across the range of the market, so it has internal strength.
However, there is now some weakness becoming evident within small and mid caps. The number of equities down 20% or more from their all time highs is greatest in small caps, next in mid caps, and least in large caps. This is only an early sign of weakness developing.
DOW THEORY
At the end of last week, DJIA and the S&P500 have all made new all time highs. DJT and Nasdaq last week did not make new all time highs. However, at this stage, that only indicates some potential weakness within the ongoing bull market and absolutely does not mean that DJT and Nasdaq may not yet make new all time highs, and it does not mean a bear market is imminent.
The following lows need to be exceeded for Dow Theory to confirm the end of the bull market and a change to a bear market:
DJIA: 17,883.56.
DJT: 7,029.41.
S&P500: 2,083.79.
Nasdaq: 5,034.41.
Charts showing each prior major swing low used for Dow Theory are here.
This analysis is published @ 10:00 p.m. EST.
Trying to figure out what this structure can be at the hourly chart level, I’ve tried a leading diagonal but it doesn’t work. The wave lengths suggest an expanding diagonal, but the trend lines converge so it breaks the rule.
So my conclusion is it has to be a series of 1-2, 1-2 waves down.
So an increase in downward momentum should be expected.
chart
Looks good to me. I missed the completed impulse down yesterday and was a bIt surprised by the gap up today. The double combination of minor two was also a head- scratcher so hopefully minute two will remain an uncomplicated affair. 🙂
Hopefully…. it looks like a possibly complete zigzag.
Minor 2 is actually a double zigzag, not a combination. That’s pretty common for a second wave correction. I’ll add some notation to the chart to make the structures a bit clearer.
Indeed! I keep pretending I don’t need glasses! 🙂
I was also curious about the remarkable time disparity between minor one and minor two. That was the main reason for my doubting that we had an initial impulse down.
Skirmish between India and China has ominous implications. The useless US lame stream media is not reporting it and you have to look at Indian and Russian outlets to hear about what is going on. The Chinese crossed into sovereign Indian territory and destroyed some bunkers in the Sikkim region of the Chinese-Indian border. The Chinese leadership seems to be completely out of control when it comes to their conduct towards their neighbors regarding land and sea territorial disputes. There was actual exchange of gunfire between Chinese and Indian soldiers as the latter move to challenge the incursion. These are two nuclear armed counties with huge armies. This is total insanity!
Looks to me like the Chinese are looking for a distraction from their imploding economy.
Wow. I hadn’t heard anything about that down here in sleepy little New Zealand.
And we have a huge Chinese population. So I would have expected our dull old media to have reported this.
Main Wave Count on hourly invalidated.
So then maybe imbedded 1-2s? Or maybe an A-B-C (or W-X-Y) complete yesterday?
Yes, the first idea I think.
It is so ironic that the authorities dish out fines to banks for forex rigging when the Fed is probably the biggest culprit
why is no-one regulating this? I suppose it is the Big State. No one can regulate the top regulator – corruption at the highest level!
That is the million dollar question. Who regulates the regulators?
What they are doing is partly from fear, partly from self-preservation. The kind of carnage that will issue from another market collapse is going to have an awful lot of angry folk looking for the villians they deem resonsible. It is not too diffficult to figure out who they are going to blame.
Verne,
When the banks are buying, who are they buying for?
It depends on which banks. Swiss National Bank probably owns more Nasdaq stocks than US investors. BOJ owns 30% of the Nikkei. The FED shorts volatility and Gold and buys equities as do several large hedge funds. They used to short the Yen for the same purpose but less so recently. The balance sheets of CBs is downright scary…and probably illegal.
Today setting up to be an epic battle between banksters and the bear. They are already furiously selling volatility and trying to do the same with Gold and the Yen. They cannot afford to loose control of the market going into quarter end and a holiday weekend so there could be some flying fur today…! Look for a desperate attempt to reclaim and retain SPX 2400.00. That remains the line in the sand for me personally. 🙂
If I remember frank zweigs book the market often rallies before a holiday
https://www.docdroid.net/wmNt2uT/double-hindenburg.docx.html
Above is the chart from Sentiment trader on double HOs.
A picture is worth a thousand statistics (or something like that) 🙂
Lara,
Is there a possibility that we have only seen the end of intermediate 3 of Primary 3, rather than all of Primary 3? I only ask because intermediate 3 doesn’t look like a 5 wave structure to me on the weekly chart. Of course, this would mean that we have a lot longer to go before the ultimate top, although not necessarily that much higher.
Thanks,
Peter
It doesn’t look so good to me, but yes, that is possible.
To me it still could be. B of (4) hasn’t violated the 2 times A guideline even though it is stretching the friendship.
I’m thinking a double zig from the April low into last week’s high. If so the C wave down to about or less than the A low would then give a perfect look and fit as well as alternation on the longer term charts as an intermediate wave (4).
However if we get another ATH it’s then hard to see this count being preferred.
Aha. Now I see what you see 🙂
So intermediate (4) continuing as an expanded flat? Yes, possible. Minor B would now be 1.67 X minor A, so still well within allowable limits of up to 2.
Intermediate (4) would now be very much longer in duration than intermediate (2) at 17 weeks, and would need probably at least two to three more weeks to complete. Compared to 11 weeks for intermediate (2). So the proportions are starting to look wrong.
Yep I agree but 4s can still be a lot longer in time than 2s and still be acceptable.
I think an ATH now would seriously negate it
Lara thank you for the detailed analysis. May ask what chances do you give for the scenario that we saw the top of the bull market?
Pretty much zero.
Goodness… I do hope I don’t come to regret that comment!
Well, I exited my final long positions today. Thanks Lara for the price points given for confidence in what is now the preferred count. I am very glad I exited my short term leveraged long positions earlier. So, for me, this completes the first six months of 2017 from a trading and investing perspective. It is time for a break. I am now taking the next 2 1/2 months to recreate and vacation. Best wishes for all of you. I may check in from time to time and then again, I may not. I’ll definitely be back in mid-September though.
Sell in may and go away 😉
Close enough… 🙂
Rodney I wish you a wonderful time of refreshing and renewal. I cannot imagine any better medicine for body, soul and spirit than getting back to nature, and leaving all the trappings of modernity for some pure mountain air….Enjoy!
That’s fantastic Rodney. When you return the bear may be ready to emerge, please bring him back from the woods if you see him 🙂
As you’re taking a break, you can suspend your payments and then re-enable when you return. This means you keep your older rate.
Go into your paypal account and find the original recurring payment profile, it will be dated with your sign up date (a long time ago now!). Click on that recurring payment profile and you’ll see a “suspend” option I think.
We can’t do this for you, you have to do it from your paypal account.
I think it just suspends your payments, to re-enable when you are ready.
Have a lovely holiday 🙂
Thanks for that offer Lara. That is quite considerate of you. But I want the ability to check in from time to time. I will look for a bear. In fact, the first place I am exploring is the most remote location in the lower 48 states of the USA. I have a good chance of seeing all of the following: two species of deer, elk, moose, mountain goats, black bear, grizzly bear, and mountain lion (also called cougar).
Best wishes to all.
Be sure to take along your trusty peace maker…just in case… 🙂