
The main Elliott wave count expected upwards movement. This happened at the end of the session for the candlestick to close green, but a lower low and a lower high for the session saw price overall move down from the prior day.
Summary: Assume the trend remains the same, upwards, until proven otherwise; while price remains above 2,422.88, assume the trend remains upwards. The target zone calculated at two wave degrees is 2,500 to 2,501.
If price makes a new low below 2,422.88, then we shall expect a deeper multi week pullback to end somewhere between 2,400 to 2,322.
A bullish signal this week from On Balance Volume supports the main wave count. Expect new highs next week as most likely.
Always use a stop. Invest only 1-5% of equity on any one trade.
New updates to this analysis are in bold.
Last monthly and weekly charts are here. Last historic analysis video is here.
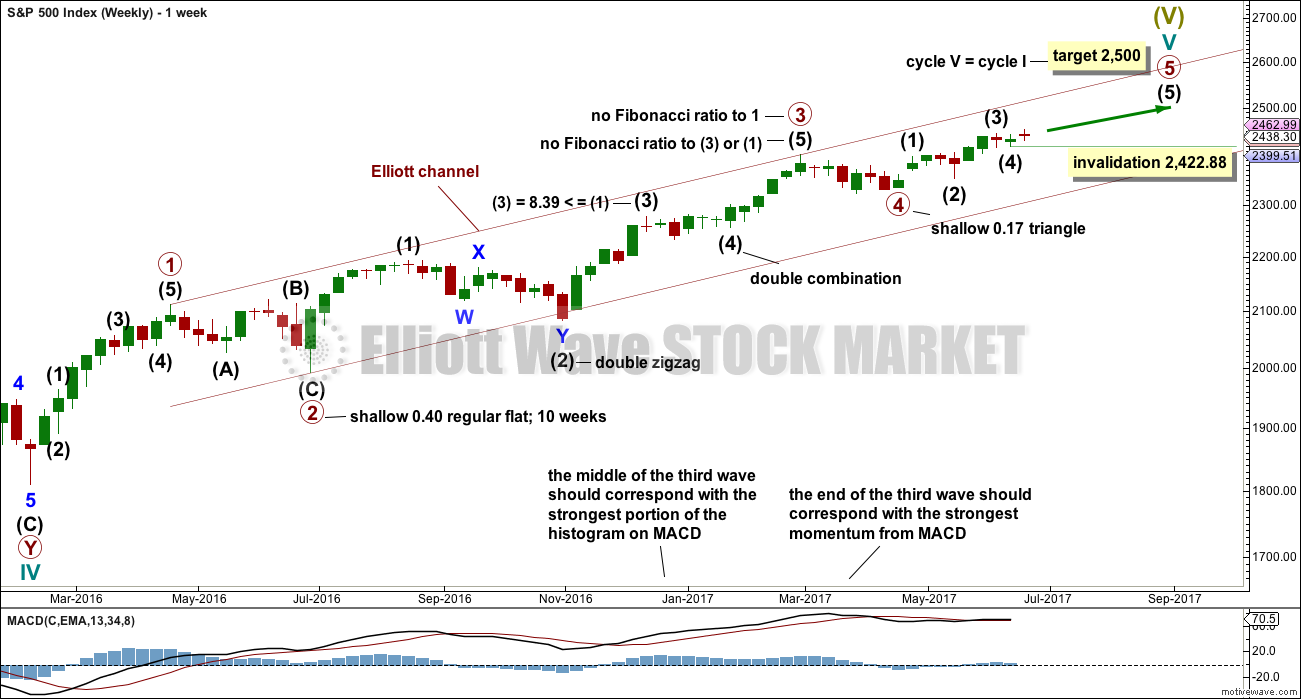
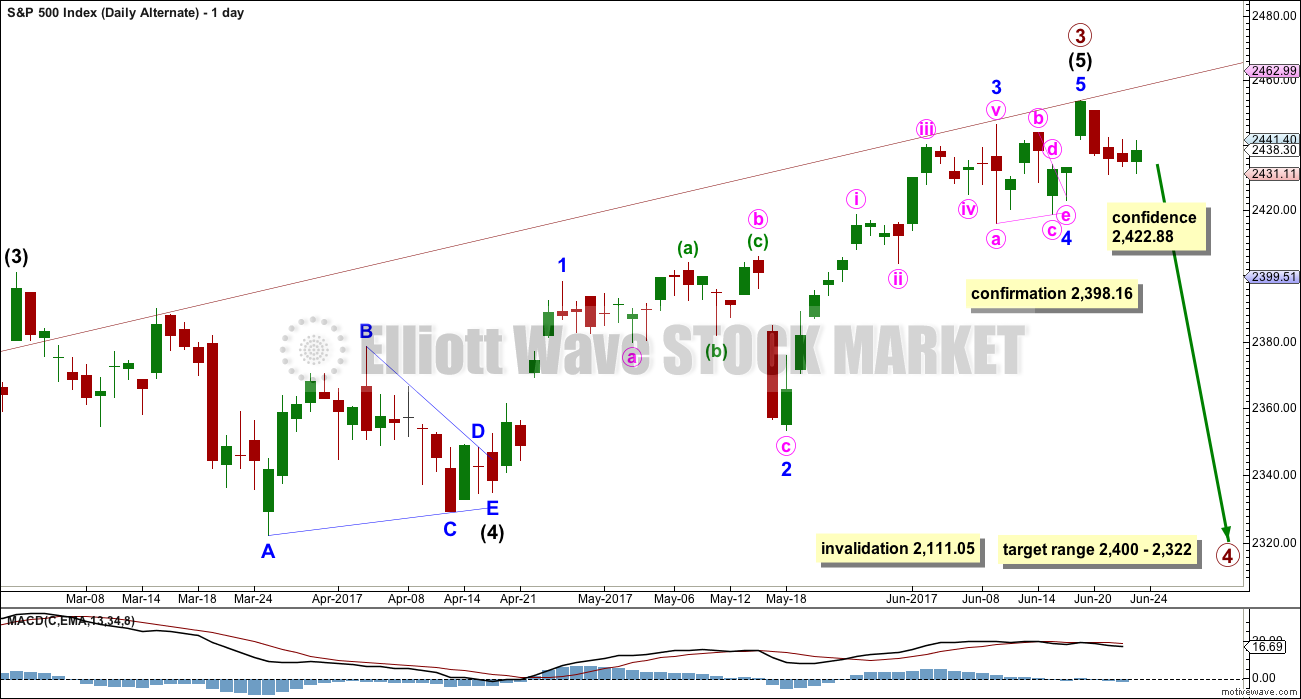
MAIN ELLIOTT WAVE COUNT
WEEKLY CHART
Click chart to enlarge.
This wave count has a better fit with MACD and so may have a higher probability. However, at this stage it expects the bull market to come to an end quickly. With market breadth not yet exhibiting any divergence with price this looks unlikely. The alternate should be taken seriously.
Primary wave 3 may be complete, falling short of 1.618 the length of primary wave 1 and not exhibiting a Fibonacci ratio to primary wave 1. There is a good Fibonacci ratio within primary wave 3.
The target for cycle wave V will remain the same, which has a reasonable probability. At 2,530 primary wave 5 would reach 0.618 the length of primary wave 1. If the target at 2,500 is exceeded, it may not be by much.
There is alternation between the regular flat correction of primary wave 2 and the triangle of primary wave 4.
Within primary wave 3, there is alternation between the double zigzag of intermediate wave (2) and the triangle of intermediate wave (4).
Within the final wave of intermediate wave (5), no second wave correction may move beyond its start below 2,422.88.
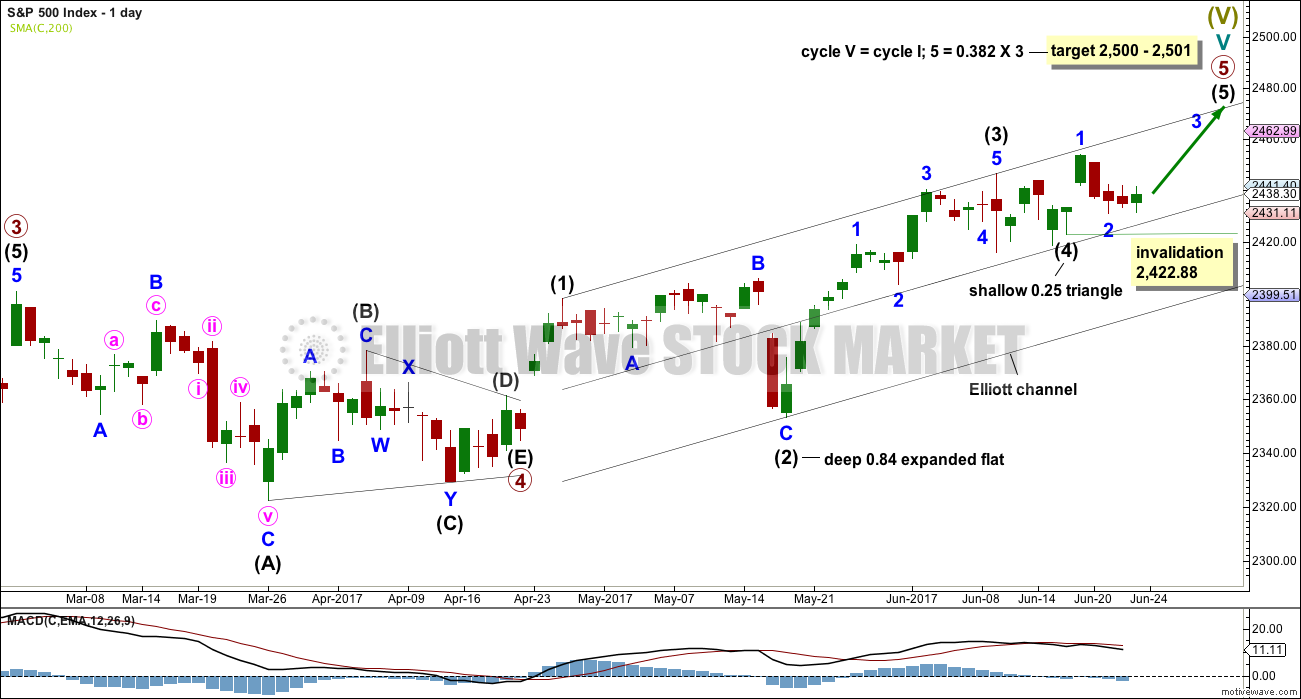
DAILY CHART
Click chart to enlarge.
Primary wave 5 must complete as a five wave motive structure, either an impulse (more common) or an ending diagonal (less common). So far, if this wave count is correct, it looks like an impulse.
Intermediate wave (3) is a complete impulse. Intermediate wave (4) may be a complete triangle.
Intermediate wave (5) must be a five wave motive structure.
Within intermediate wave (5), minor wave 1 is now complete. Minor wave 2 may not move beyond the start of minor wave 1 below 2,422.88.
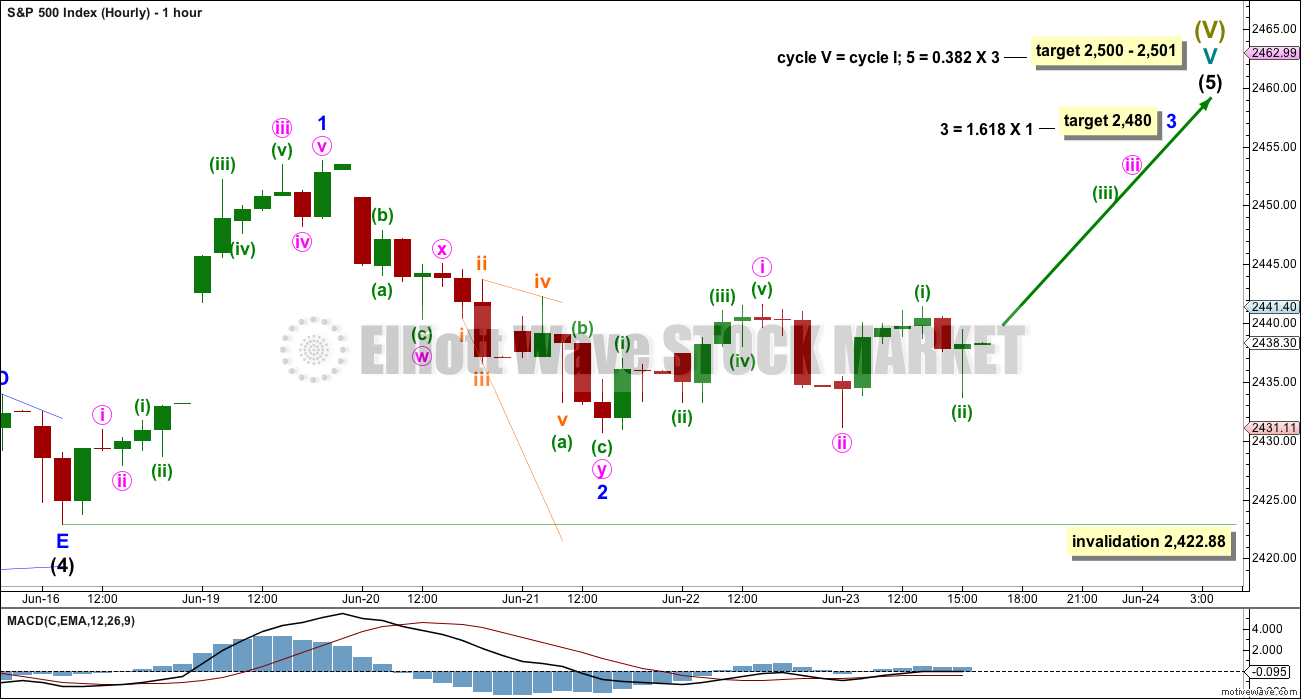
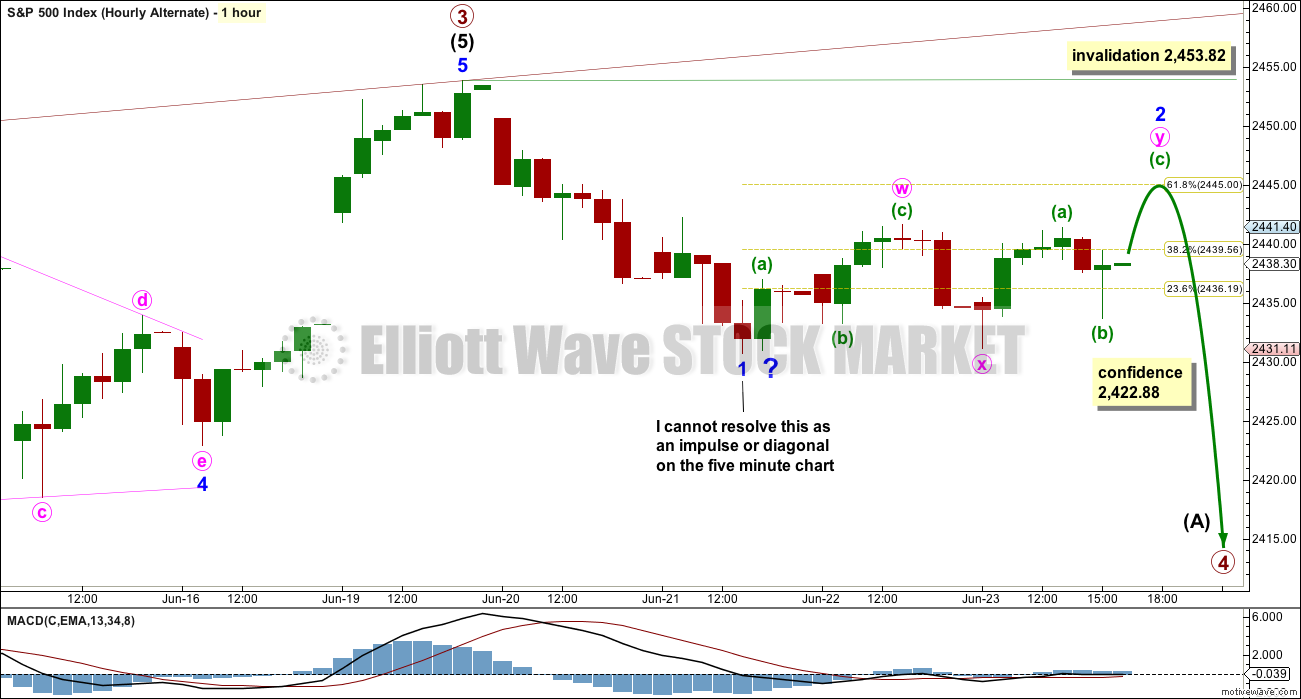
HOURLY CHART
Click chart to enlarge.
Minor wave 2 is now a very deep correction and fits as a double zigzag.
Downwards movement for minor wave 2 does look choppy and corrective, compared to prior upwards movement for minor wave 1 which looks clearer and impulsive.
Minor wave 3 may be beginning slowly with overlapping first and second waves.
If minor wave 2 continues further, it may not move beyond the start of minor wave 1 below 2,422.88.
At the hourly chart level, this wave count has a better fit for recent movement.
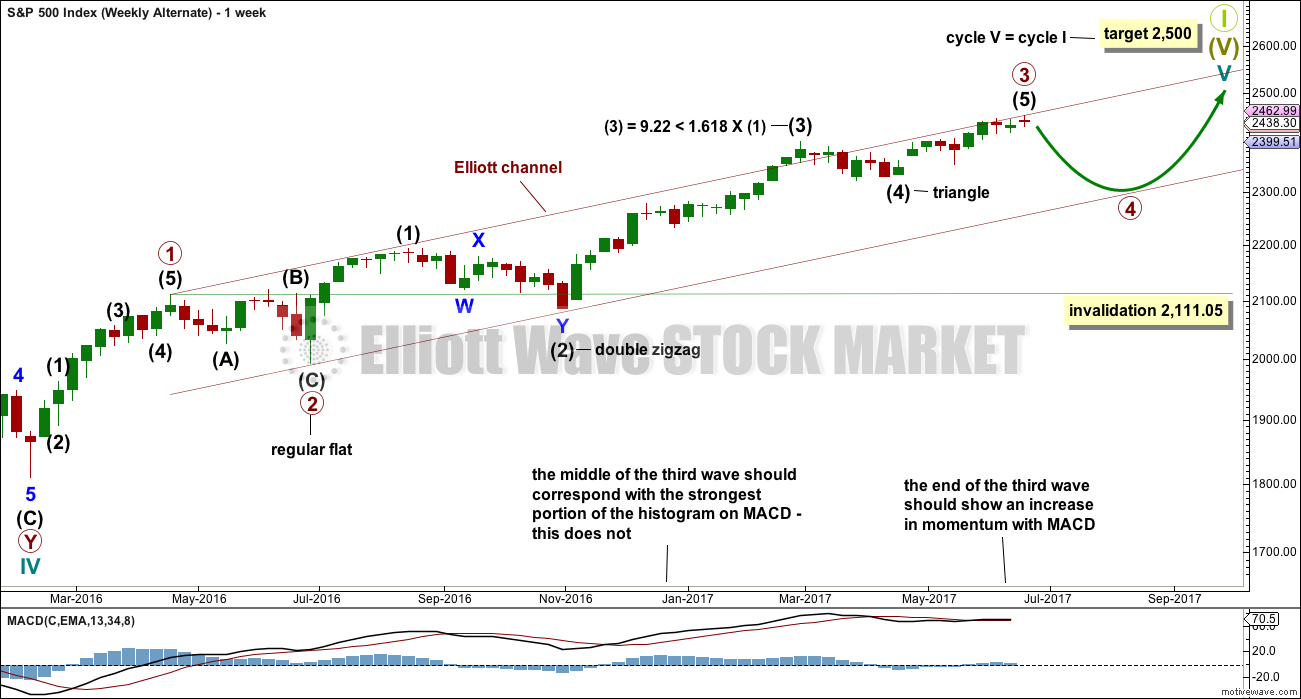
ALTERNATE ELLIOTT WAVE COUNT
WEEKLY CHART
Click chart to enlarge.
It is possible that primary wave 3 is either over now or may be very soon indeed. It is possible that a deep multi week or multi month pullback may begin for primary wave 4.
This wave count would allow for primary wave 4 to unfold with a corresponding decline in market breadth. Primary wave 5 may then continue higher towards the target, allowing for at least 4 months of divergence between market breadth and price to develop before an end to the ageing bull market. This would have a neat fit with prior major trend changes from bull to bear of every single bear market in the last 90 odd years.
Primary wave 2 was a regular flat correction lasting 10 weeks. Primary wave 4 may exhibit alternation as a single or multiple zigzag, or as a triangle. It should last at least 10 weeks and possibly longer.
Primary wave 4 may not move into primary wave 1 price territory below 2,111.05.
DAILY CHART
Click chart to enlarge.
Minor wave 5 of intermediate wave (5) of primary wave 3 may be over here, or it may continue higher.
Always assume the trend remains the same until proven otherwise; assume the trend is upwards until price makes a new low below 2,422.88.
If price moves below 2,422.88, then this would be the main wave count.
Primary wave 4 may end within the price territory of the fourth wave of one lesser degree. The price range for intermediate wave (4) gives a target range for primary wave 4.
HOURLY CHART
Click chart to enlarge.
A correction at primary degree must begin with a five down at least at the hourly chart level.
I have spent some time looking at the downwards wave labelled minor wave 1 on the five minute chart. A wave that moves in a straight line is only either an impulse, zigzag or zigzag multiple. This downwards wave will fit very neatly as a double zigzag, but I cannot see a solution for it as any other structure. I cannot see a solution for it as a five wave motive structure, which minor wave 1 must be.
Minor wave 2 may not move beyond the start of minor wave 1 above 2,453.82. Minor wave 2 may be continuing a little higher as a double zigzag.
TECHNICAL ANALYSIS
WEEKLY CHART
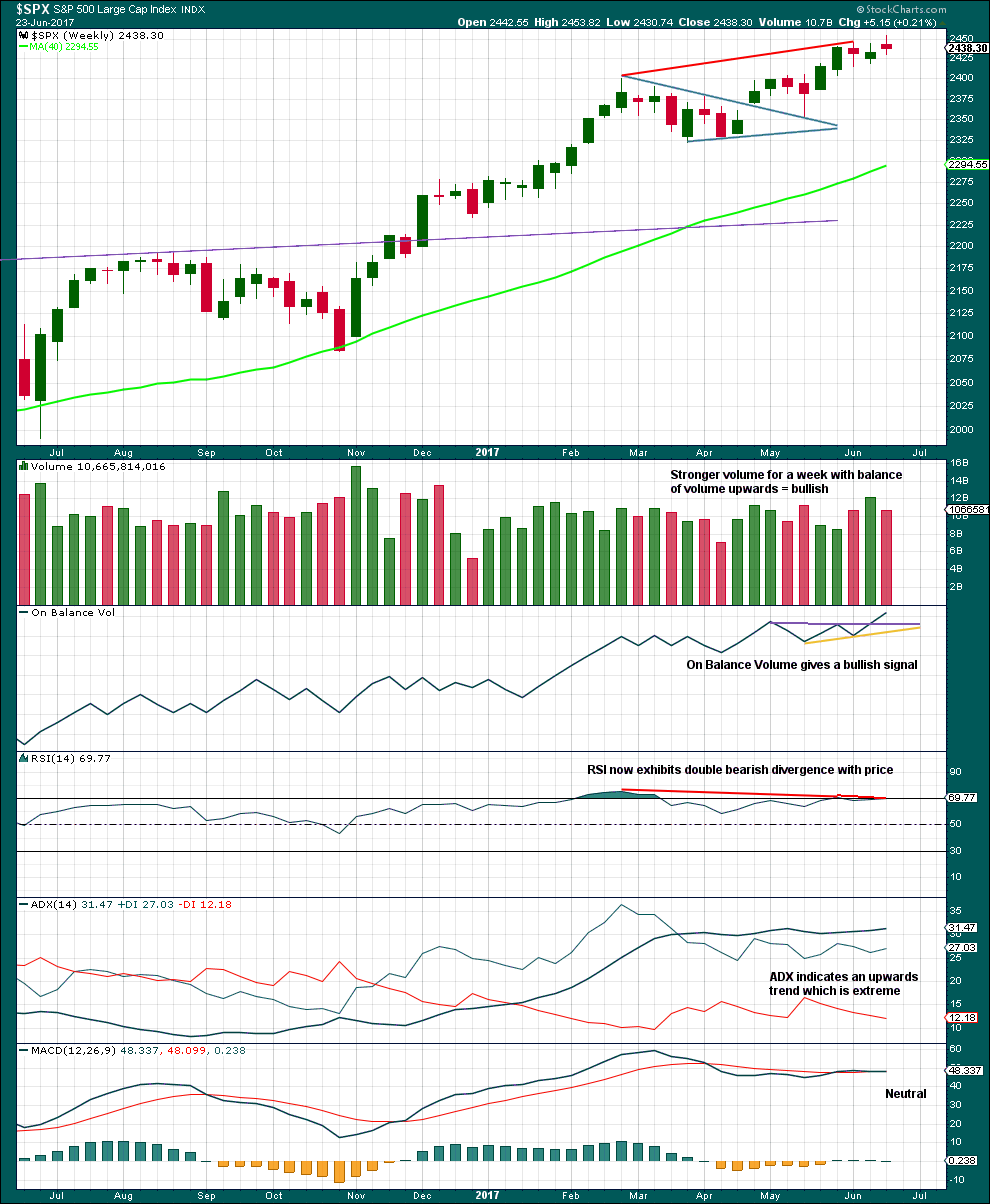
Click chart to enlarge. Chart courtesy of StockCharts.com.
Price is moving higher with a higher high and a higher low, but upwards movement is weak. Volume is light and the candlestick is a small spinning top pattern.
Give weight to On Balance Volume though. This strongly supports the main Elliott wave count.
DAILY CHART
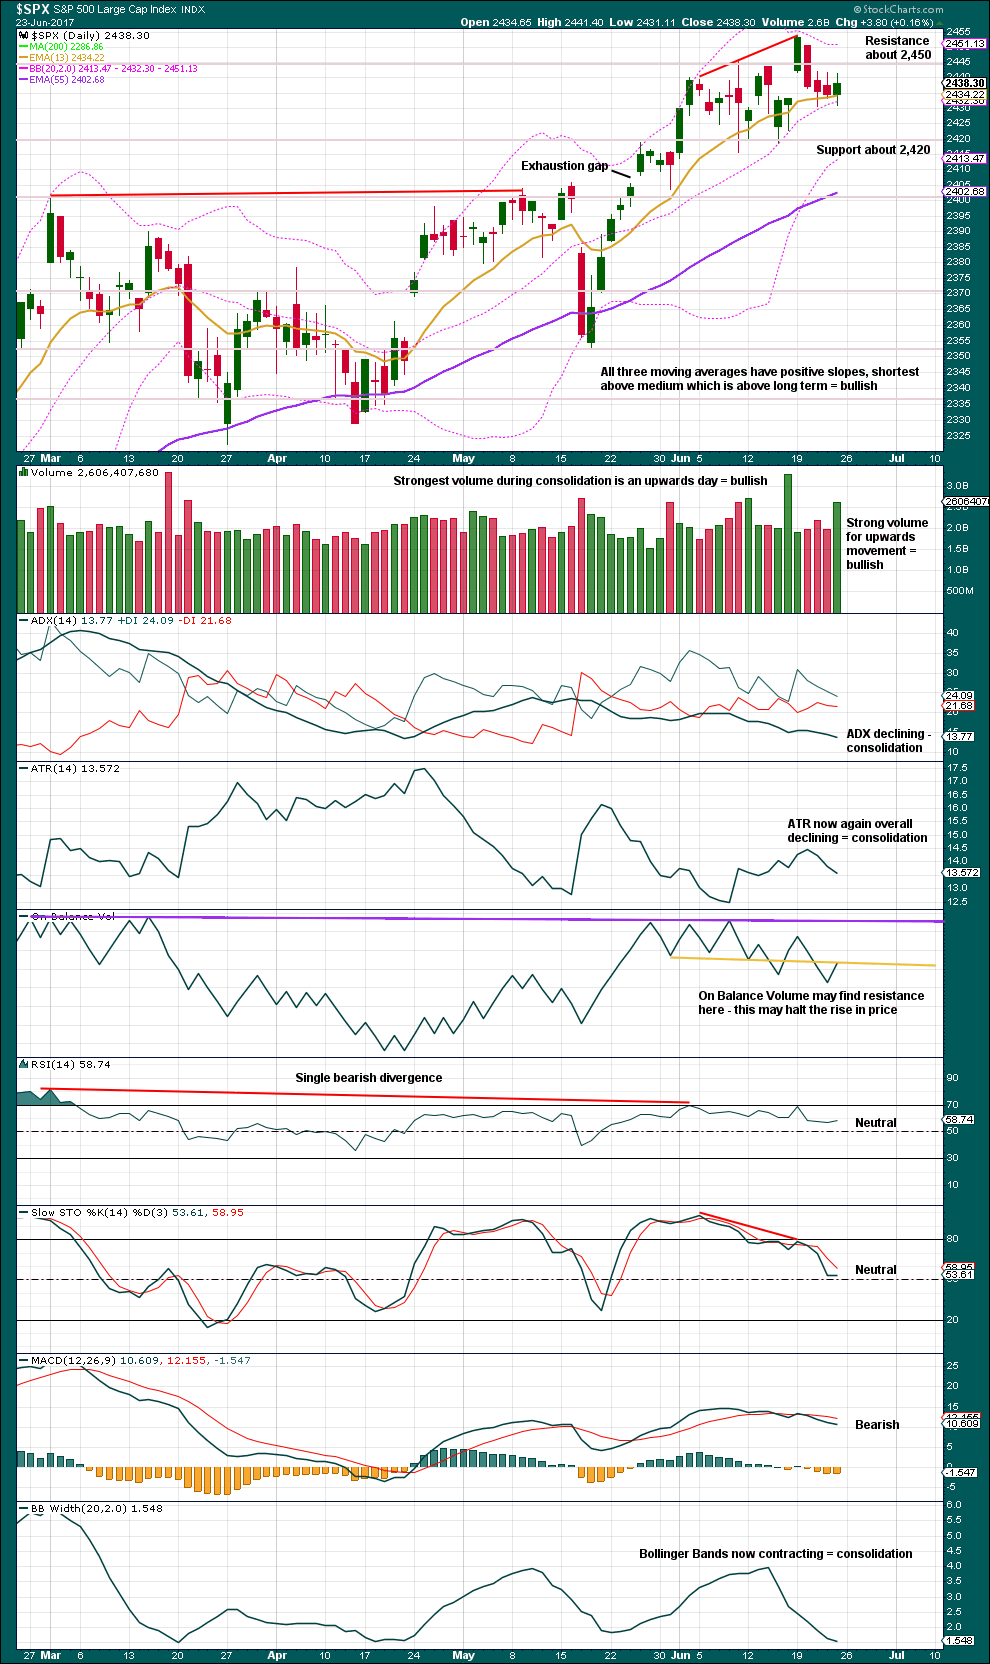
Click chart to enlarge. Chart courtesy of StockCharts.com.
During this consolidation, it is the upwards day of the 16th of June that has strongest volume. This still suggests an upwards breakout is more likely than downwards.
Friday’s session made a slightly lower high and a lower low, the definition of downwards movement. However, the candlestick closed green and the balance of volume was upwards. Strong volume for Friday will be read as bullish. This supports the main Elliott wave count.
If Monday sees a downwards day and On Balance Volume turns lower, resistance at the yellow line would be strengthened and it would provide a bearish signal. If Monday sees an upwards day and On Balance Volume breaks above the yellow line, that would be a weak bullish signal.
VOLATILITY – INVERTED VIX CHART
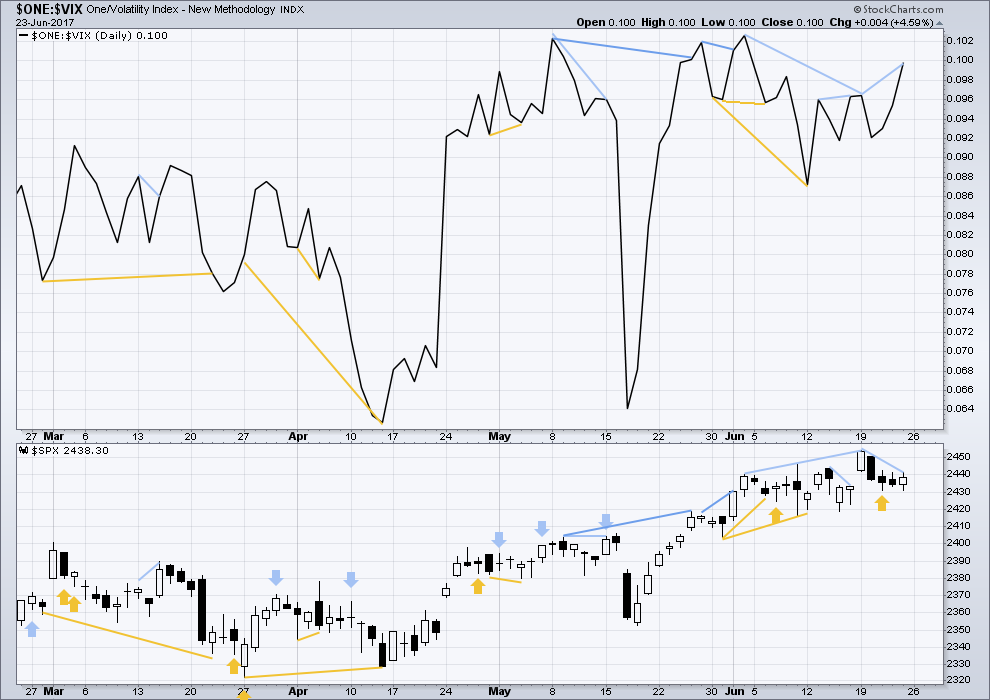
Click chart to enlarge. Chart courtesy of StockCharts.com.
Normally, volatility should decline as price moves higher and increase as price moves lower. This means that normally inverted VIX should move in the same direction as price.
There is new bearish divergence between price and inverted VIX: from the last all time high of the 19th of June price made a lower high, but inverted VIX made a higher high. This indicates weakness within upwards movement during Friday’s session.
BREADTH – AD LINE
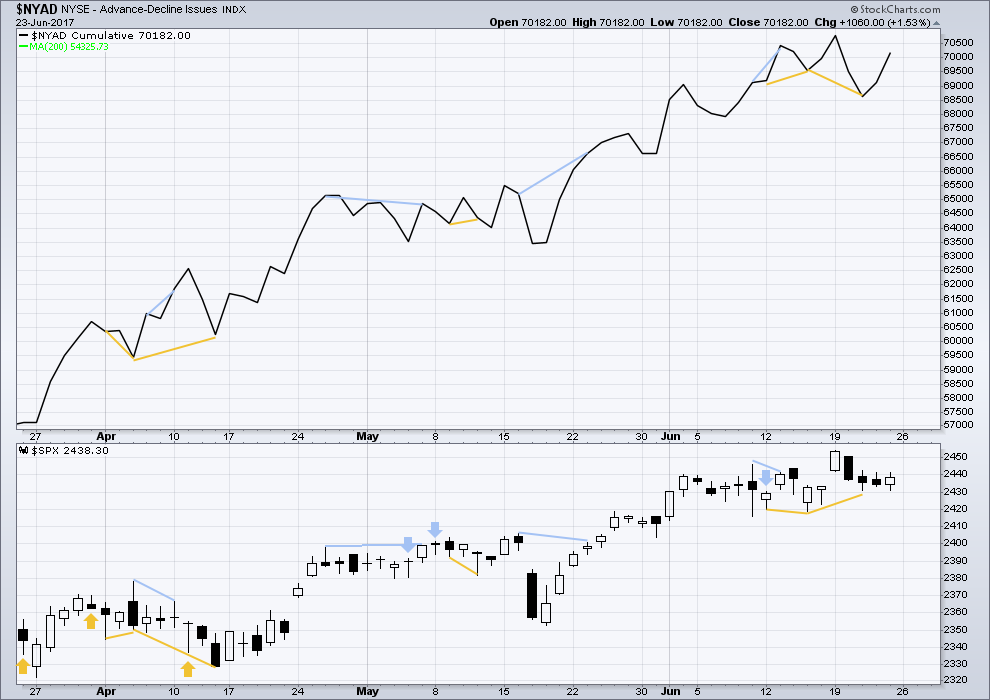
Click chart to enlarge. Chart courtesy of StockCharts.com.
With the last all time high for price, the AD line also made a new all time high. Up to the last high for price there was support from rising market breadth.
There is normally 4-6 months divergence between price and market breadth prior to a full fledged bear market. This has been so for all major bear markets within the last 90 odd years. With no divergence yet at this point, any decline in price should be expected to be a pullback within an ongoing bull market and not necessarily the start of a bear market.
There is no new divergence today between price and the AD line.
The mid caps and small caps have made new all time highs along with recent last all time high for large caps. The rise in price is seen across the range of the market, so it has internal strength.
DOW THEORY
At the end of this week, DJIA and the S&P500 have all made new all time highs. DJT and Nasdaq this week did not make new all time highs. However, at this stage, that only indicates some potential weakness within the ongoing bull market and absolutely does not mean that DJT and Nasdaq may not yet make new all time highs, and it does not mean a bear market is imminent.
The following lows need to be exceeded for Dow Theory to confirm the end of the bull market and a change to a bear market:
DJIA: 17,883.56.
DJT: 7,029.41.
S&P500: 2,083.79.
Nasdaq: 5,034.41.
Charts showing each prior major swing low used for Dow Theory are here.
This analysis is published @ 09:29 p.m. EST on 24th June, 2017.
I’m not comfortable with all this overlapping. It signals an increase in momentum to come. But it looks corrective.
Looks like a redux of the minor 1 and two move – gap up and refill for first and second waves. Interesting.
The new paradigm of central banks’ relentless stock purchases sheds light on the seemingly conflicting signals of market breadth. What is going on becomes clearer as the scope and nature of the central banks’ purchases are uncovered. The worsening bifurcation has been of course captured by the increasing volume of stocks hitting new 52 week lows on NYSE despite continuing advance in the A/D line along with price. The banksters have been focusing their fire power on the perceived “healthy” companies and so we have seen almost parabolic moves in some particular stocks, especially in the Nasdaq. The weighting of these stocks has accounted for most of the gains in the index, and the same thing is happening in other indices because of this kind of focused buying. This is nothing new. It is exactly in fact what gives rise to the Hindenburg Omen. Despite this stratgem’s ability to prolong upwards movement in a fractured market, a day of reckoning always arrives. There are certain sectors that have been in a death spiral which will continue, sectors like oil producers and explorers, and retail. At some point an inflection point will arrive, where concentrated buying in a few names becomes insufficient to keep indices aloft. What happens at that point is not merely a market correction, as is normally the case with healthy markets. What transpires is a wholesale collapse. People talking about DOW 25,000.00 and S&P 500 3000.00 have simply not done their homework. We have recently had a remarkable SIX Hindenburg Omen observations which is telling us that the kind of market bifurcation I have been referring to has become extreme. The banksters are trapped. The cannot afford to buy the entire market, so they have done the next best thing. It did not work the last time they attempted it, why would anyone think this time is different.
Here is a link to one of the best treatments of the significance of the Hindenburg Omen I have read. It is worth the time to read through several times to grasp the underlying idea, and why it is important to pay attention when they occur.
https://www.technicalindicatorindex.com/subscribers/guest-articles/Hindenburg%20Article%20June%205th%2C%202017%20McHugh%20backup.pdf
Wonderful, thank you so much for sharing that report Verne. Just read it.
So there is a 1 in 5 chance that the alternate Elliott wave count is correct, and we could see a rapid plunge for an early part of primary wave 4. That’s how I’m reading this.
Yes indeed. My thinking exactly. I have learned to pay great respect to your bullish counts as they are usually right when my own bearish leanings are wrong, but I am keeping extremely tight stops on long trades. I am also looking at the remarkable trading in VIX and think we are closer to the end of a bullish run than the start of an extended one.
The upwards movement in the index is dominated by large caps. Small caps are weakest.
Some sectors are faring worse than others. The energy sector is weakest, next is basic materials then consumer cyclicals (many in the depressed retail group).
Healthiest sectors are finance and utilities.
This would normally be seen at the end of full expansion and the start of early recession for the business cycle. So this information of strength and weakness within sectors may be a warning the US economy is about to move into early recession.
Now, the thing that is different this time is the financial cycle is either lagging or disconnected from the business cycle. At the end of the business cycle expansionary phase, and early recession, the financial cycle should already be in a bear market.
But the S&P 500 is very clearly NOT in a bear market. The bull market continues.
Lara, projecting your current EW is correct and we are very close to 2500, is it possible you could show probable outcome after the 2500 point?
Well, it would look exactly the same as the main wave count. But the target would be higher.
As I suspected, there are indeed two different measurements for market breadth. One is the A/D line, and the other is new NYSE 52 week lows, used in HO calculations.
Very interesting situation. Unless the remainder of intermediate five stretches out for many months, there does not seem to be enough time for market breadth deterioration one would expect to signal the impending end of the bull run. If the main count proves correct, two major turn dates would have been negated- Bradley on June 20, and Pancholi on June 22 ; quite remarkable. It does not look to me like we have actually made a major turn. Friday’s price action struck me as being quite bullish- while the gap was filled, price has remained in the area and no important other support levels were broken, which I would expect for an initial impulse down at a trend change at this degree. NDX is also a puzzle. The initial impulse down was over in two days, and what would be a second wave has now lasted two weeks! Something doesn’t quite jive…I don’t think we have a turn just yet.
Methinks they push it until collapse. From shorting VIX and Gold to buying indexes and bonds then individual names, they have successfully created traded asset scarcity. On top of all that, we can see that they have mastered manipulating the algo machines. Could be years, could be days…..
Yep. They dumped 300 tons of naked short Gold contracts this morning.
I just read about the eye-popping figure the Swiss National Bank has tied up in tech stocks. It explains the manic, almost unnatural rise in that sector.
Case in point, full reversal, gap fill, followed by panic buy
Yes indeed. The dance macabre continues. Impulsive moves down, tortured rising wedges back up. The amplitude will likely increase.
every VIX pop is slammed. Rising wedges be damned….:)
Oil move today looks insane as well
Oil has had a nice 3 day correction which remains within a channel. A good entry to add to short positions.
Funny you should mention it…I took advantage of the recent pop to do precisely that as per that marvelous oil wave count you so kindly provided! 🙂
Good proxies: APC, MUR, DVN, ERY, DRIP. OIH, USO.
DRIP and ERY are leveraged ETFs with the former being a bit of a volatile animal.
“Bankers warn next global crash could arrive ‘with a vengeance'”
Chris I thought you would get a chuckle from this headline out of the UK Independent.
Ya think??!!!! 😀
I saw, pretty funny finally
Amazingly nobody has claimed first spot.
Drats!