
Price remains above the invalidation point, but the closure of the last gap and price moving back down into the prior consolidation zone puts the breakout as false. The gap was a pattern gap and not a breakaway gap.
Summary: Assume the trend remains the same, upwards, until proven otherwise; while price remains above 2,422.88, assume the trend remains upwards. The target zone calculated at two wave degrees is 2,500 to 2,501. Bullish divergence today both in VIX and market breadth supports the idea that price may move higher tomorrow.
If price makes a new low below 2,422.88, then we shall expect a deeper multi week pullback to end somewhere between 2,400 to 2,322.
Always use a stop. Invest only 1-5% of equity on any one trade.
Only one alternate Elliott wave count will be published today, for clarity.
New updates to this analysis are in bold.
Last monthly and weekly charts are here. Last historic analysis video is here.
MAIN ELLIOTT WAVE COUNT
WEEKLY CHART
Click chart to enlarge.
This wave count has a better fit with MACD and so may have a higher probability. However, at this stage it expects the bull market to come to an end quickly. With market breadth not yet exhibiting any divergence with price this looks unlikely. The alternate should be taken very seriously.
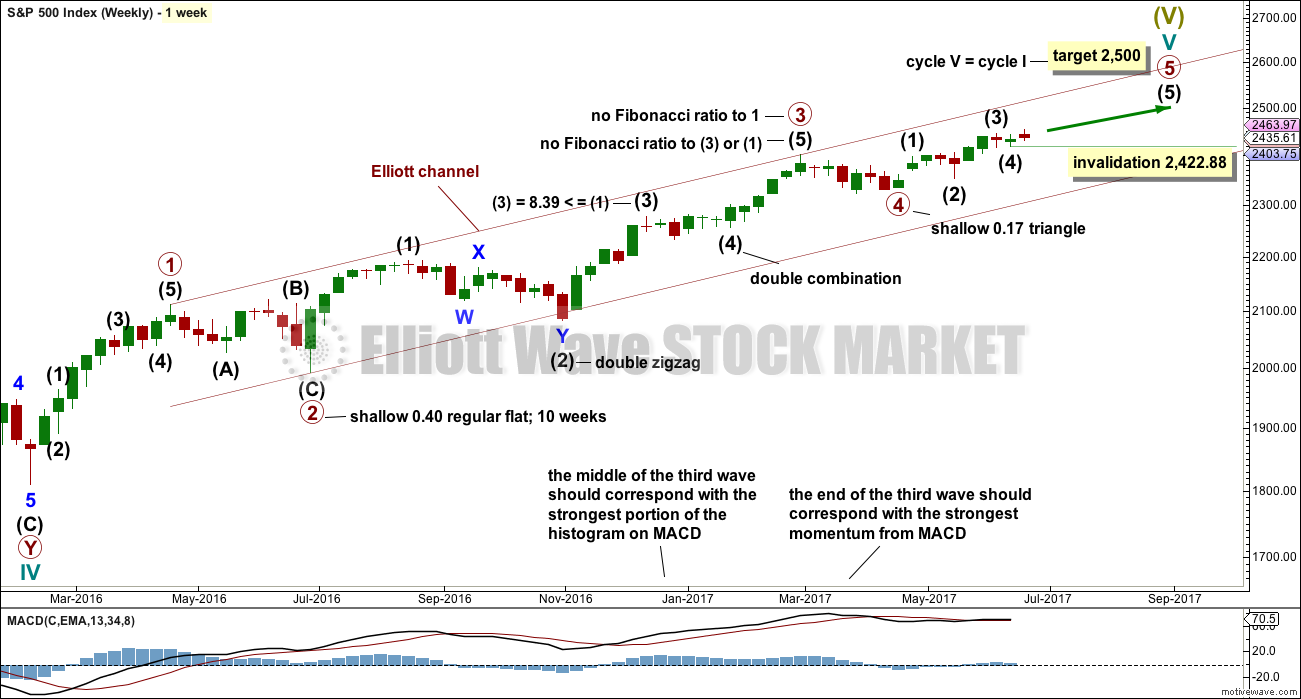
Primary wave 3 may be complete, falling short of 1.618 the length of primary wave 1 and not exhibiting a Fibonacci ratio to primary wave 1. There is a good Fibonacci ratio within primary wave 3.
The target for cycle wave V will remain the same, which has a reasonable probability. At 2,530 primary wave 5 would reach 0.618 the length of primary wave 1. If the target at 2,500 is exceeded, it may not be by much.
There is alternation between the regular flat correction of primary wave 2 and the triangle of primary wave 4.
Within primary wave 3, there is alternation between the double zigzag of intermediate wave (2) and the triangle of intermediate wave (4).
Within the final wave of intermediate wave (5), no second wave correction may move beyond its start below 2,422.88.
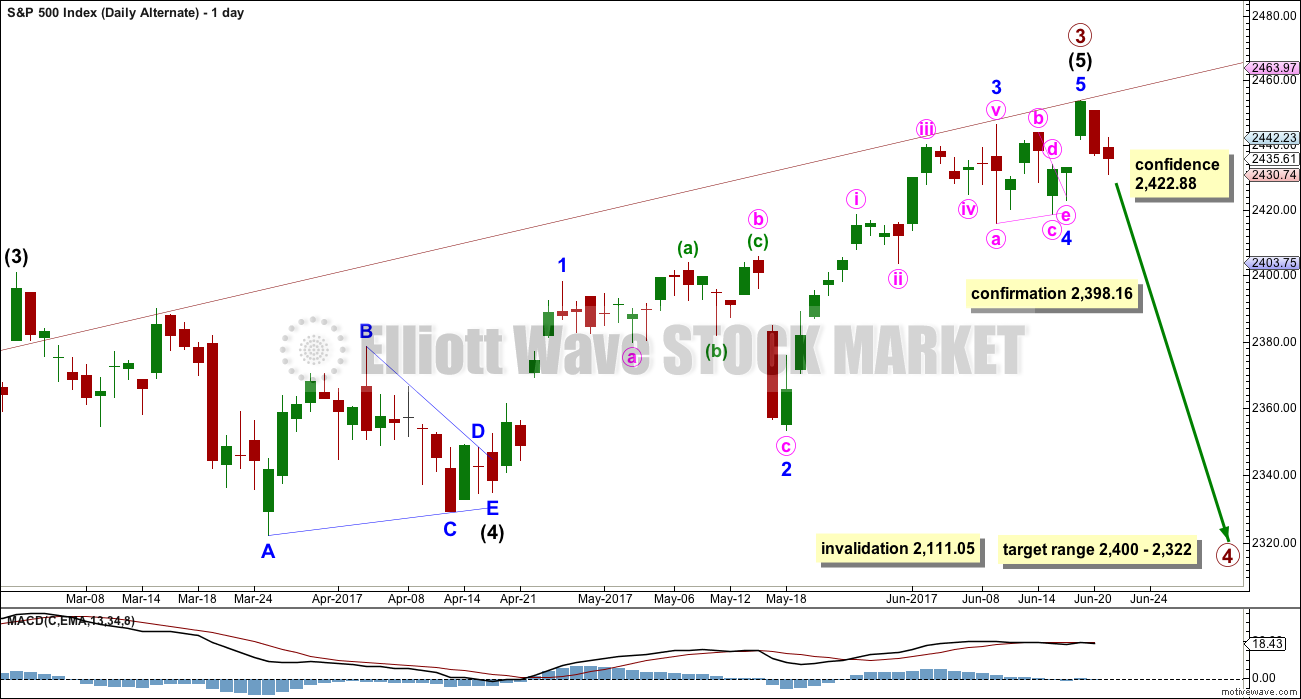
DAILY CHART
Click chart to enlarge.
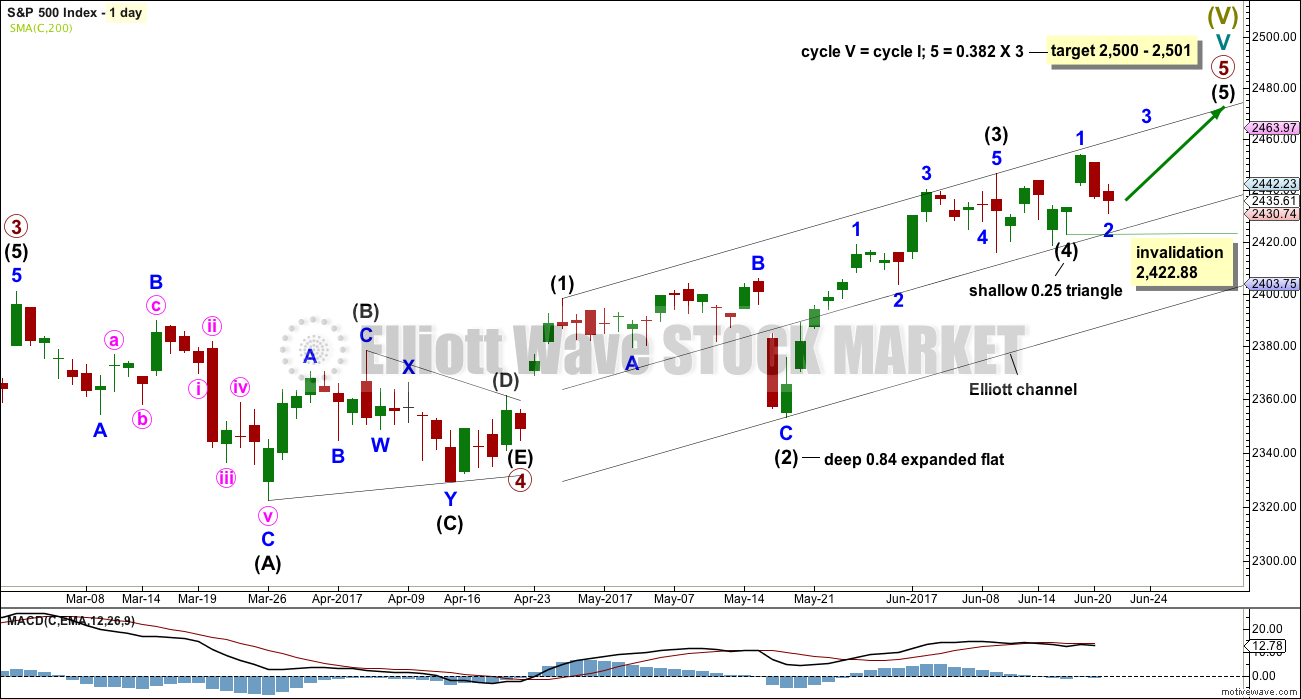
Primary wave 5 must complete as a five wave motive structure, either an impulse (more common) or an ending diagonal (less common). So far, if this wave count is correct, it looks like an impulse.
Intermediate wave (3) is a complete impulse. Intermediate wave (4) may be a complete triangle.
Intermediate wave (5) must be a five wave motive structure.
Within intermediate wave (5), minor wave 1 is now complete. Minor wave 2 may not move beyond the start of minor wave 1 below 2,422.88.
HOURLY CHART
Click chart to enlarge.
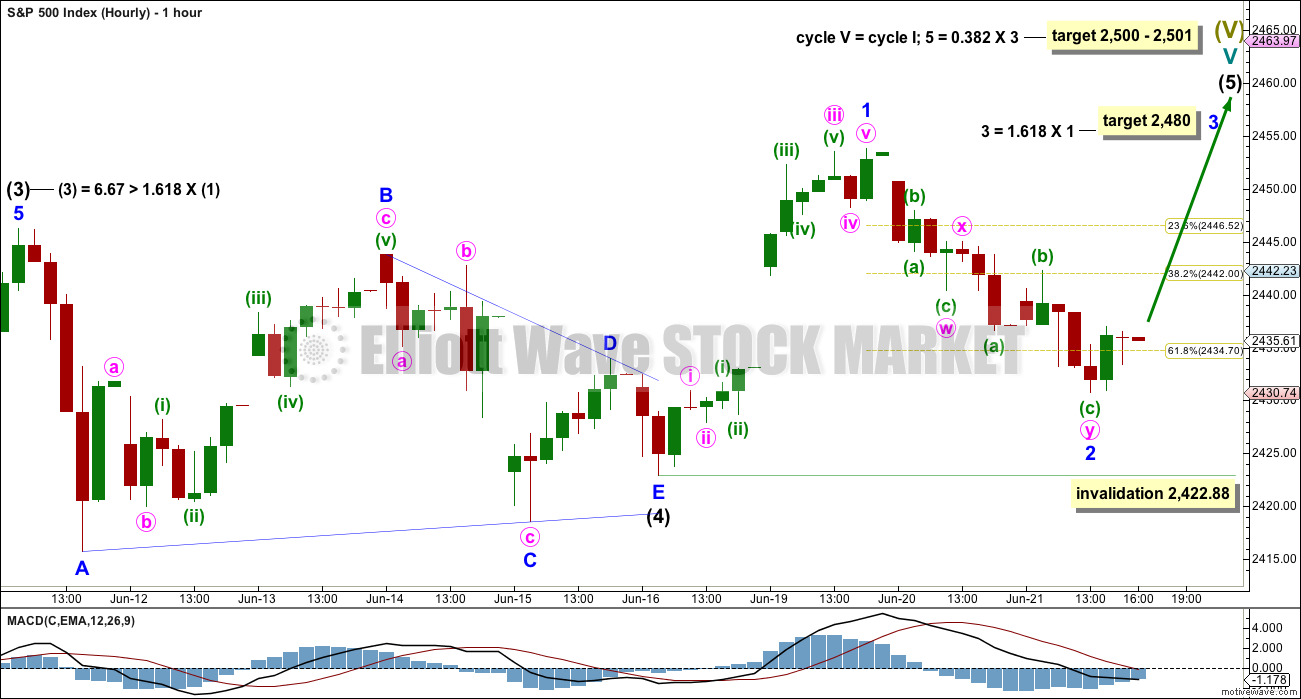
Intermediate wave (4) fits as a regular contracting triangle, which may have come to a more swift end than expected.
Intermediate wave (5) may have begun.
Minor wave 2 is now a very deep correction and fits as a double zigzag. But with price now back within the prior consolidation zone the probability of this wave count has reduced.
Downwards movement for minor wave 2 does look choppy and corrective, compared to prior upwards movement for minor wave 1 which looks clearer and impulsive.
The target for minor wave 3 is recalculated.
ALTERNATE ELLIOTT WAVE COUNT
WEEKLY CHART
Click chart to enlarge.
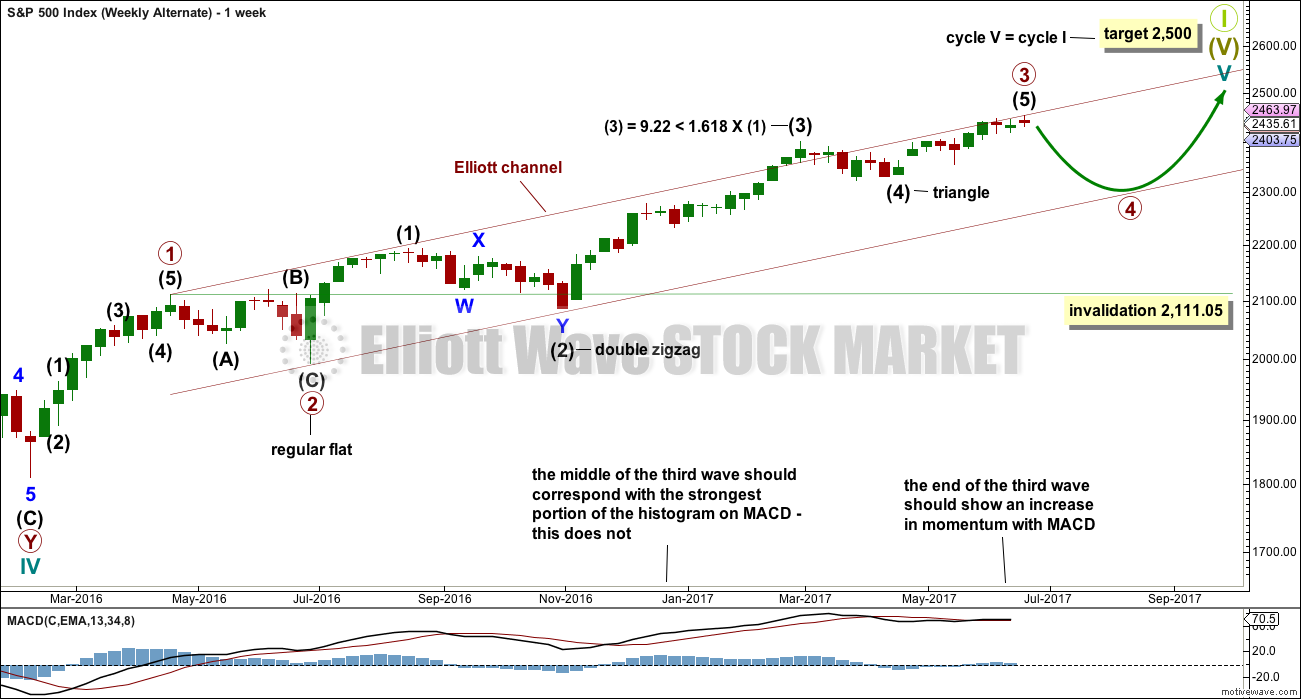
It is possible that primary wave 3 is either over now or may be very soon indeed. It is possible that a deep multi week or multi month pullback may begin for primary wave 4.
This wave count would allow for primary wave 4 to unfold with a corresponding decline in market breadth. Primary wave 5 may then continue higher towards the target, allowing for at least 4 months of divergence between market breadth and price to develop before an end to the ageing bull market. This would have a neat fit with prior major trend changes from bull to bear of every single bear market in the last 90 odd years.
Primary wave 2 was a regular flat correction lasting 10 weeks. Primary wave 4 may exhibit alternation as a single or multiple zigzag, or as a triangle. It should last at least 10 weeks and possibly longer.
Primary wave 4 may not move into primary wave 1 price territory below 2,111.05.
DAILY CHART
Click chart to enlarge.
Minor wave 5 of intermediate wave (5) of primary wave 3 may be over here, or it may continue higher.
Always assume the trend remains the same until proven otherwise; assume the trend is upwards until price makes a new low below 2,422.88.
If price moves below 2,422.88, then this would be the main wave count.
Primary wave 4 may end within the price territory of the fourth wave of one lesser degree. The price range for intermediate wave (4) gives a target range for primary wave 4.
TECHNICAL ANALYSIS
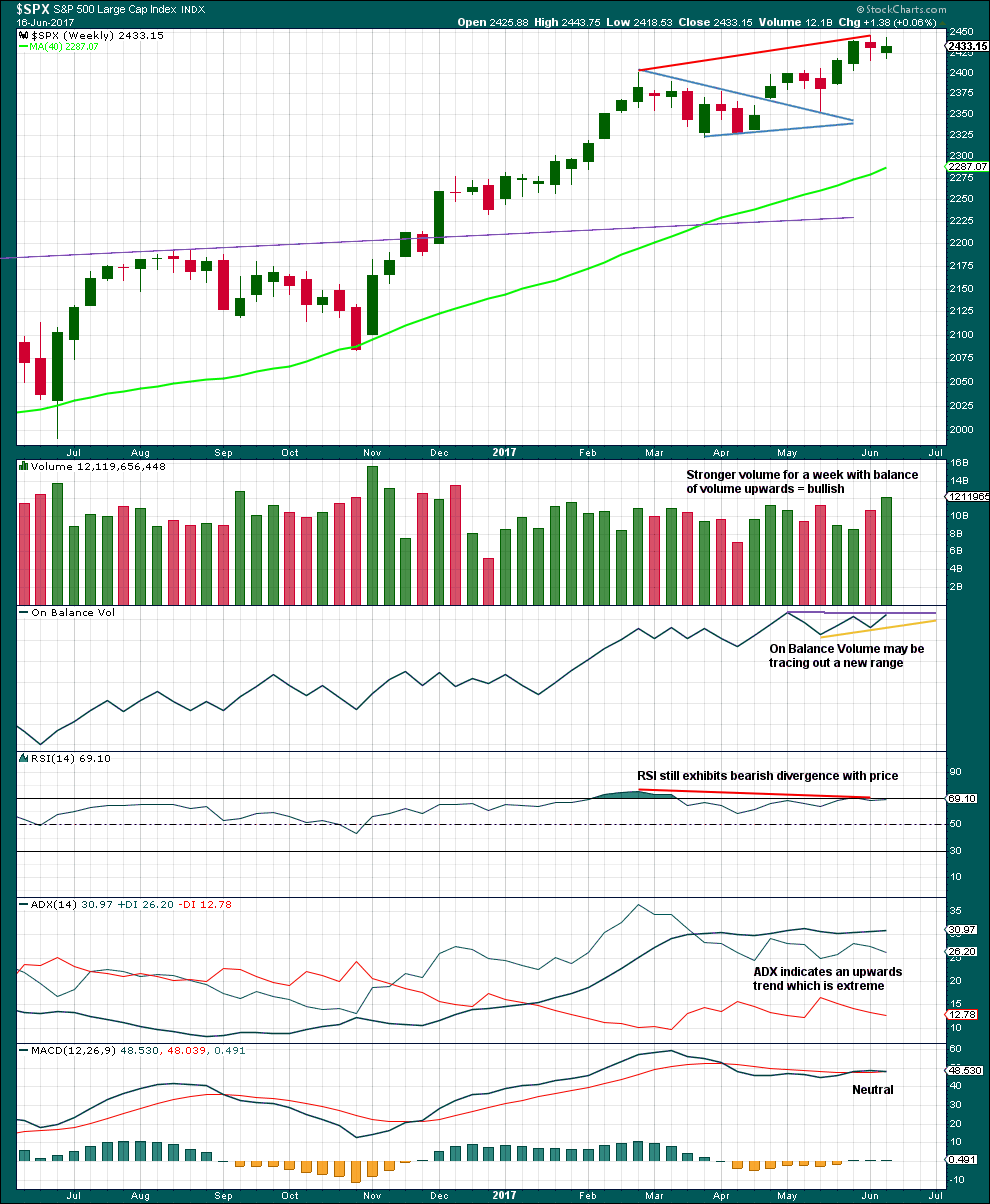
WEEKLY CHART
Click chart to enlarge. Chart courtesy of StockCharts.com.
An inside week completes a small spinning top candlestick pattern. This puts the trend from up to neutral; price is consolidating. A spinning top is a pause within a trend.
An increase in volume suggests that the breakout after consolidation is likely to be upwards.
On Balance Volume trend lines are adjusted.
DAILY CHART
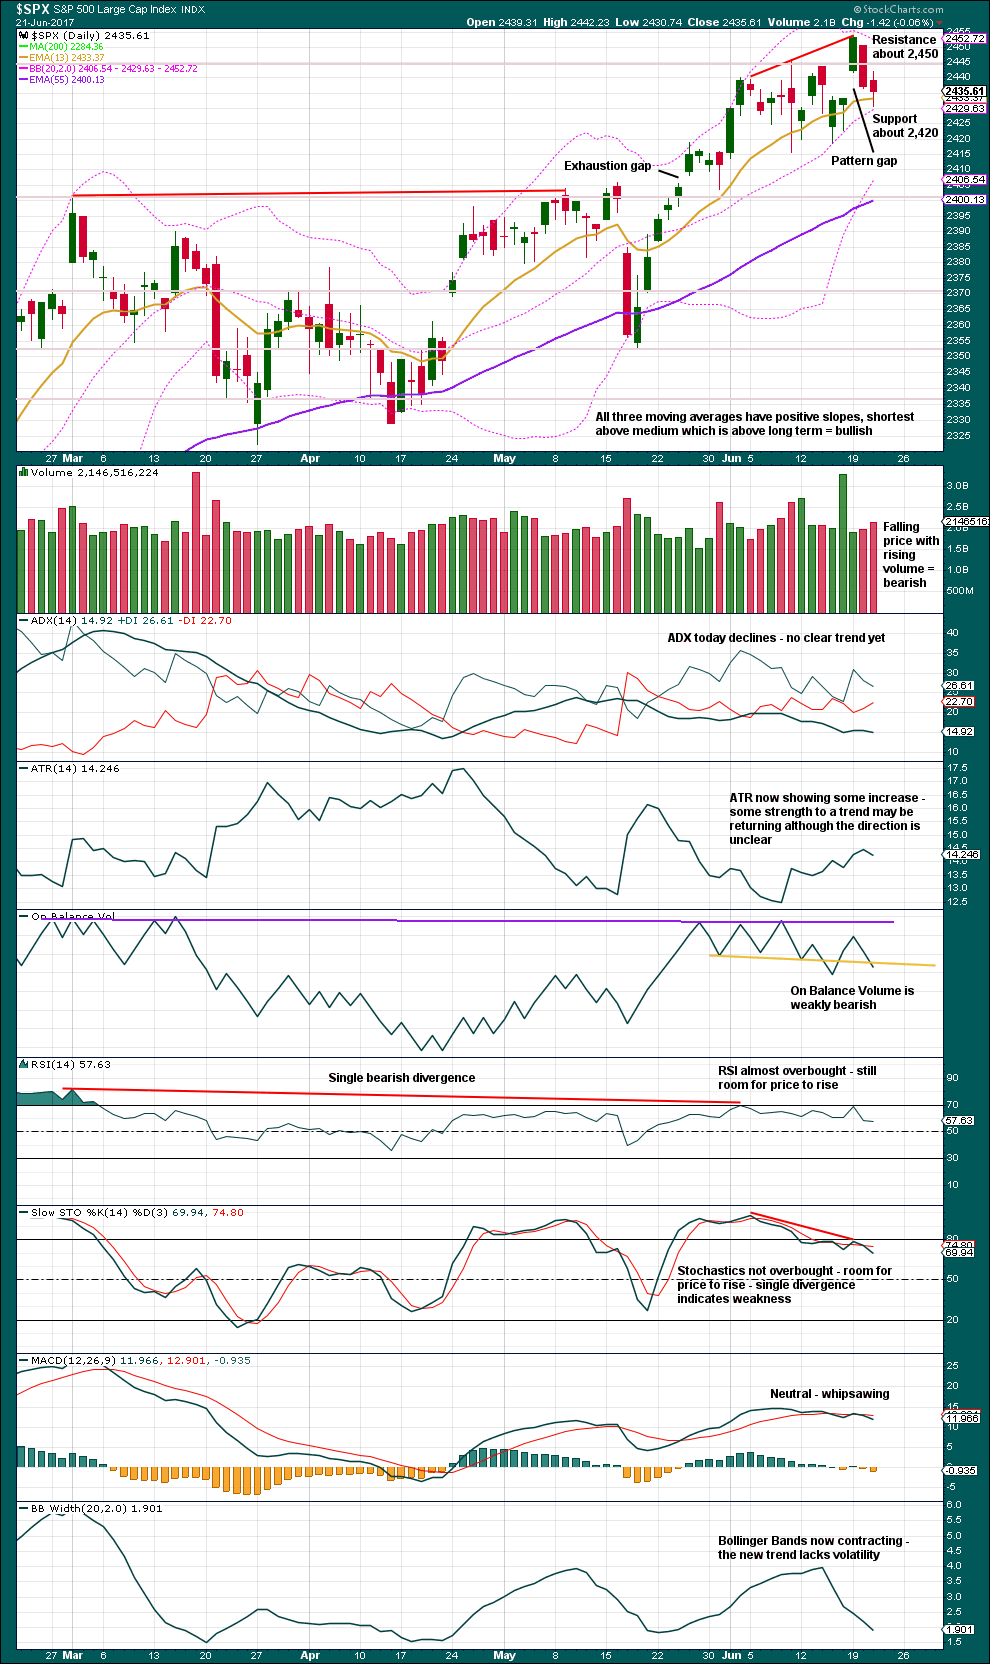
Click chart to enlarge. Chart courtesy of StockCharts.com.
The upwards breakout is now proven to be false as price is back within the consolidation zone and the last gap is closed.
During this consolidation, it is the upwards day of the 16th of June that has strongest volume. This still suggests an upwards breakout is more likely than downwards.
Short term volume and On Balance Volume are slightly bearish.
Stochastics supports the alternate Elliott wave count.
VOLATILITY – INVERTED VIX CHART
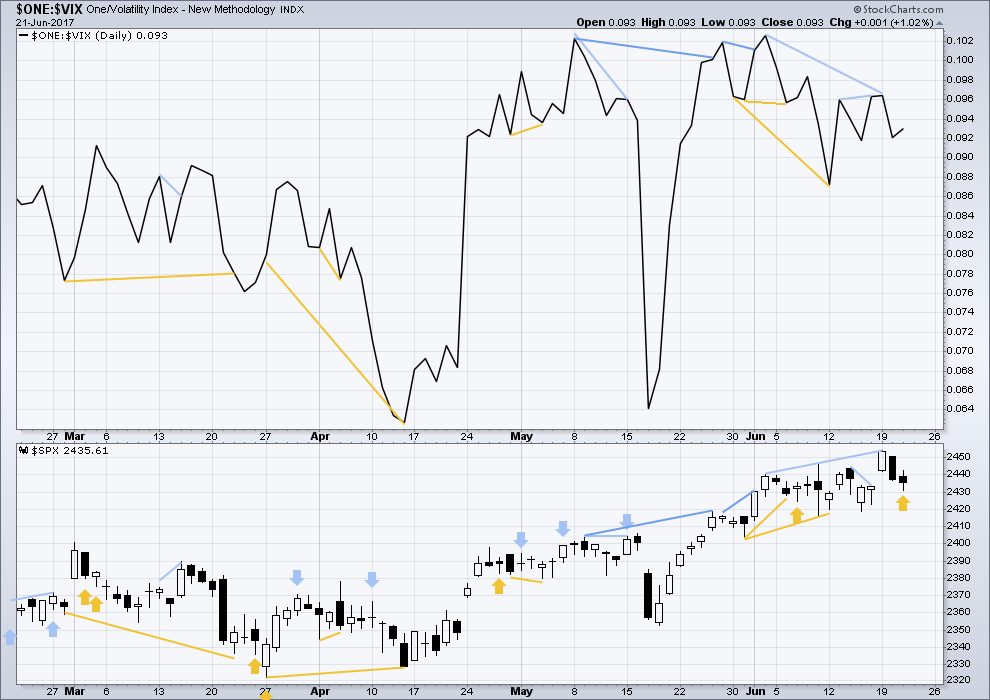
Click chart to enlarge. Chart courtesy of StockCharts.com.
Normally, volatility should decline as price moves higher and increase as price moves lower. This means that normally inverted VIX should move in the same direction as price.
There is single day divergence between price and VIX today: price made a lower low, but volatility declined. This indicates weakness today within downwards movement for price, and this divergence is bullish.
BREADTH – AD LINE
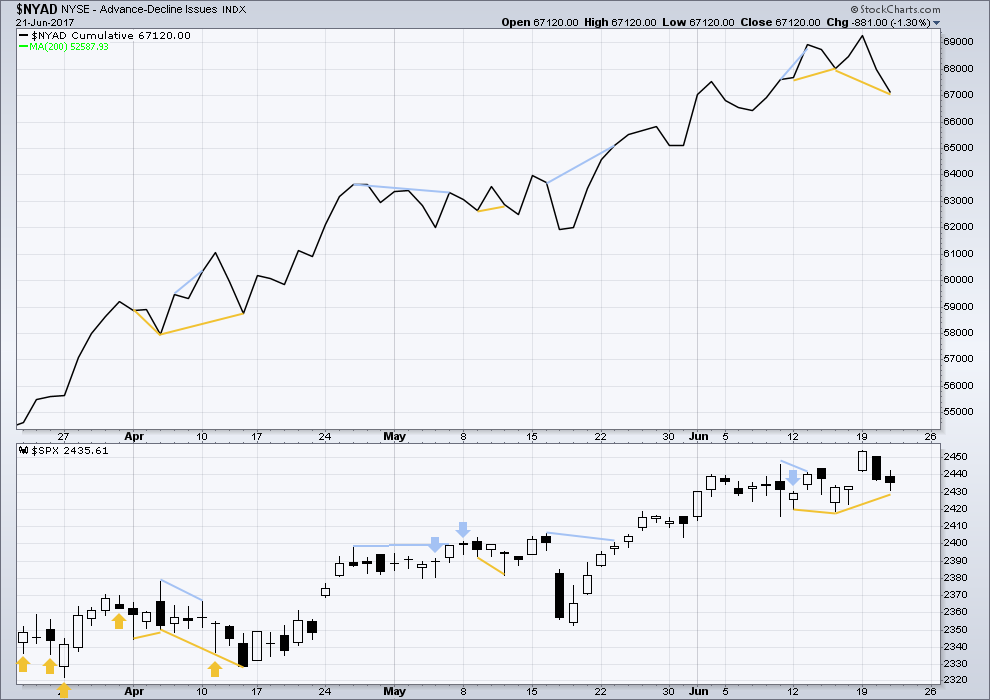
Click chart to enlarge. Chart courtesy of StockCharts.com.
With the last all time high for price, the AD line also made a new all time high. Up to the last high for price there was support from rising market breadth.
There is normally 4-6 months divergence between price and market breadth prior to a full fledged bear market. This has been so for all major bear markets within the last 90 odd years. With no divergence yet at this point, any decline in price should be expected to be a pullback within an ongoing bull market and not necessarily the start of a bear market.
There is clear bullish divergence today between price and the AD line: the AD line has made a new low below the prior low of the 15th of June, but price has not. This divergence indicates there is weakness within downwards movement here for price.
The mid caps and small caps have made new all time highs along with recent last all time high for large caps. The rise in price is seen across the range of the market, so it has internal strength.
DOW THEORY
At the end of last week, DJIA, Nasdaq and the S&P500 have all made new all time highs. DJT has failed to confirm an ongoing bull market because it has not yet made new a all time high. However, at this stage that only indicates some potential weakness within the ongoing bull market and absolutely does not mean that DJT may not yet make new all time highs, and it does not mean a bear market is imminent.
The following lows need to be exceeded for Dow Theory to confirm the end of the bull market and a change to a bear market:
DJIA: 17,883.56.
DJT: 7,029.41.
S&P500: 2,083.79.
Nasdaq: 5,034.41.
Charts showing each prior major swing low used for Dow Theory are here.
This analysis is published @ 07:05 p.m. EST.
Hi Lara I have TA question. I know we are expecting a market price and breadth divergence for several months before we can expect an end to the bull market as this is what has been typically seen in the past. On the other hand, several analysts are talking about a “blow-off” top to end the bull run with a lot euphoria as that is also a hall-mark of an important top. It seems to me, and I could be wrong, that a blow-off market top is one that would be ending on market strength and not market weakness, as would be indicated by price/breadth divergence. I guess what I am saying is that both conditions would at first glance appear to be mutually exclusive. Higher prices on breadth weakness I can imagine, but harder to imagine a true blow-off type top with out broad market participation and thus improving as opposed to deteriorating market breadth. Thanks for your thoughts. 🙂
I unloaded my DIA calls at the high this morning. Still holding a couple 215 calls expiring tomorrow. The endless chop continues…both counts still in play it would seem.
I cannot get past the fact that the move down so far is simply not impulsive and that implies new highs ahead, despite the gap fill. What to make of it??
The chart below is of UPRO. I think it helps illuminate what is going on in SPX. A rising wedge is an ominous pattern. After seeing this chart, I am not initiating any new long trades. Exiting all others this or next week (2470)
Thanks Rodney, that’s fairly ominous for sure. If we are to get a 4th wave , then it may retest the November 2016 breakout.
I agree. It is quite amazing how many charts are sporting that rising wedge pattern, and a few of them have already decisively broken from it.
Does anyone follow Martin Armstrong and his 51.6 and 8.6 year cycles?
The smaller cycle was derived from pi times 1000 which equals 3141 days.
What is interesting is that during his famous trial the banksters insisted that he turn over his source code for his timing model even though that had nothing to do with what he was charged with. I guess they wanted to eliminate the competition. His 8.6 cycle is due this September.
I get 2216 for a large 4th wave correction, which is the 38.2% correction level off of the FEB 2016 low, that being said the trendline connecting the lows is around 2320
2220 or 2320 are very likely support levels for a P4 down. If it turns out to be some kind of triangle it could be shallower. Let’s hope we get a good old fashioned Zig Zag down. I fear the relentless pumping is probably going to result in something more torturous and protracted though. 🙁
Are we seeing a repeat of the May 25 gap that was filled only to see price turn right around and go higher?
That was exactly my question when I looked at the charts yesterday.
Buying XBI 80 strike puts expiring next week for 1.90 on principle.
Classic RTM set-up. Looking to exit with close back below upper BB for a short trade. The break-out probably has legs coming after about a year of consolidation.
Be Careful… 30 Year US Treasury Yield down to 2.713% this morning…
It continues to decline in Yield.
Yes… High Yield {AKA Junk Bonds}… always decline in price before Stocks.
The junk bonds ETFs attempting an anemic bounce today but I doubt they will get back to the underside of the broken wedge.
Junk bonds (HYG,JNK) are impulsively breaking down from a bearish rising wedge, a pattern that seems to be everywhere you look these days. Not too surprising considering the FED’s hawkish recent pronouncements. Where junk bonds go, stocks generally follow…
That would be nice. That alternate wave count could have such a neat ending… very satisfying analytically it would be.
It sure would be a text book ending. The fourth wave correction could end up being a bit of a grind as the banksters fight it tooth and claw. Five Hindenburg Omens in the last few weeks suggest the market is much wraker than it appears yet it continues to show remarkable resistance to any serious correction. Futures suggesting the grind will continue today. Tough to trade in this environment.
As you know, the topping process can be a long grind with many whipsaws. Yes it is tough to trade. That is why I am so happy the topping process works out with my vacation schedule. That being said, I am enticed to enter one more short term long trade today with the thought of being out within a week. We’ll see.
We have seen over time that this sort of protracted sideways price action generally leads to another upside move so I suspect we go higher from here. I am still holding a small upside hedge with 215 diamond calls, and the long side of a bearish credit spread I closed on the move down that goes out another week. We’ll see what develops. I expect the chop to continue.