Price remains range bound, which was expected.
Wednesday completed an outside day that closed red.
Summary: Expect a sideways consolidation to continue this week and likely into next week as well. When it is done, it should offer a good entry point to join the longer term upwards trend.
In the short term, tomorrow may see downwards movement. This is supported by weak volume today and bearish divergence between price and the AD line.
New updates to this analysis are in bold.
Last monthly and weekly charts are here. Last historic analysis video is here.
MAIN ELLIOTT WAVE COUNT
WEEKLY CHART
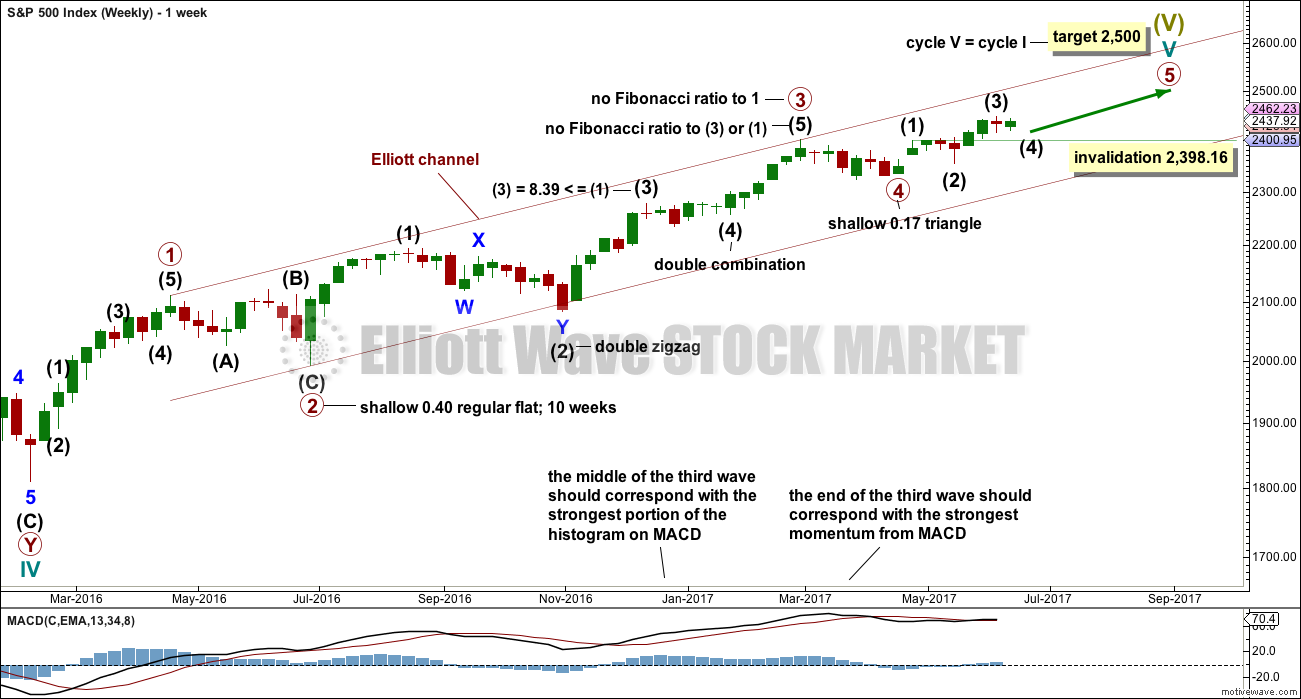
This wave count has a better fit with MACD and so may have a higher probability.
Primary wave 3 may be complete, falling short of 1.618 the length of primary wave 1 and not exhibiting a Fibonacci ratio to primary wave 1. There is a good Fibonacci ratio within primary wave 3.
The target for cycle wave V will remain the same, which has a reasonable probability. At 2,518 primary wave 5 would reach 0.618 the length of primary wave 1. If the target at 2,500 is exceeded, it may not be by much.
There is alternation between the regular flat correction of primary wave 2 and the triangle of primary wave 4.
Within primary wave 3, there is alternation between the double zigzag of intermediate wave (2) and the double combination of intermediate wave (4).
Within primary wave 5, the correction for intermediate wave (4) may not move into intermediate wave (1) price territory below 2,398.16.
DAILY CHART
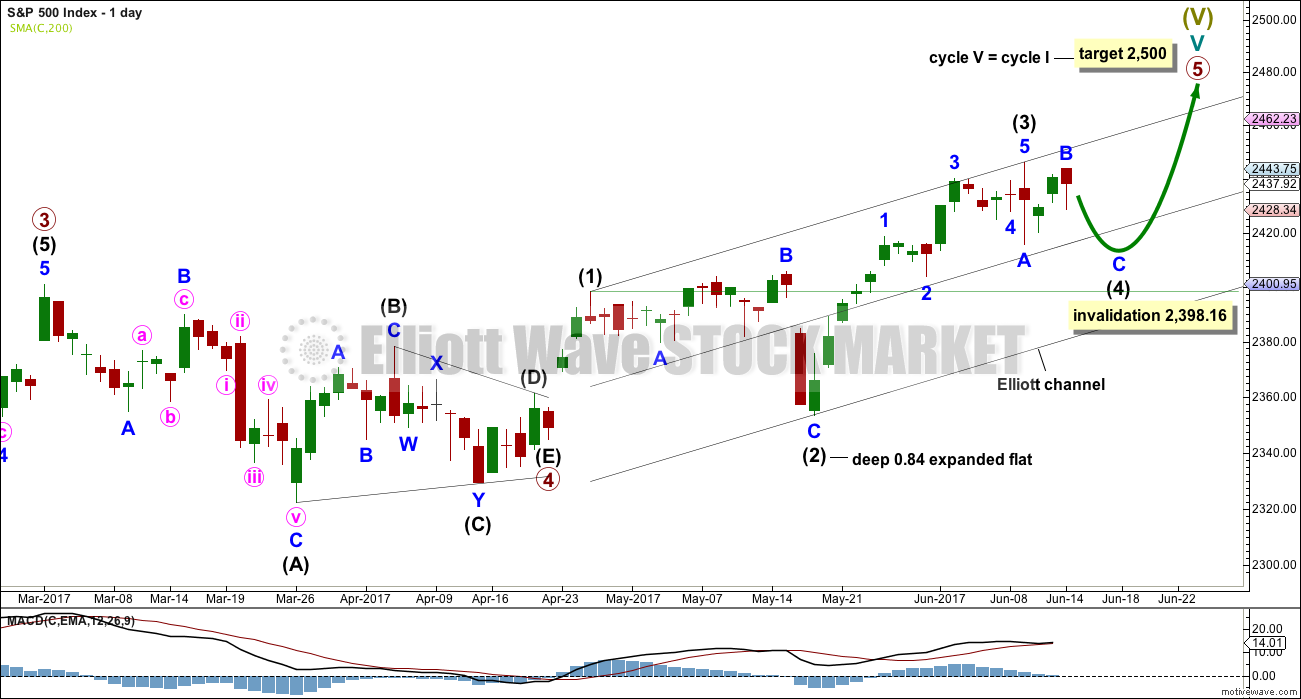
Primary wave 5 must complete as a five wave motive structure, either an impulse (more common) or an ending diagonal (less common). So far, if this wave count is correct, it looks like an impulse.
At the daily chart level, intermediate wave (3) now looks like a complete five wave impulse. With subsequent downwards movement moving into minor wave 1 price territory below 2,418.71, this downwards movement cannot be a continuation of minor wave 4, so minor wave 4 must be over.
Intermediate wave (2) was a very deep 0.84 expanded flat correction. The guideline of alternation tells us to expect a shallow single or multiple zigzag as most likely for intermediate wave (4). It may also be a triangle and achieve alternation in structure.
Intermediate wave (2) lasted 16 sessions. Intermediate wave (4) may be expected to last at least two weeks. Good proportion between corrective waves gives a wave count the right look. If my labelling within intermediate wave (4) so far is wrong, it may be in expecting that minor waves A and B are already over. They may continue further, so labelling within intermediate wave (4) may need to be moved down one degree.
Intermediate wave (4) may end within the price territory of the fourth wave of one lesser degree. Minor wave 4 has its range from 2,440.23 to 2,424.25.
Intermediate wave (4) may not move into intermediate wave (1) price territory below 2,398.16.
HOURLY CHART
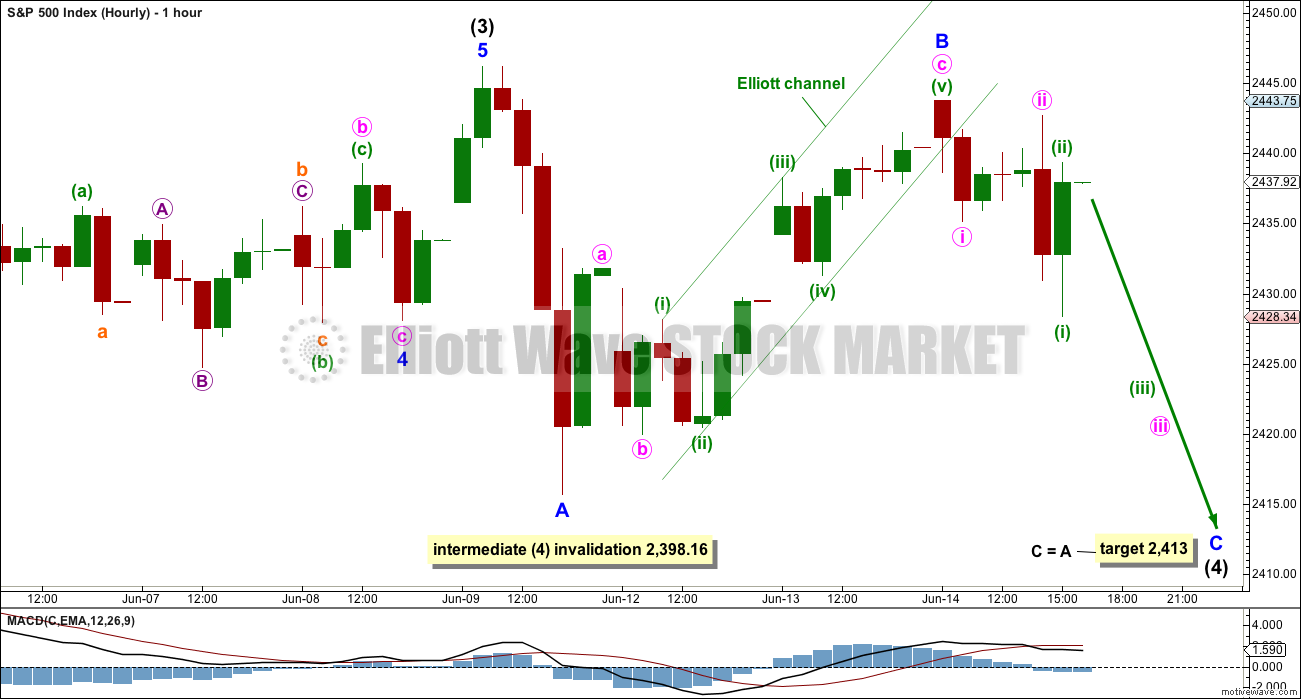
It is impossible to tell if the downwards wave labelled minor wave A is a three wave zigzag or a five wave impulse. It may be either. If it is a three, then minor wave B may make a new all time high as in an expanded flat or running triangle.
It is possible now that minor wave B could be over, or it may continue higher tomorrow as a double zigzag. If it does continue higher, it may also make a new all time high.
Minor wave B may unfold sideways and may last over a week. It may be any one of more than 23 possible corrective structures.
If minor wave B is over as a zigzag, then tomorrow should see price move lower with some increase in momentum.
Depending upon how long it takes, if a five down completes from here, then a zigzag may be complete for intermediate wave (4), or that may only be wave A of a longer lasting triangle for intermediate wave (4).
ALTERNATE WEEKLY CHART
This weekly chart has been published with a slight variation before.
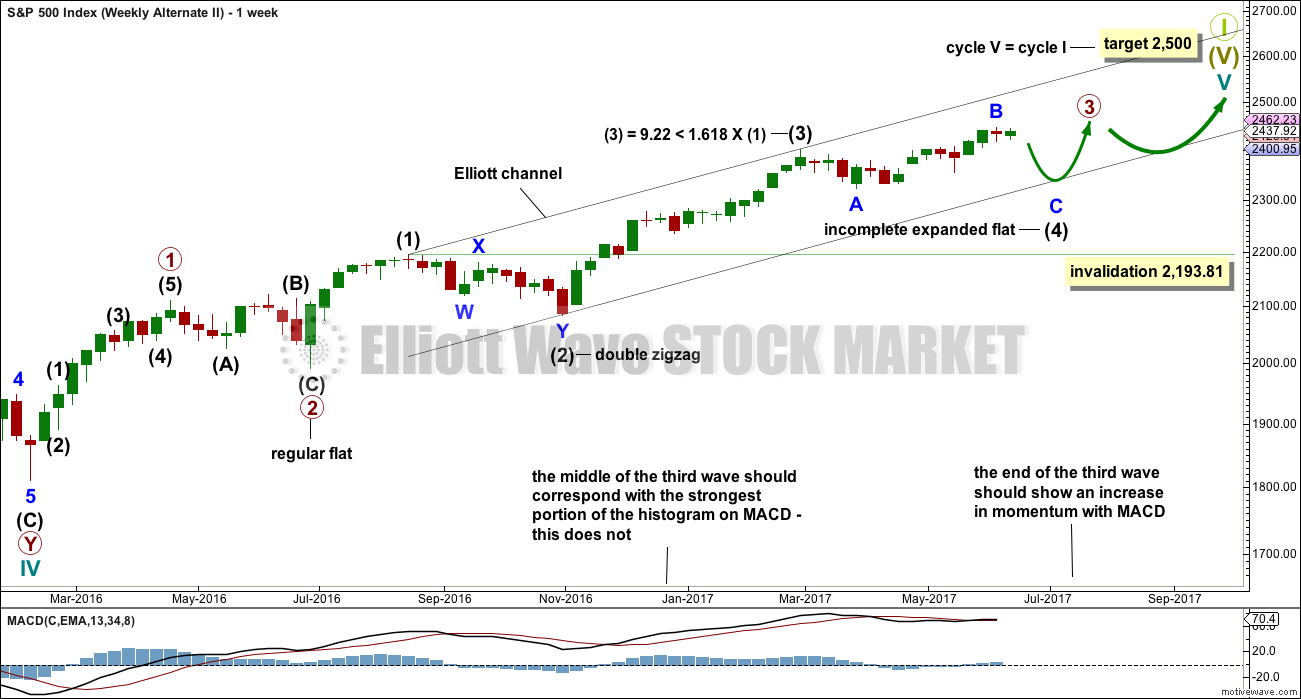
It is still possible that intermediate wave (4) is incomplete and may be continuing as a very common expanded flat correction.
This weekly wave count expects a slow end to Grand Super Cycle wave I at the target at 2,500. Once intermediate wave (4) is over, then intermediate wave (5) would be expected to move above the end of intermediate wave (3) at 2,400.98 to avoid a truncation; it need not make a new all time high (but would be likely to do so).
Thereafter, another multi week sideways correction for primary wave 4 may unfold that must remain above primary wave 1 price territory, which has its extreme at 2,111.05.
Finally, a last upwards wave for primary wave 5 towards the target at 2,500 should show substantial weakness.
This wave count allows for the target at 2,500 to be reached possibly in October.
When looking at upwards movement so far on the monthly chart, the corrections of intermediate waves (2) and (4) show up. This is how the labelling fits best at that time frame.
It is also still possible that the expanded flat correction could be labelled primary wave 4 as per the alternate published here.
ALTERNATE DAILY CHART
Expanded flat corrections are very common structures. They subdivide 3-3-5. Within this one, minor wave B would now be beyond the common range of 1 to 1.38 the length of minor wave A.
Within minor wave C, no second wave correction may move beyond its start above 2,446.20. If price makes a new high above this point, at that stage the idea of an expanded flat correction continuing would be discarded.
TECHNICAL ANALYSIS
WEEKLY CHART
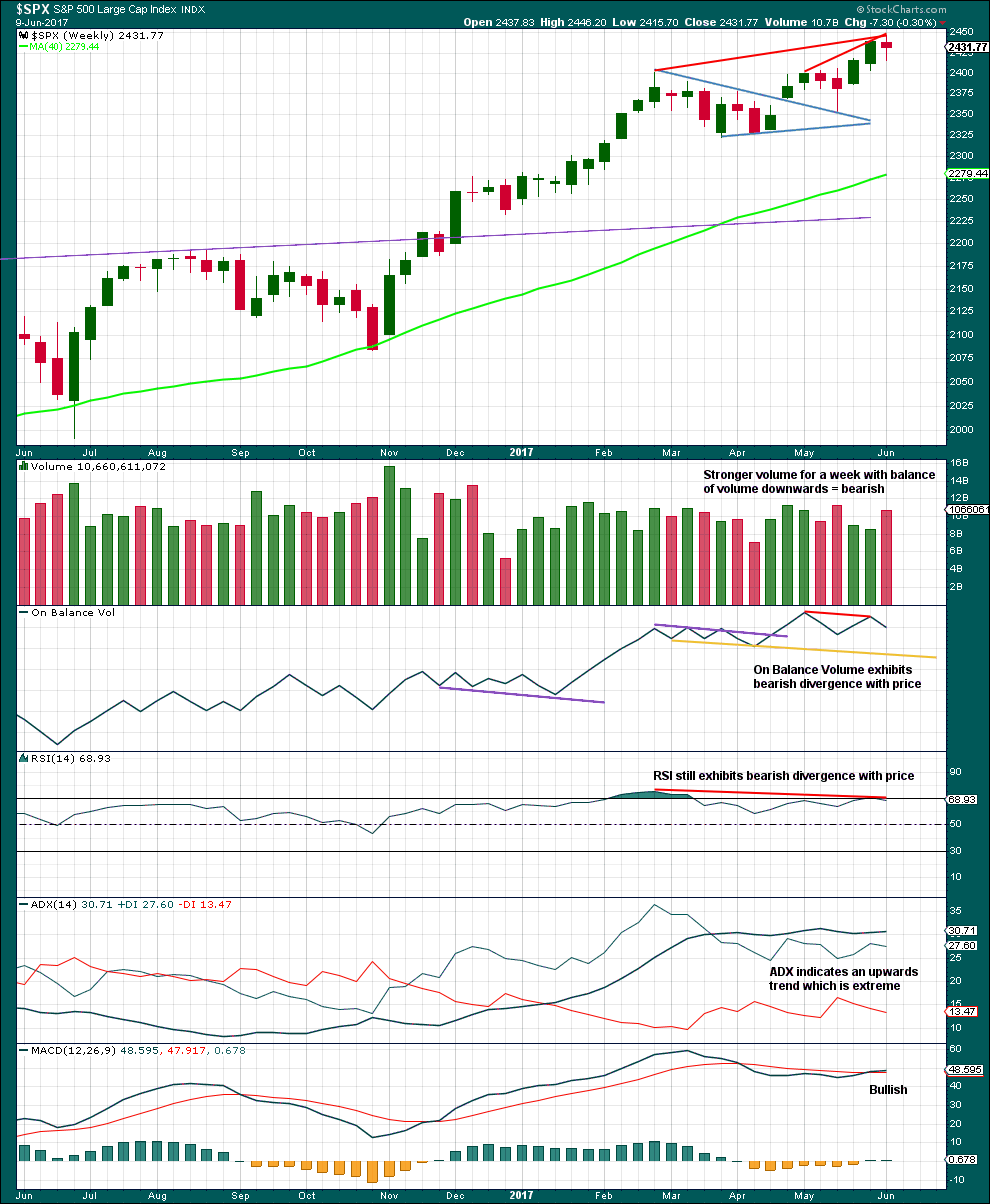
Click chart to enlarge. Chart courtesy of StockCharts.com.
The short term volume profile is bearish.
On Balance Volume gives its last signal as bearish divergence with price.
Divergence with price and RSI is bearish. ADX at extreme is bearish.
Only MACD is bullish.
Look out for a pullback, either here or very soon, within the larger upwards trend to resolve extreme ADX.
DAILY CHART
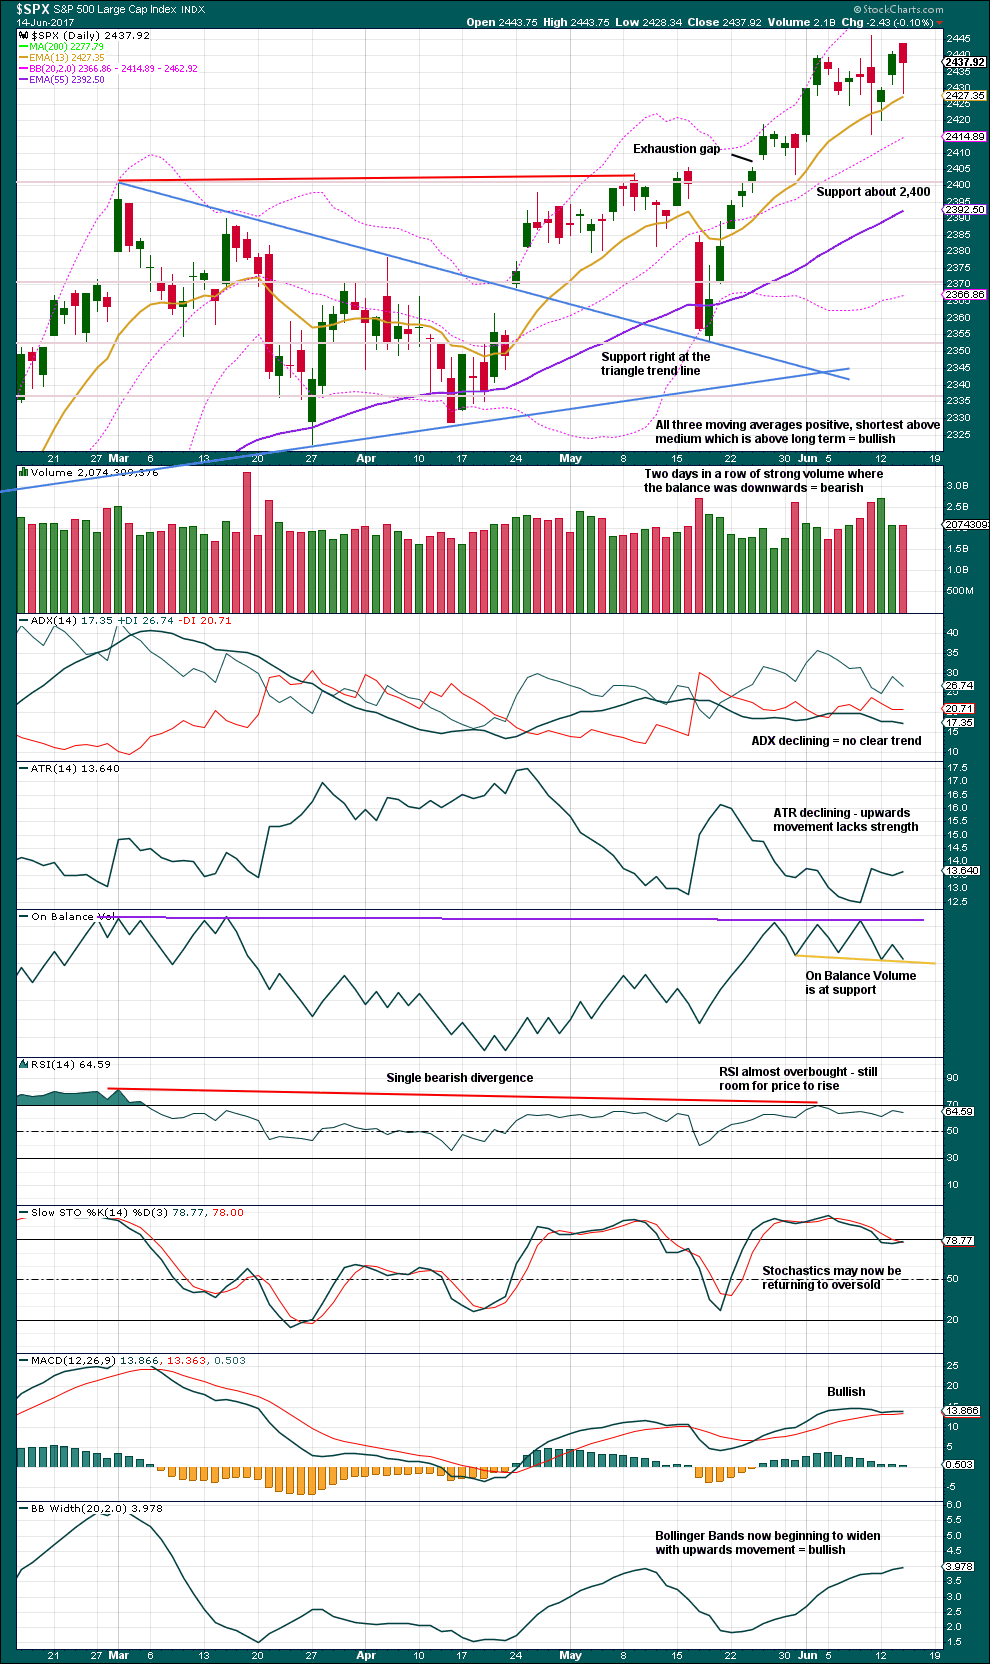
Click chart to enlarge. Chart courtesy of StockCharts.com.
The pattern gap is now closed. Price is consolidating with resistance about 2,445 and support about 2,415. The last two days show some decline in volume.
A breach of the yellow support line now on On Balance Volume would be a weak bearish signal.
This chart is very mixed. Give weight to the signal of an extreme trend from ADX at the weekly chart level and expect this consolidation to continue this week and next to resolve it. When the consolidation is mature, expect an upwards breakout.
VOLATILITY – INVERTED VIX CHART
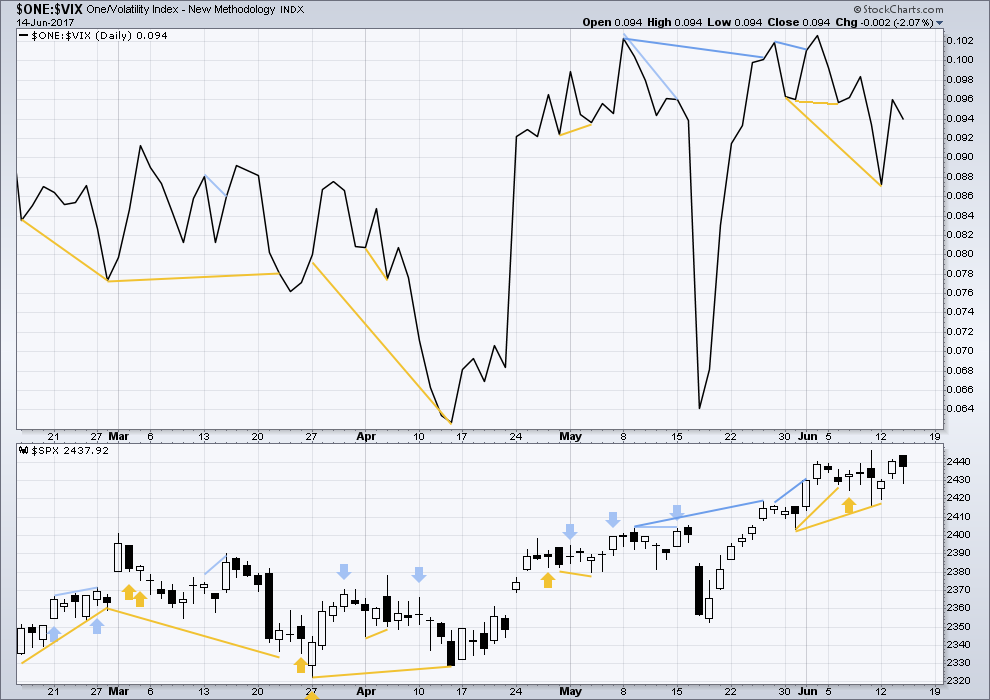
Click chart to enlarge. Chart courtesy of StockCharts.com.
Normally, volatility should decline as price moves higher and increase as price moves lower. This means that normally inverted VIX should move in the same direction as price.
Short term bullish divergence may now be resolved. There is no new divergence today between price and VIX.
BREADTH – AD LINE
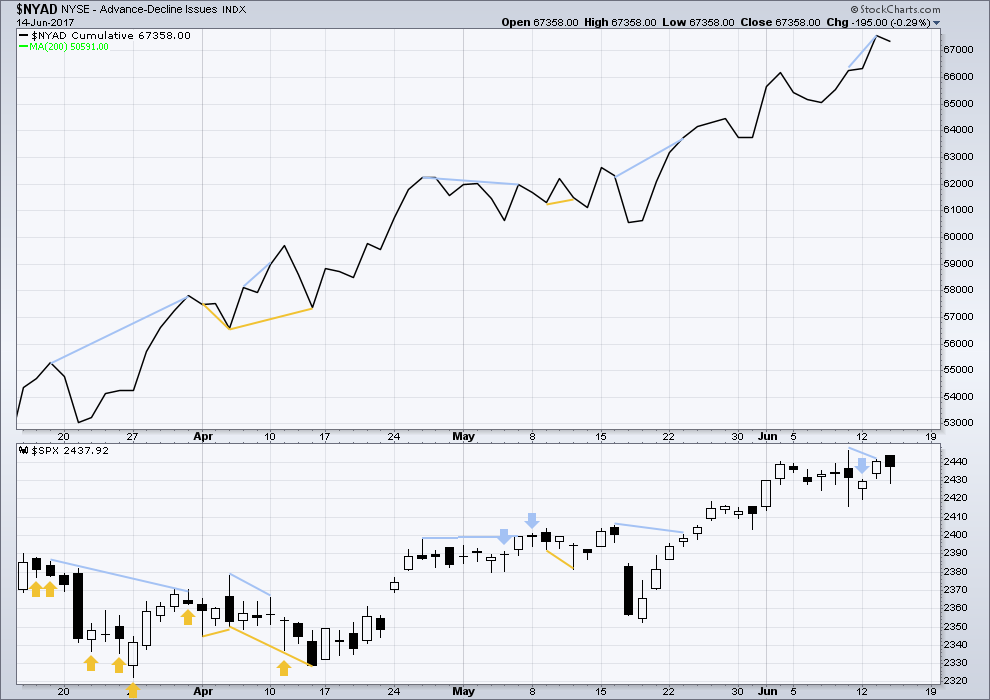
Click chart to enlarge. Chart courtesy of StockCharts.com.
With the last all time high for price, the AD line also made a new all time high. Up to the last high for price there was support from rising market breadth.
There is normally 4-6 months divergence between price and market breadth prior to a full fledged bear market. With no divergence yet at this point, any decline in price should be expected to be a pullback within an ongoing bull market and not necessarily the start of a bear market.
Bearish divergence noted in yesterday’s analysis may now be resolved by a red daily candlestick, or it may need another downwards day to resolve it.
At the end of last week, it is noted that the mid caps and small caps have now made new all time highs. The rise in price is seen across the range of the market, so it has internal strength.
DOW THEORY
At the end of last week, DJIA, Nasdaq and the S&P500 have all made new all time highs. DJT has failed to confirm an ongoing bull market because it has not yet made new a all time high. However, at this stage that only indicates some potential weakness within the ongoing bull market and absolutely does not mean that DJT may not yet make new all time highs, and it does not mean a bear market is imminent.
The following lows need to be exceeded for Dow Theory to confirm the end of the bull market and a change to a bear market:
DJIA: 17,883.56.
DJT: 7,029.41.
S&P500: 2,083.79.
Nasdaq: 5,034.41.
Charts showing each prior major swing low used for Dow Theory are here.
This analysis is published @ 10:22 p.m. EST.

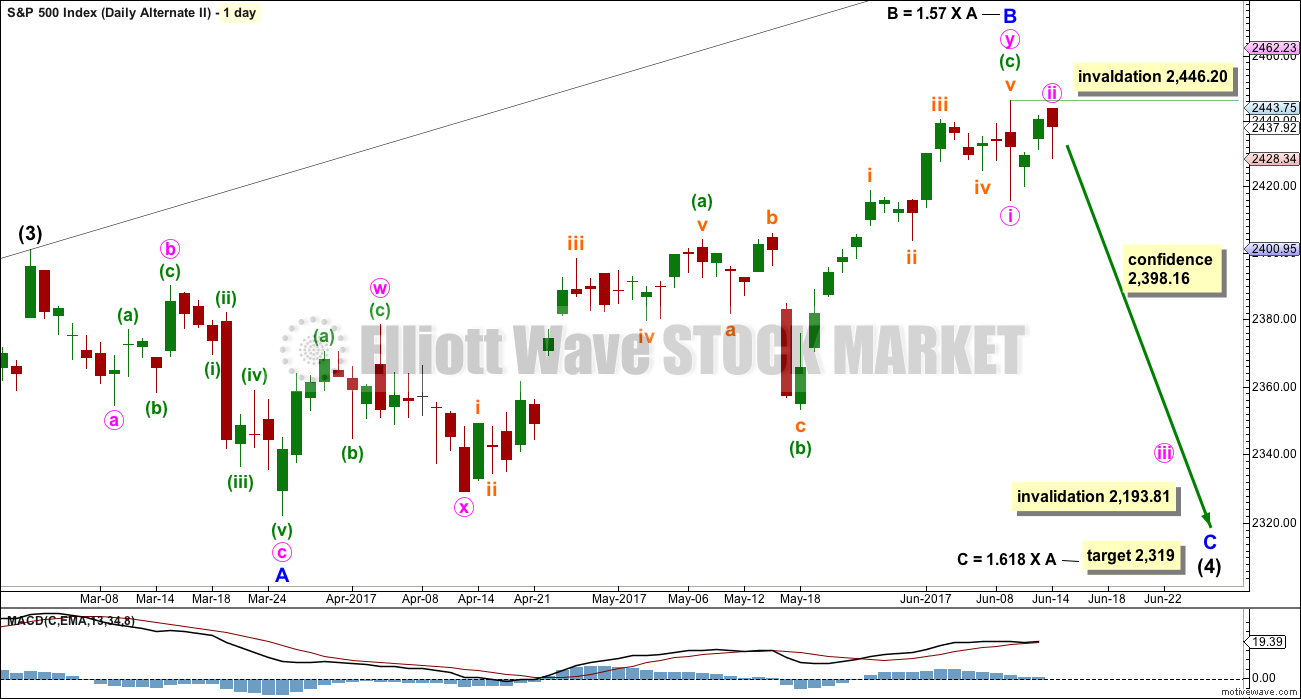
My target is now too low. I’m updating it to the round number pivot at 2,400, just above invalidation. That would see minor C fairly close to 1.618 X minor A, but not perfect. That target would be just below invalidation.
Now, there certainly could be something else happening here. Minor B could be a triangle to continue sideways for another week or so. It doesn’t have to be labelled over as in this chart. It may also be a regular flat to move sideways and a little higher.
Overall intermediate (4) (which may also be primary 4) is not over. The consolidation isn’t done yet, the breakout is still at least a week away I expect.
I am assuming the target would be too low only in the event that we were actually looking at intermediate four, and not primary four….
Well yes, exactly 🙂
I’m going to sit on the fence and not prefer either degree. Let price tell us which one it is.
These gaps downs represent stealthy back door exits from this market and then the banksters provide cover by buying back the decline all day. It stinks to high heaven and I am headed for the sidelines by the close today to wait and see how this turns out. I think we are going to get another sharp move up as the current downward price action looking mostly corrective. NDX having trouble filling this morning’s gap and could provide a clue as to what comes next.
You know, it’s occurred to me that the banksters behaviour is becoming reasonably predictable. So we may be able to profit from it.
If after hours price goes down, then we can expect it’s fairly likely they’ll pump $$ in at the open to push prices up.
I guess I’m just late to the party here…. I assume this is what you’ve been doing all the while Verne.
Yep! I have learned the hard way to take profits quickly on any moves down as they can be relied on to bid things right back up; rinse and repeat. So true about them being quite predictable! 🙂
As you know in my short term (trading) account, I am on the sidelines. All other accounts will make the same move with the next move up. I remember well what trading was like from Dec 2014 to August 2015. It was a sideways grind with may whipsaws for traders. I am guessing the topping process is essentially beginning now and will take some time to roll over similar to 2015.
During that time, I am going to rest my mind from the market and trading. I’ll have all investment portfolios in cash. Then I can head to the mountains for long periods with no worries which is exactly what I need to gain full renewal and refreshment. I really need it.
Every wise decision. Not worth it having to worry about open positions while you are trying to enjoy some time away.
Looks like they are fighting to hold onto 2420. It would be bullish if they manage to defend it.
Break of 2420 suggests we may ineed break 2400.00. If we do, we could go much lower…
The biggest caveat to the bullish argument remains the absolute absence of fear in this market. Traders apparenly shrugged off that scary candle printed by Nasdaq last Friday and that is not good. VIX readings, even though I know it is being massively shorted, suggests nobody has been buying downside insurance.
At this point there is too much danger to the downside for my comfort level. I am exiting my short term long positions. This will complete my seventh trade of the year. I will be 5 wins, 1 loss (today & small loss), and 1 tie (breakeven). I will most likely also close out my mid term and long term long positions as well in preparation for my summer break and the topping out process of the markets.
SPX daily MACD has a bearish crossover. Weekly is in process of a bearish crossover. 2398 SPX is in danger of falling meaning the Lara’s alternate would become the main count which has a 2319 target, over 100 points down from today.
I am actually starting to have a bit more confidence in the main count. The market remains resilient in the face of a vicious Nasdaq selloff and if we stay above 2400 today, I think it bolsters the case for an intermediate four as that keeps us inside the Elliott channel. Big Bradley turn date June 20 so we could see a sharp, short fifth wave up. The big question is if it ends P3 or P5.
I plan to exit short positions if we see an upside reversal today.
Well Joseph, it would seem as if the FED has decided it is time to end the party. Not only are they hiking rates in a no growth, no jobs creation economy, they will be unwinding their balance sheet to the tune of 50 billion per month. Guess who will be blamed for the inevitable consequences oh their actions? Call me a conspiracy theorist but nobody is that cluelesss, not even yammerin’ Yellen. 😉
They’ll blame the same guy who has proudly taken credit for this rally. When the storm hits, he’ll own it to his everlasting shame.
Yep! He is being ambushed by the FED. He took credit for the rally, they will saddle him with culpability for the rout.
The Fed no longer has a political reason to NOT raise rates or to increase or maintain the size of the Balance Sheet. What the Fed is doing now should have been done in 2014. They now making up for that long delay.
It’s now a 100% certainty that the Yield curve will continue to Flatten… I think will actually become Flat in the next 12-18 months! I don’t believe it will inverse unless they go to 0.50 increases. However, they might because as I said… Fed no longer has political concerns.
You actually think it is going to take that long? After all, if they truly start unwinding the balance sheet that is an addtional form of tightening in addition to hiking rates. Amazing that they have also penciled in another hike in December.
Well they announced the balance sheet plan and Treasury Yields declined sharply.
If the market was concerned about the balance sheet unwind… Yields would have sharply increased.
So Flattening continues.
1 month to 2 year yields to rise … 3 Year & 4 Year stay about the same… 5 year to 30 Year to decrease.
You want speed? Fed will have to raise by 0.50! Each meeting that they plan to raise.
There is a thesis that says yields are not going rise because of inflation, but because of fear. Admittedly, it is for the time being completely absent from the marketplace. I think that spike in bonds was an exhaustion gap and we are headed down. The initial reaction indeed says the market disagrees with the FED that inflation is in any way an imminent problem, but inflation is not the only reason that causes yields to rise. I am short TLT. I think we just began a fifth wave down to around 100.00
Wow, futures almost rode this right to the hourly target. This market moving on gaps.
here again
Howdy Doc 🙂
I was here foist but I was hiding Doc…! He!He!