
A new all time high at the open gap up invalidated the alternate Elliott wave count providing confidence in the main Elliott wave count. The target remains the same.
Summary: The target is at 2,440 (Elliott wave target) in the first instance, and may be as high as 2,460 (classic technical analysis target). Expect upwards movement to continue. Corrections, if they appear on the daily chart, are an opportunity to add to long positions.
New updates to this analysis are in bold.
Last monthly and weekly charts are here. Last historic analysis video is here.
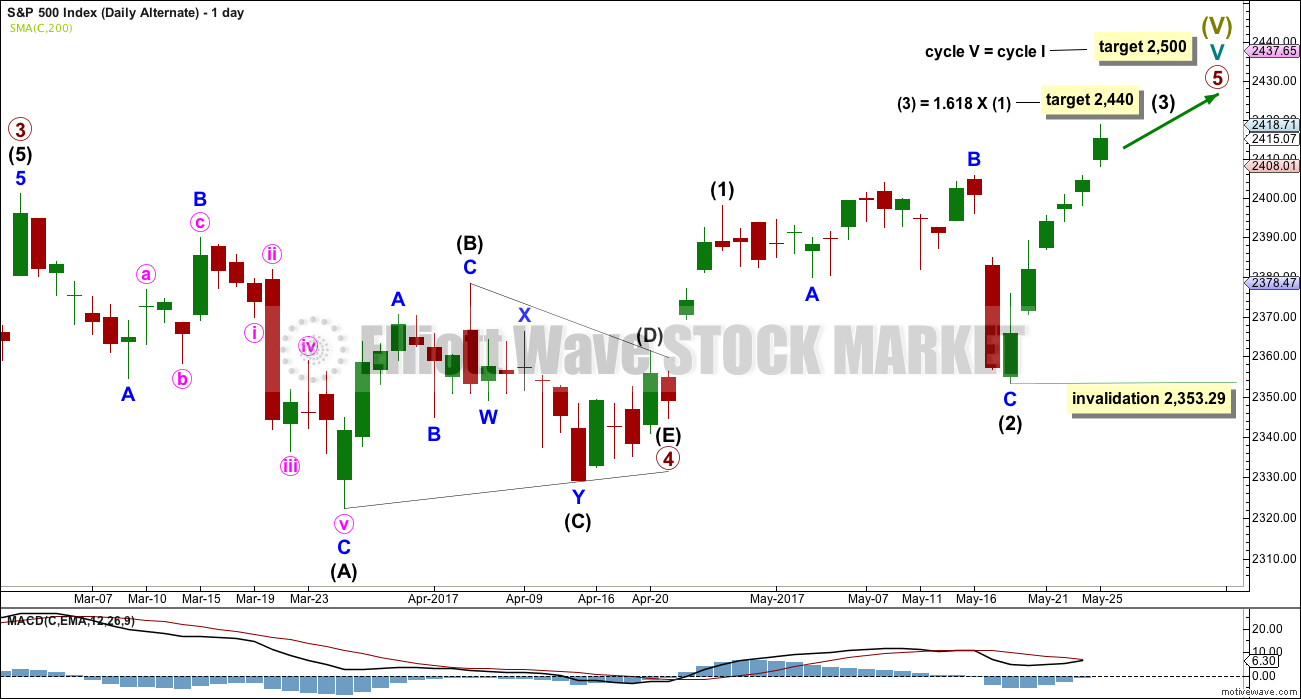
MAIN ELLIOTT WAVE COUNT
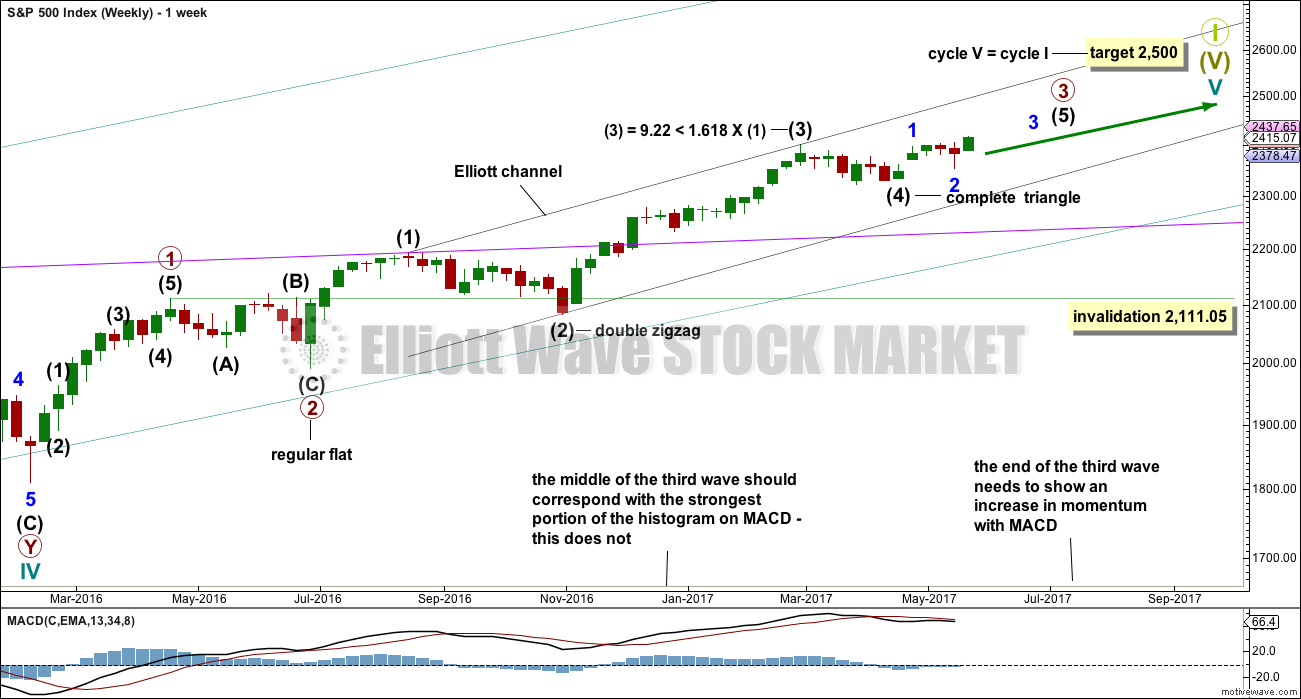
WEEKLY CHART
Click chart to enlarge.
This wave count sees the middle of primary wave 3 a stretched out extension, which is the most typical scenario for this market.
Primary wave 3 may be incomplete. A target is now calculated for it on the daily chart.
There is alternation within primary wave 3 impulse, between the double zigzag of intermediate wave (2) and the possible triangle or combination of intermediate wave (4).
When primary wave 3 is a complete impulse, then a large correction would be expected for primary wave 4. This may be shallow.
Thereafter, primary wave 5 may be expected to be relatively short, ending about the final target at 2,500.
MACD may be used to assist with a wave count, to find the end and middle of a third wave of an impulse. The end of the third wave most often corresponds with the strongest momentum from MACD, and the middle of that third wave most often corresponds with the strongest portion of the histogram on MACD. This main wave count does not have as good a fit with MACD as the alternate published below.
However, when looking at the structure on a monthly time frame, intermediate waves (2) and (4) both show up with red monthly candlesticks and this labelling on that time frame has a better look than the alternate.
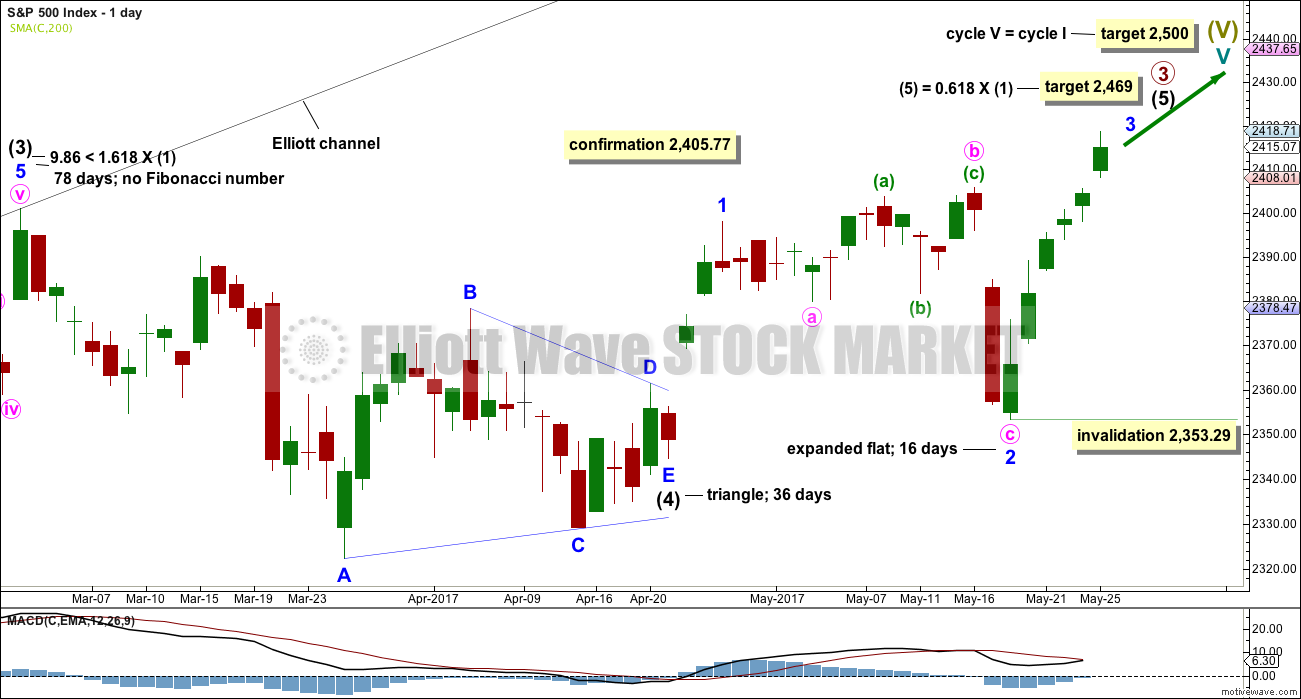
DAILY CHART
Click chart to enlarge.
Intermediate wave (4) may be a complete regular contracting triangle. It may have come to a surprisingly swift end with a very brief E wave.
There is already a Fibonacci ratio between intermediate waves (3) and (1). This makes it a little less likely that intermediate wave (5) will exhibit a Fibonacci ratio to either of intermediate waves (1) or (3); the S&P often exhibits a Fibonacci ratio between two of its three actionary waves but does not between all three.
Within intermediate wave (5), minor wave 1 is complete. Minor wave 2 should be complete.
Within minor wave 3, no second wave correction may move beyond the start of its first wave below 2,353.29.
The structure of intermediate wave (5) on the daily chart does not look complete. So far it looks like a possible three up. Minor wave 3 still needs to complete, then minor waves 4 and 5. This may last another few weeks.
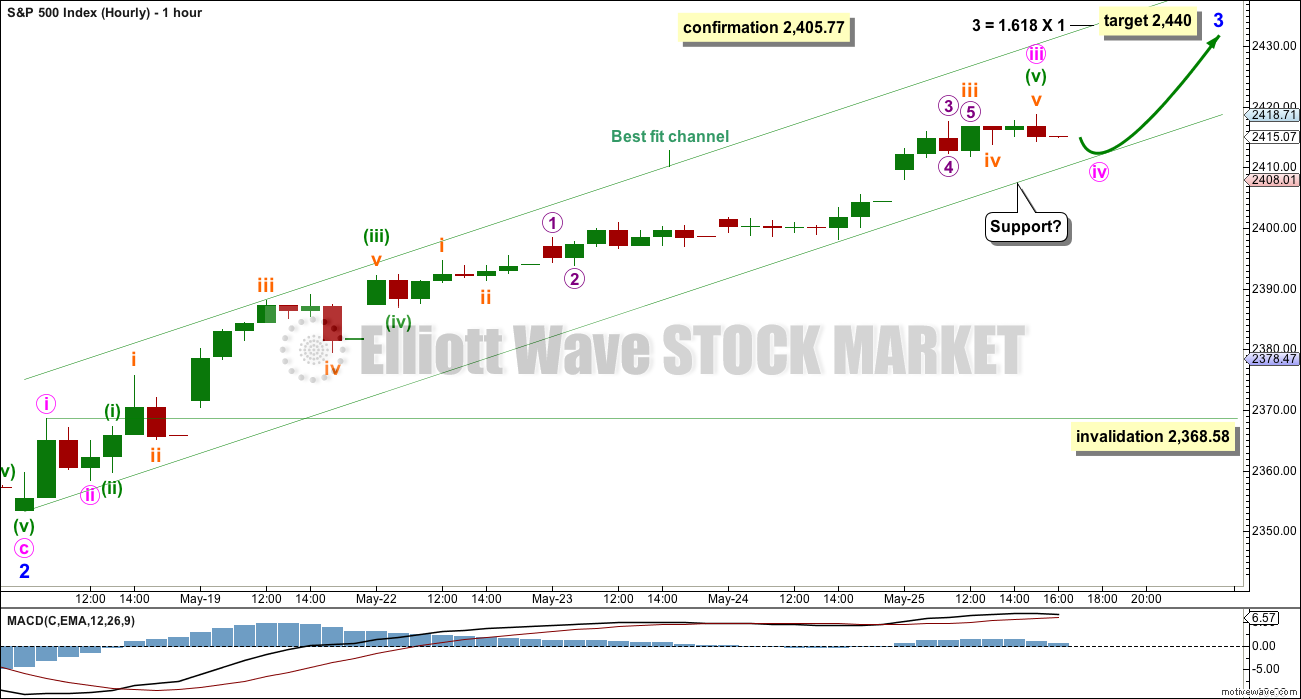
HOURLY CHART
Click chart to enlarge.
Minor wave 3 has now moved beyond the end of minor wave 1, meeting a core Elliott wave rule.
At this stage, it looks increasingly like minor wave 3 may be a quick upwards movement with brief shallow corrections along the way.
There are multiple ways now to label this upwards movement. This labelling is chosen because it fits with MACD: the strongest momentum so far is today’s high, and this may be minute wave iii over here or very soon.
Within minute wave iii, the strongest portion of the histogram is labelled as the middle of minuette wave iii.
Minute wave iii would reach 4.236 the length of minute wave i if it continued a little higher tomorrow to end about 2,415 *edit: 2,423.
Ratios within minute wave iii are: there is no Fibonacci ratio between minuette waves (i) and (iii), and minuette wave (v) is now just 0.76 short of equality in length with minuette wave (iii).
If this labelling is correct, then the invalidation point is at 2,368.58. Minute wave iv may not move into minute wave i price territory.
Minute wave iv should be expected to be a very shallow correction, and may remain contained within the best fit channel.
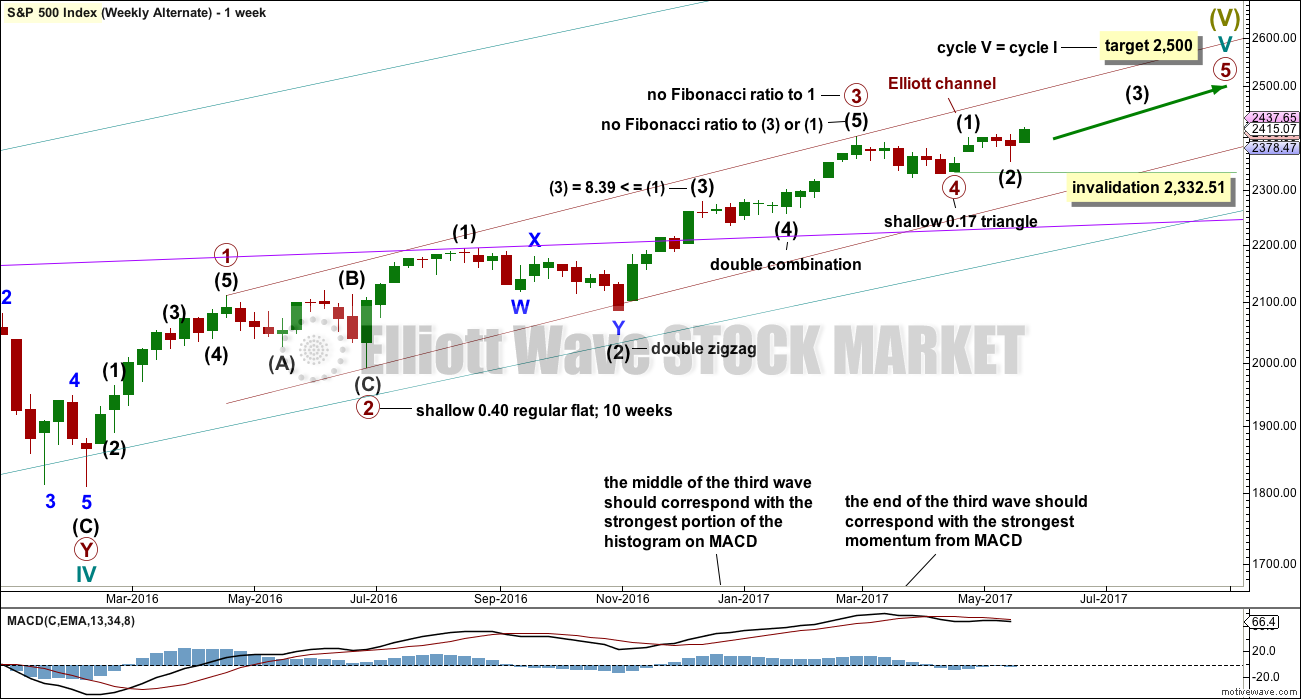
ALTERNATE WEEKLY CHART
Click chart to enlarge.
This alternate has been published before. It does not diverge at this stage in terms of expected direction or targets to the main wave count, but it will diverge in the future.
Within cycle wave V, this labelling fits better with MACD.
It is possible that the final wave of primary wave 5 is now underway to complete cycle wave V, Super Cycle wave (V), and Grand Super Cycle wave I.
Within primary wave 5, if intermediate wave (2) continues further sideways as a more time consuming correction such as a double combination, then it may not move beyond the start of intermediate wave (1) below 2,332.51.
ALTERNATE DAILY CHART
Click chart to enlarge.
Structure at the daily chart level is exactly the same at this stage for both wave counts. The next target at 2,440 is also exactly the same.
As of tomorrow only the weekly chart will be published for this alternate.
TECHNICAL ANALYSIS
WEEKLY CHART
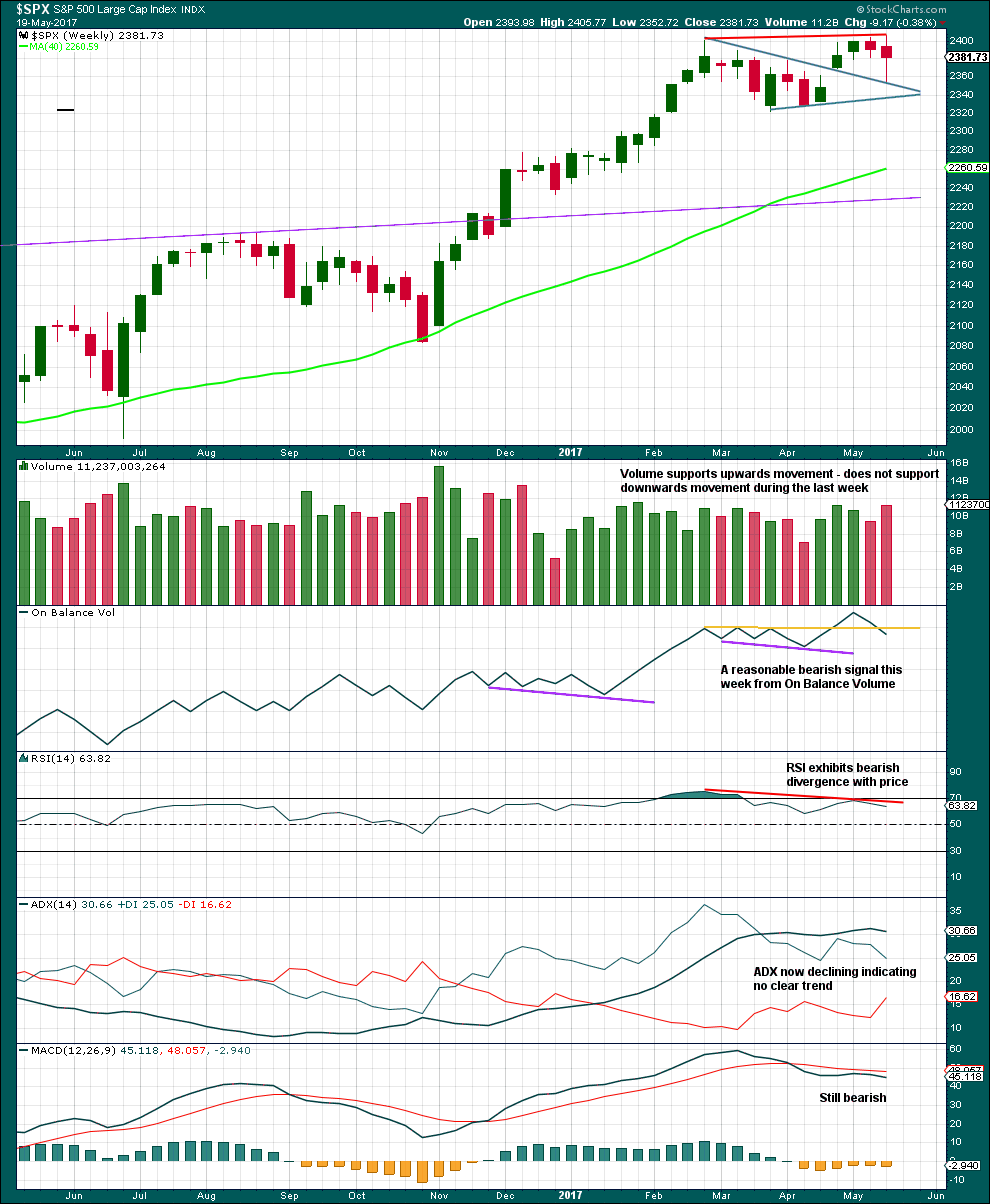
Click chart to enlarge. Chart courtesy of StockCharts.com.
Last weekly candlestick is an outside week with the balance of volume downwards. Volume shows an increase, so there was support for the fall in price during the week.
The long lower wick on the last weekly candlestick is bullish. Support right at the upper edge of the triangle trend line is bullish. This looks like a typical breakout from the large symmetrical triangle followed by a curve back to test support at prior resistance.
So far this all supports the main wave count more than the alternate.
However, On Balance Volume gives a reasonable bearish signal last week supporting the alternate wave count. Long standing members are aware that I give a lot of weight to On Balance Volume with trend lines because it works very well. For this reason I would judge the alternate wave count to have a fairly reasonable probability.
Divergence with the new all time highs last week from price and RSI is also fairly bearish. This supports the alternate wave count.
DAILY CHART
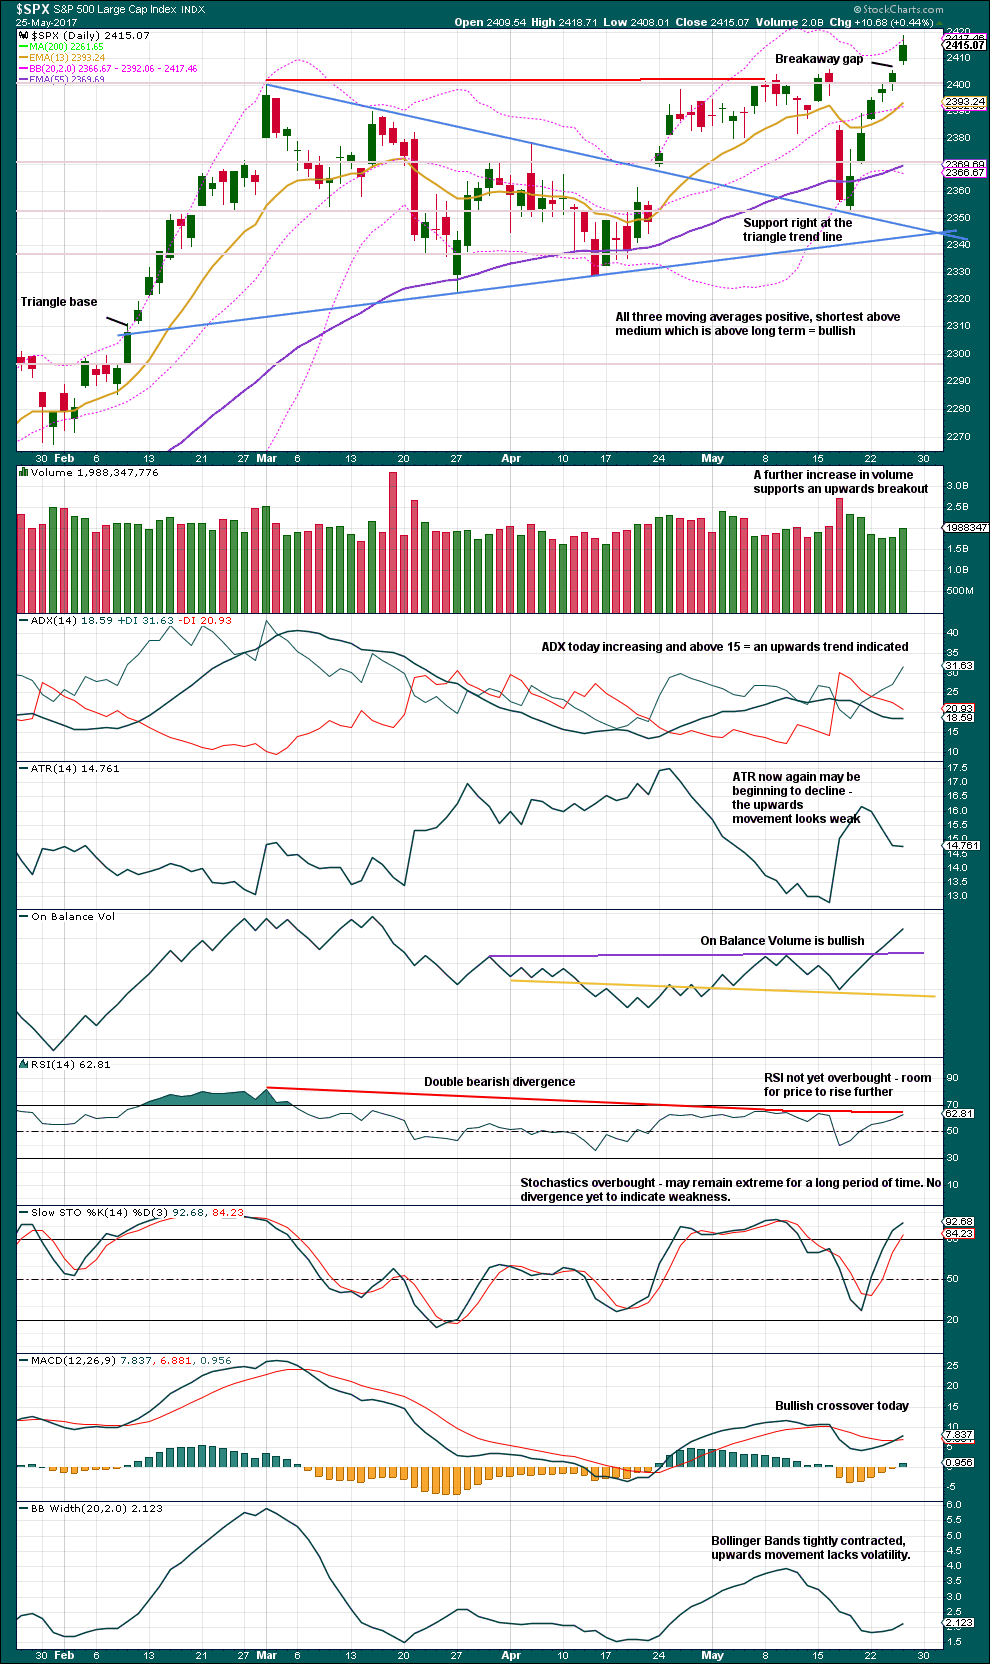
Click chart to enlarge. Chart courtesy of StockCharts.com.
Price has broken above prior resistance about 2,405 on an upwards day with an increase in volume and a gap. This looks like an upwards breakout with a break away gap. If the prior consolidation is taken to be at its widest of about 55 points, then a target following the break out may be about 2,460.
Price may continue to sit about the upper edge of Bollinger Bands for several days in a row.
Volume, On Balance Volume, ADX, and MACD are all today bullish. Some widening of Bollinger Bands may be beginning again, and this is also slightly bullish.
Divergence between price and RSI can persist for reasonable periods of time and may develop further. It indicates weakness in upwards movement, but it cannot pin point a trend change.
ATR also indicates weakness.
VOLATILITY – INVERTED VIX CHART
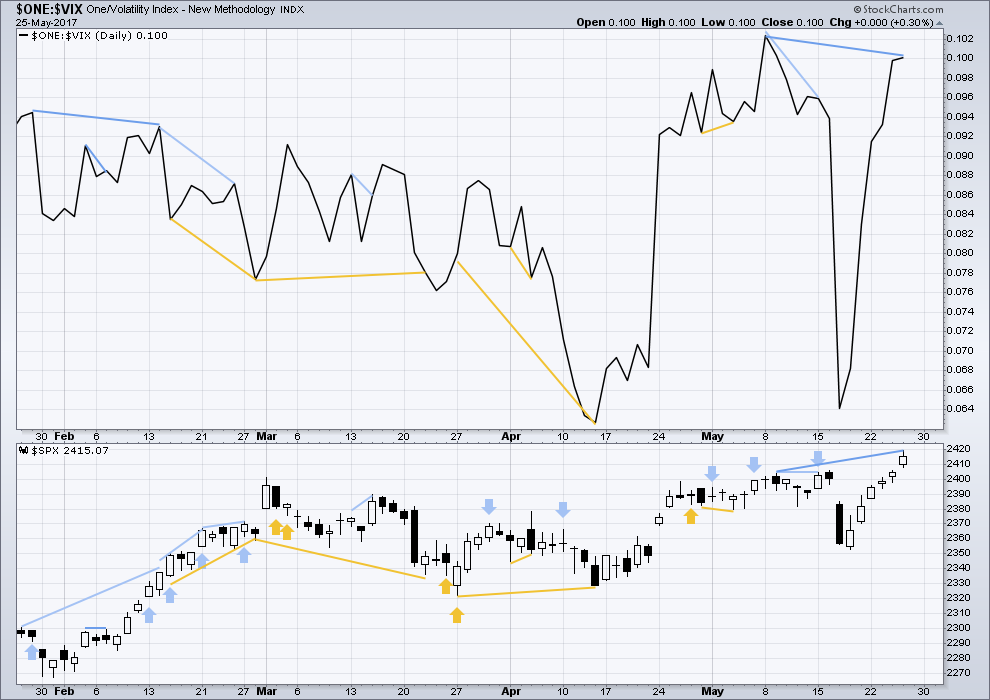
Click chart to enlarge. Chart courtesy of StockCharts.com.
Normally, volatility should decline as price moves higher and increase as price moves lower. This means that normally inverted VIX should move in the same direction as price.
There is hidden mid term bearish divergence between price and VIX today.
BREADTH – AD LINE
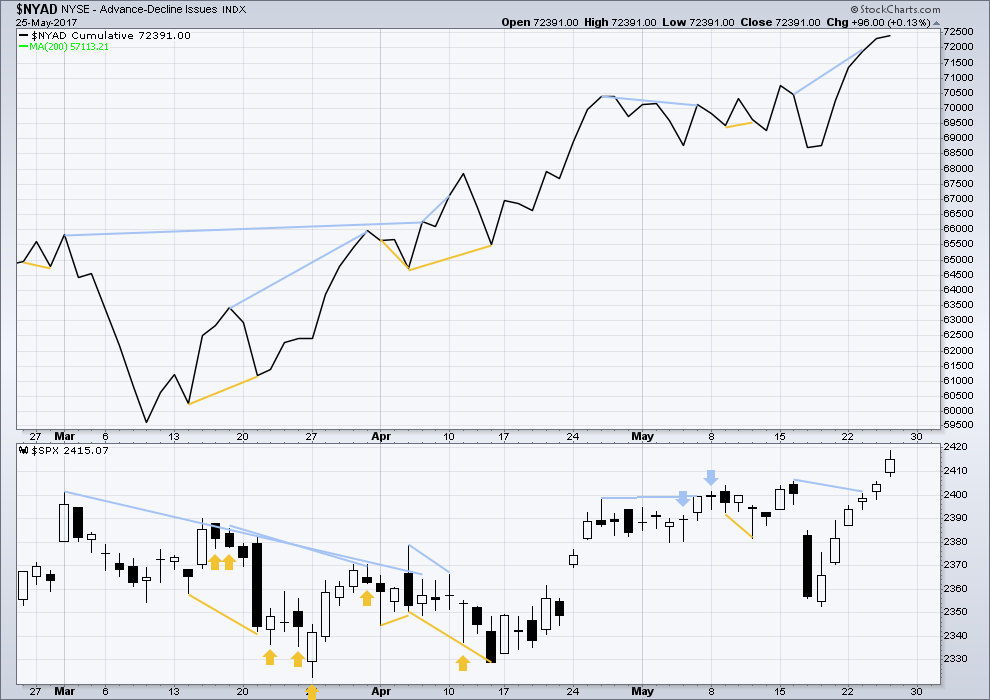
Click chart to enlarge. Chart courtesy of StockCharts.com.
With the last all time high for price, the AD line also made a new all time high. Up to the last high for price there was support from rising market breadth.
There is normally 4-6 months divergence between price and market breadth prior to a full fledged bear market. With no divergence yet at this point, any decline in price should be expected to be a pullback within an ongoing bull market and not necessarily the start of a bear market.
Bearish divergence noted up to yesterday has now disappeared. It is considered to have failed to predict price movement.
There is no divergence between price and breadth today; both are making new all time highs. Upwards movement in price has support from rising market breadth.
DOW THEORY
The DJIA, DJT, S&P500 and Nasdaq continue to make new all time highs. This confirms a bull market continues.
The following lows need to be exceeded for Dow Theory to confirm the end of the bull market and a change to a bear market:
DJIA: 17,883.56.
DJT: 7,029.41.
S&P500: 2,083.79.
Nasdaq: 5,034.41.
Charts showing each prior major swing low used for Dow Theory are here.
This analysis is published @ 11:33 p.m. EST.
Updated hourly chart:
I’ve slightly adjusted the best fit channel, I’ve added labels at the anchor points.
Today it looks like a small triangle may be completing. This would be a fourth wave, if indeed this is a triangle.
Target the same.
I was wondering when and where to join this uptrend. Since there was a GAP up on 5-25. And All gaps are usually filled sooner or later—does it make sense to wait for market to come down to this GAP and enter long or is this just wishful thinking?
If it’s a breakaway gap then it may not be filled for some time.
Not all gaps are filled, that’s a myth.
Pattern gaps are usually quickly filled. Break away gaps aren’t, nor are measuring gaps.
Exhaustion gaps are quickly filled.
Break away and measuring gaps can be used in a bull market as areas of support. Stops can be set just below the lower edge of the gap.
Friday’s sideways move looks like a good entry point, getting close to the lower edge of the channel. While price remains within the channel on the hourly chart expect it to keep going up.
If the gap is closed then it’s an exhaustion gap and the alternate may be correct. At that stage we’d want to exit long positions and consider short term shorts.
Always always use a stop. Do not invest more than 1-5% of your equity on this one trade.
Hi Lara,
Two questions:
1. You comment today “Minute wave iii would reach 4.236 the length of minute wave i if it continued a little higher tomorrow to end about 2,415”. But, SPX has touched 2,418 today, why Minute wave iii would end about 2,415? Is it typo? If yes, what is correct number?
2. Thank you for your comment of “MACD to assist with the third wave count”. How about MACD to assist with the first and fifth wave count?
Thank you very much David, yes, that’s a typo. My apologies.
Minute iii would reach 4.236 the length of minute wave i at 2,423.
Will fix.
Regarding MACD for first and fifth waves: most often MACD shows weaker momentum for both of these. Not always, just most often.
For indices especially, the fifth wave often exhibits multiple divergence with momentum.
Thank you, Lara, for your further comments.
One more question: the top on March 1 is either Intermediate Wave 3 (your main EW count) or Primary Wave 3 (your alternate). Is it possible that today’s top (or coming top in a few days) is Intermediate Wave 5 or Primary Wave 5? Because:
1. March 1 corresponds with the strongest momentum from MACD;
2. There is day (before March 1), which corresponds with the strongest portion of the histogram on MACD.
As per above 1 and 2, the top of March 1 is some kind of Wave 3 (Intermediate or Primary ).
3. After March 1, there are already multiple negative divergences with momentum of MACD. (one is between March 1 and March 15; Another one is between March 15 and March 24). This Wave 5 already lasts 6 weeks. So, it looks possible that we will complete this Wave 5 (either Intermediate or Primary) very soon, instead of long. My concern is whether or not this Wave 5 (either Intermediate or Primary) has to take much longer than 6 weeks?
Well, the main wave count does see it as a fifth wave following the fourth wave triangle. Both at intermediate degree.
The problem with the idea of trying to see it over very soon indeed, possibly yesterday, is that the structure is incomplete.
So far at the daily chart level it has only 1-2-3. It needs a correction for 4, then a final upwards thrust for 5.
A fifth wave must subdivide as a five wave motive structure; either an impulse or an ending diagonal. So far I can’t see either complete.
The problem with divergence is it illustrates weakness, but it’s not particularly useful in pin pointing when price will turn, particularly in a bull run. Divergence can persist for long periods of time and develop into multiple divergence before price turns.
I’ve learned that one the very hard way, I paid a lot of $$ for that lesson.
Great analysis Lara, I think there’s a high probability this a B wave, with the caveat that another thrust higher ought to reach up to 2460-2470 range, which I would then think is the final high. Biotech and financials still lagging badly, and the reflation trade is now negative on the year. I’m preparing to massively short the NASDAQ as well, but sitting on hands until I see an impulse down. Waves are flat here in FL, but I see you guys are getting tons swell.
Cheers!
Yes, I can see how that could fit the EW pattern. B could be a double zigzag.
This could be wave B within an expanded flat for intermediate (4), or more likely primary 4.
Crikey. So many possible alternates! How many to publish?
Yep! I think it is indeed an expanded flat for P4, with a vigorous C down yet to come. The end of that possible C wave is going to be the best trading set-up this year, as the final move is likely to be rocket ship.
My problem with the idea at this stage is that I keep publishing bearish alternates, and yet price keeps rising.
I am concerned that in publishing a bearish alternate it distracts us from the trend and members are more hesitant to enter long.
I appreciate that level of thoughtfulness and care for your members. Only here. Thank you Lara.
Lara: Thank you for your aforementioned advice on GAPS and your comment above !
#1 with a bullet!