
A red daily candlestick was expected for Tuesday’s session, buy this is not what happened. Price moved slightly higher to complete a small green candlestick.
Summary: Always assume the trend remains the same until proven otherwise. Assume the bull market remains intact and price may make new all time highs while price remains above 2,353.29. The target is at 2,469.
If price makes a new low below 2,353.29, then the outlook will change to an expectation of a primary degree correction to find support at the lilac trend line.
The short term will still again expect downwards movement tomorrow: volume is weaker still, there is a Stalled candlestick pattern, and bearish divergence between price and the AD line continues.
New updates to this analysis are in bold.
Last monthly and weekly charts are here. Last historic analysis video is here.
MAIN ELLIOTT WAVE COUNT
WEEKLY CHART
Click chart to enlarge.
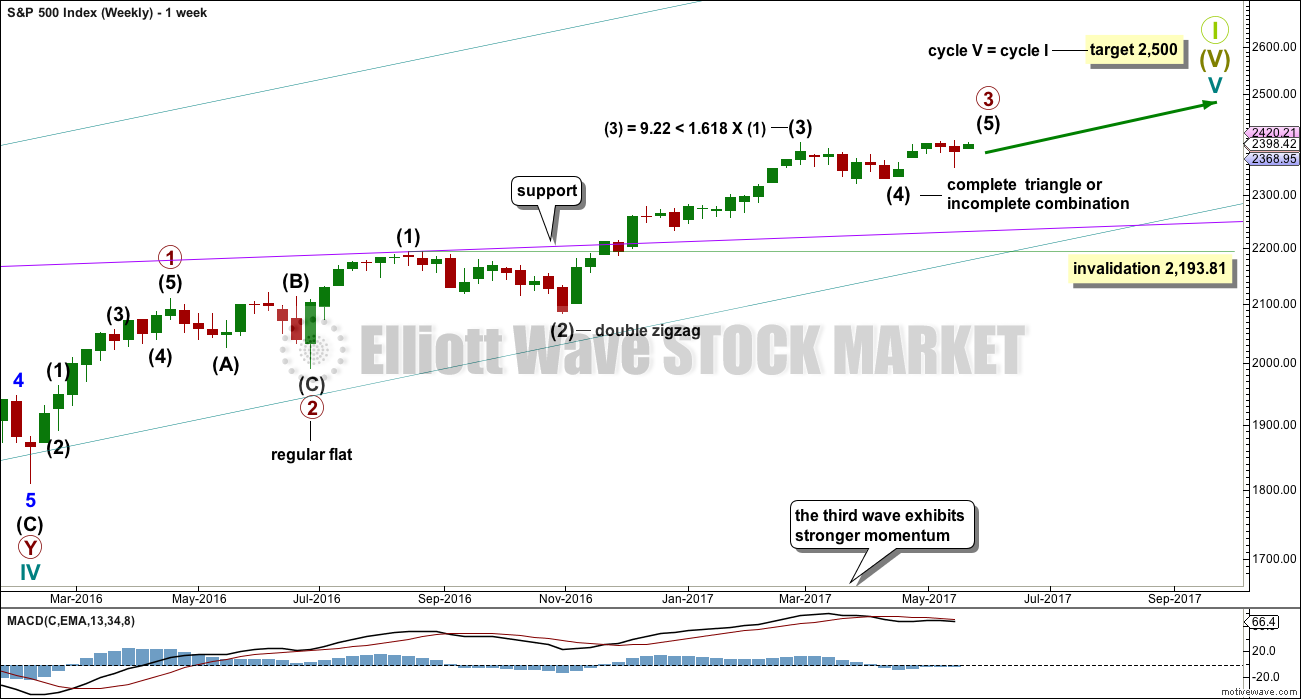
This wave count sees the middle of primary wave 3 a stretched out extension, which is the most typical scenario for this market.
Primary wave 3 may be incomplete. A target is now calculated for it on the daily chart.
There is alternation within primary wave 3 impulse, between the double zigzag of intermediate wave (2) and the possible triangle or combination of intermediate wave (4).
When primary wave 3 is a complete impulse, then a large correction would be expected for primary wave 4. This may be shallow.
Thereafter, primary wave 5 may be expected to be relatively short, ending about the final target at 2,500.
This main wave count and the alternate below are identical up to the end of intermediate wave (3) within primary wave 3.
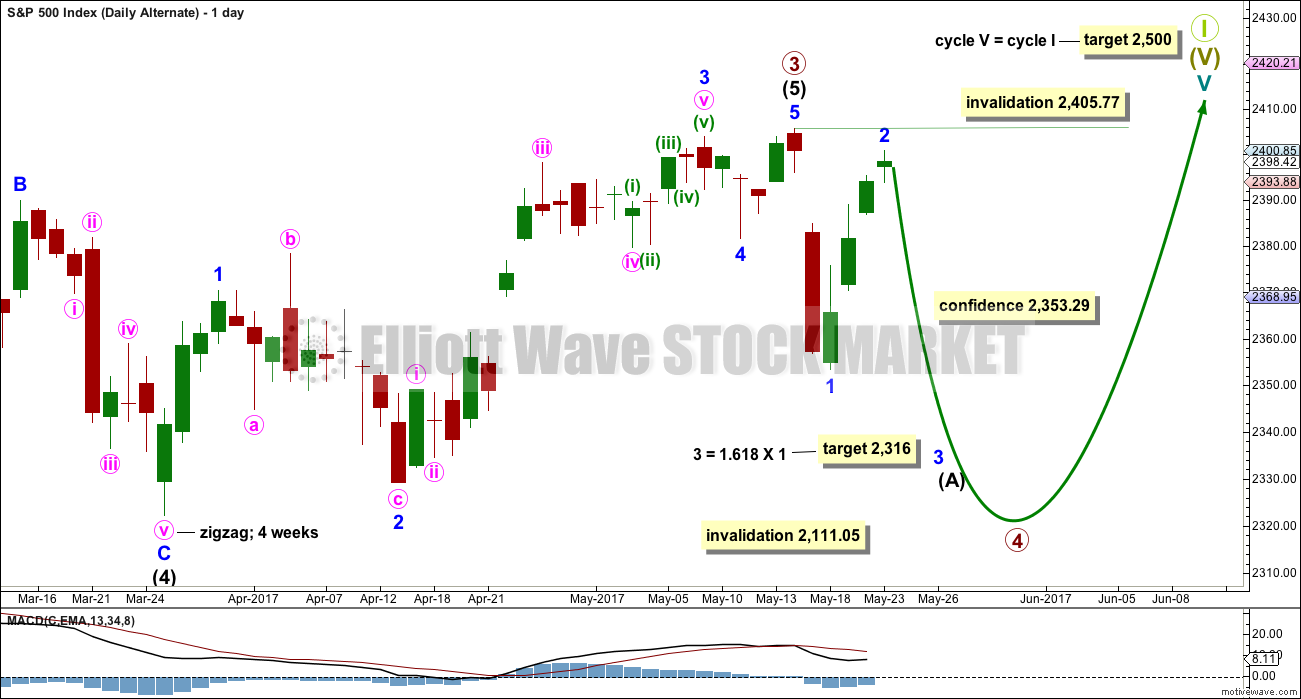
DAILY CHART
Click chart to enlarge.
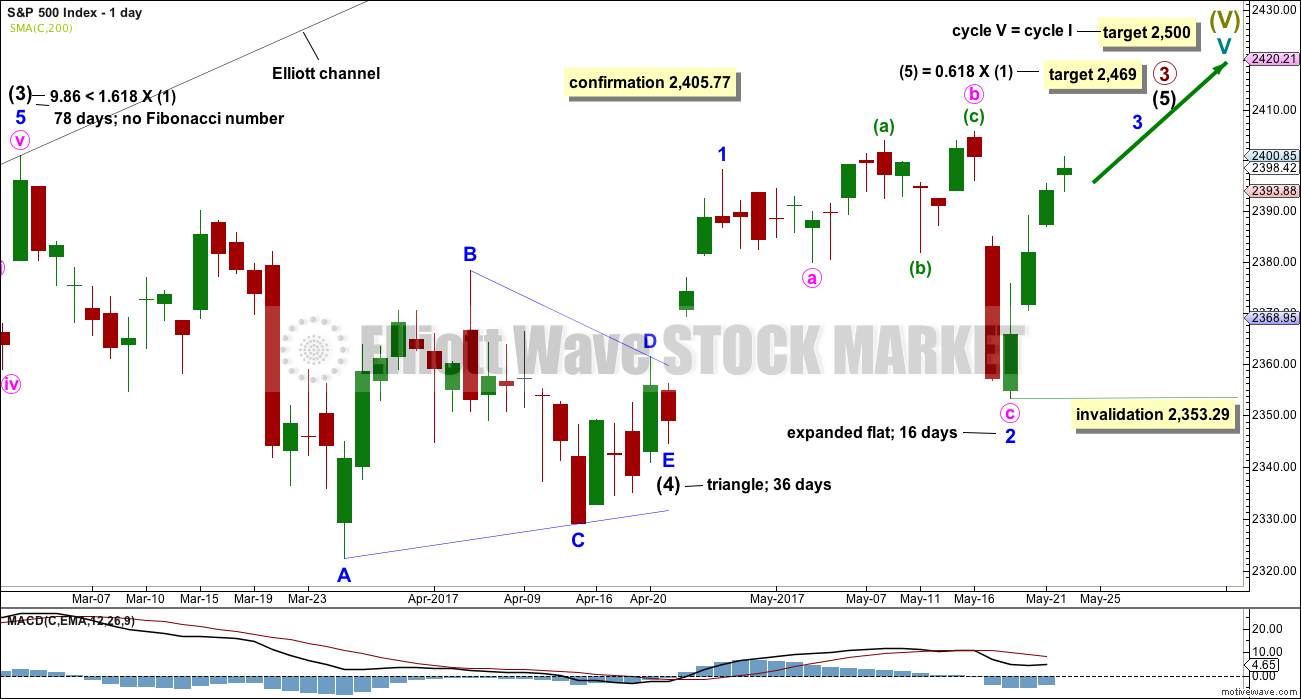
Intermediate wave (4) may be a complete regular contracting triangle. It may have come to a surprisingly swift end with a very brief E wave.
There is already a Fibonacci ratio between intermediate waves (3) and (1). This makes it a little less likely that intermediate wave (5) will exhibit a Fibonacci ratio to either of intermediate waves (1) or (3); the S&P often exhibits a Fibonacci ratio between two of its three actionary waves but does not between all three.
Within intermediate wave (5), minor wave 1 is complete. Minor wave 2 should be complete.
Within minor wave 3, no second wave correction may move beyond the start of its first wave below 2,353.29.
The structure of intermediate wave (5) on the daily chart does not look complete. So far it looks like a possible three up. Minor wave 3 still needs to complete, then minor waves 4 and 5. This may last another couple of weeks at least.
The alternate idea that intermediate wave (4) is still incomplete will not be published daily at this time to keep the number of charts manageable and this analysis as clear as possible. It does not diverge from the new alternate below in terms of expected direction or structure.
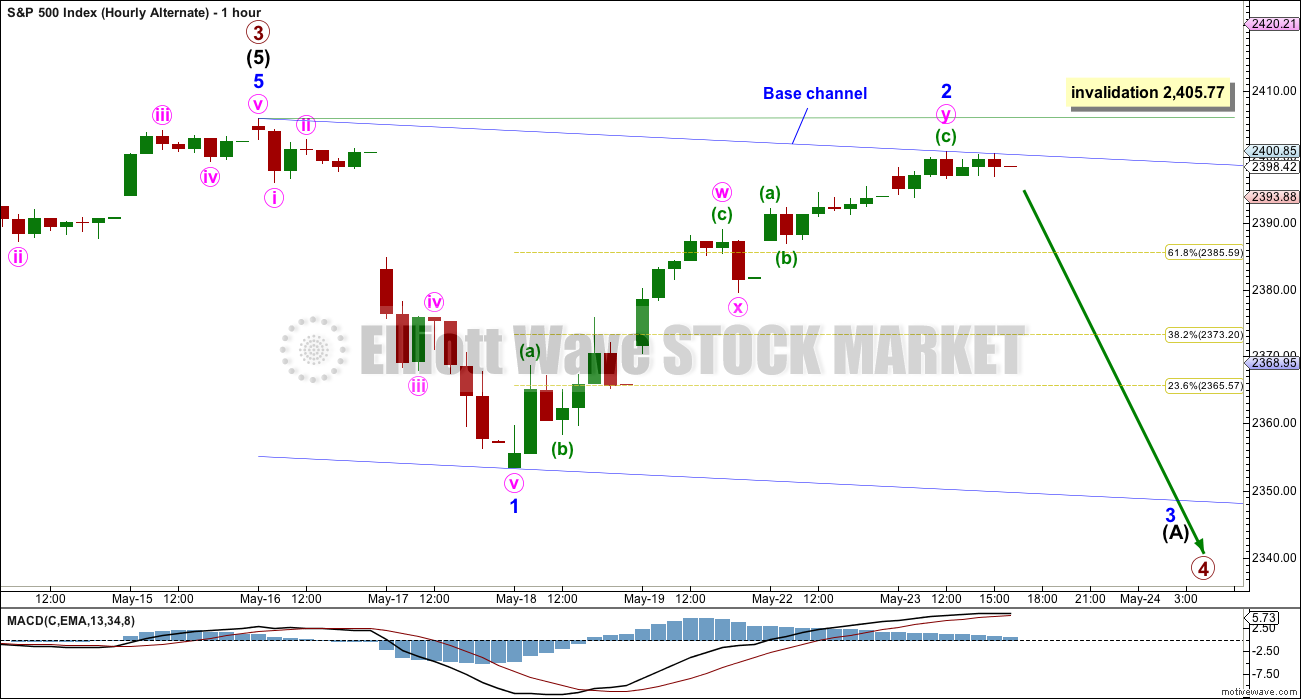
HOURLY CHART
Click chart to enlarge.
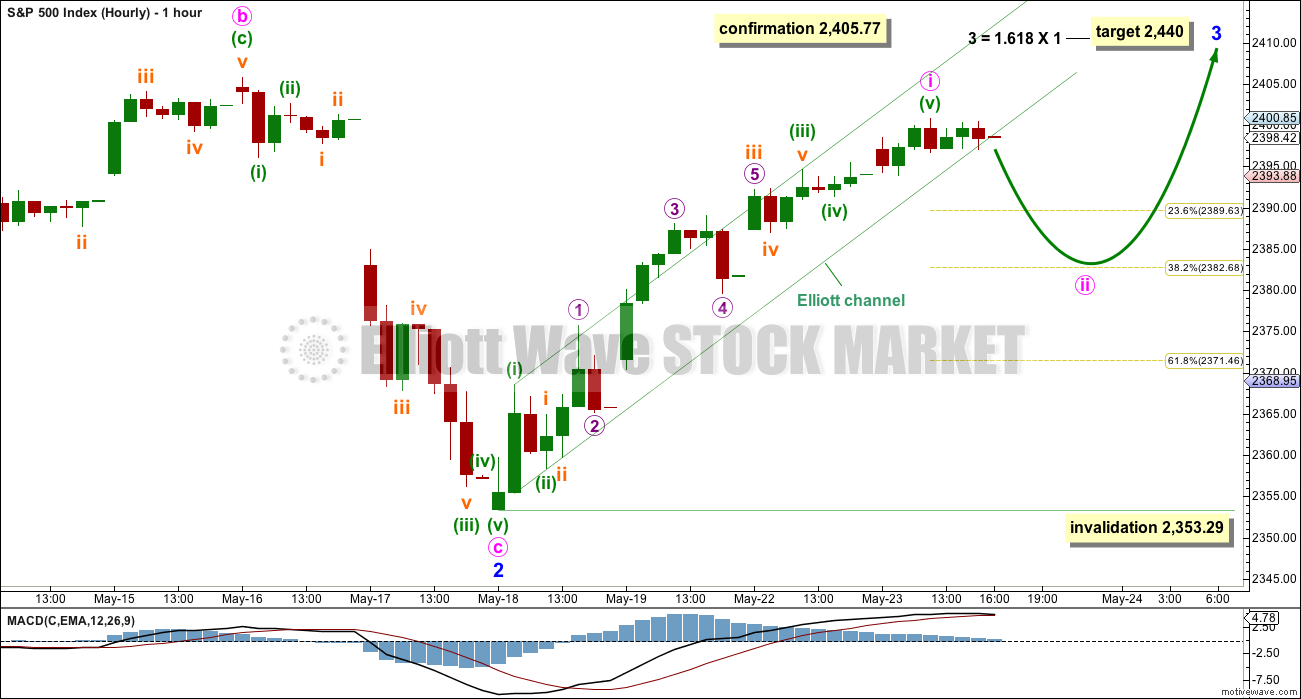
Minor wave 2 fits as a very common expanded flat. Within minor wave 2, minute wave b is a 1.41 length of minute wave a, only a little longer than the common range of up to 1.38.
Minute wave c is 4.28 points longer than 2.618 the length of minute wave a.
A new all time high would see the alternate below discarded and this main wave count confirmed.
Within minor wave 3, which may only subdivide as an impulse, the first wave up for minute wave i may again be complete. Use the 0.382 Fibonacci ratio as a target for minute wave ii; the first second wave correction within a new trend for the S&P has of late been relatively shallow.
When price breaks below the lower edge of the Elliott channel, that may provide some confidence that minute wave ii has begun. It looks like at the end of Tuesday’s session price may be beginning to break below the lower edge of this channel.
Minute wave ii may not move beyond the start of minute wave i below 2,353.29.
ALTERNATE WEEKLY CHART
Click chart to enlarge.
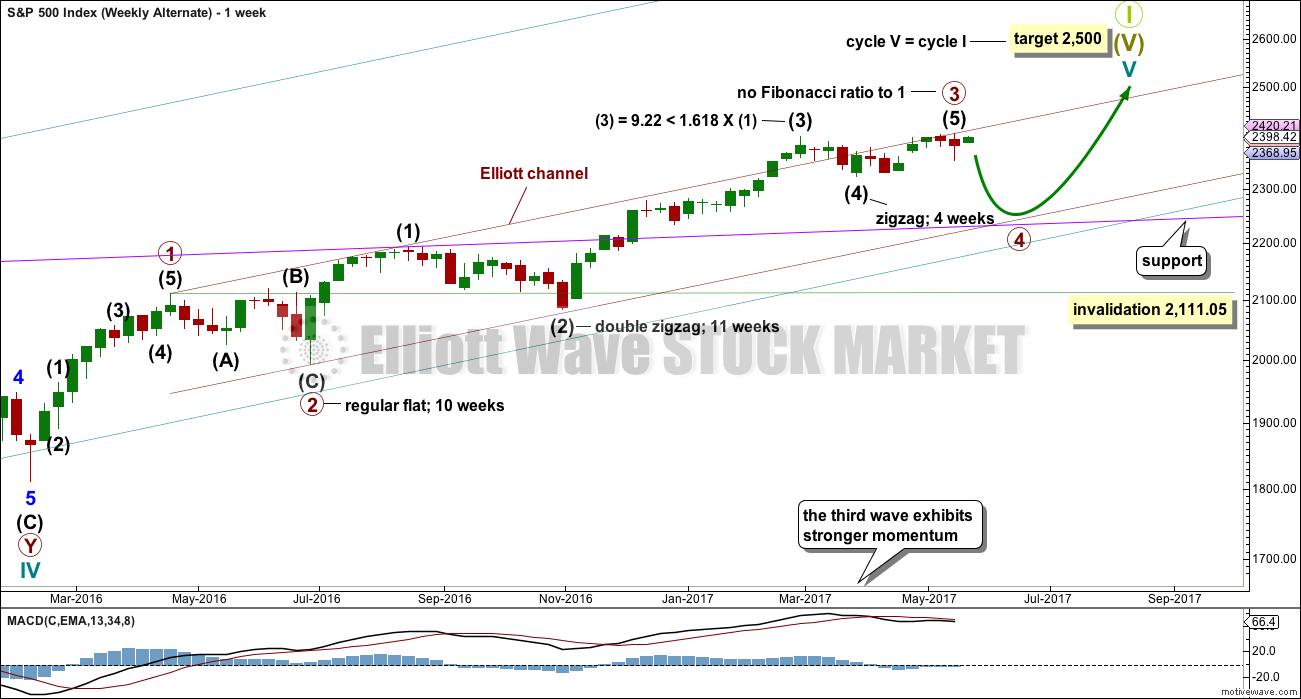
What if the last all time high just ended primary wave 3? What if primary wave 4 began with the strong drop? At the weekly chart level, this labelling has a good look that will also fit on the daily chart.
This only works if intermediate wave (4) was over as a relatively quick single zigzag. This does not offer good alternation nor good proportion with the double zigzag of intermediate wave (2). However, this wave count is still considered because the S&P just does not always exhibit nice proportions nor does it always exhibit good alternation.
Primary wave 2 was a regular flat correction lasting 10 weeks. Given the guideline of alternation, primary wave 4 should be expected to most likely be a single or multiple zigzag and so more brief than 10 weeks. It may find support at the lilac trend line. This trend line is drawn from the high of the 20th of May, 2015, to the high of the 23rd of August, 2016.
An Elliott channel is added to cycle wave V. The lower edge may provide support for primary wave 4.
Primary wave 4 may not move into primary wave 1 price territory below 2,111.05.
Primary wave 3 does not exhibit a Fibonacci ratio to primary wave 1. When primary wave 4 completes and primary wave 5 begins, then it would be most likely to exhibit a Fibonacci ratio to either of primary waves 3 or 1, with equality in length with primary wave 1 the most likely.
ALTERNATE DAILY CHART
Click chart to enlarge.
A movement at primary wave degree should begin with a clear five down on the daily chart. This would still be incomplete; only minor wave 1 would be complete and minor wave 2 may be complete. If minor wave 2 moves higher, it may not move beyond the start of minor wave 1 above 2,405.77.
A new low below 2,353.29 would now see the main wave count discarded in favour of this alternate.
ALTERNATE HOURLY CHART
Click chart to enlarge.
A five down is complete for minor wave 1.
A double zigzag may have completed today for minor wave 2. This correction is now very deep. There is almost no room left for it to move into. If this alternate is correct, then price should move strongly lower tomorrow.
TECHNICAL ANALYSIS
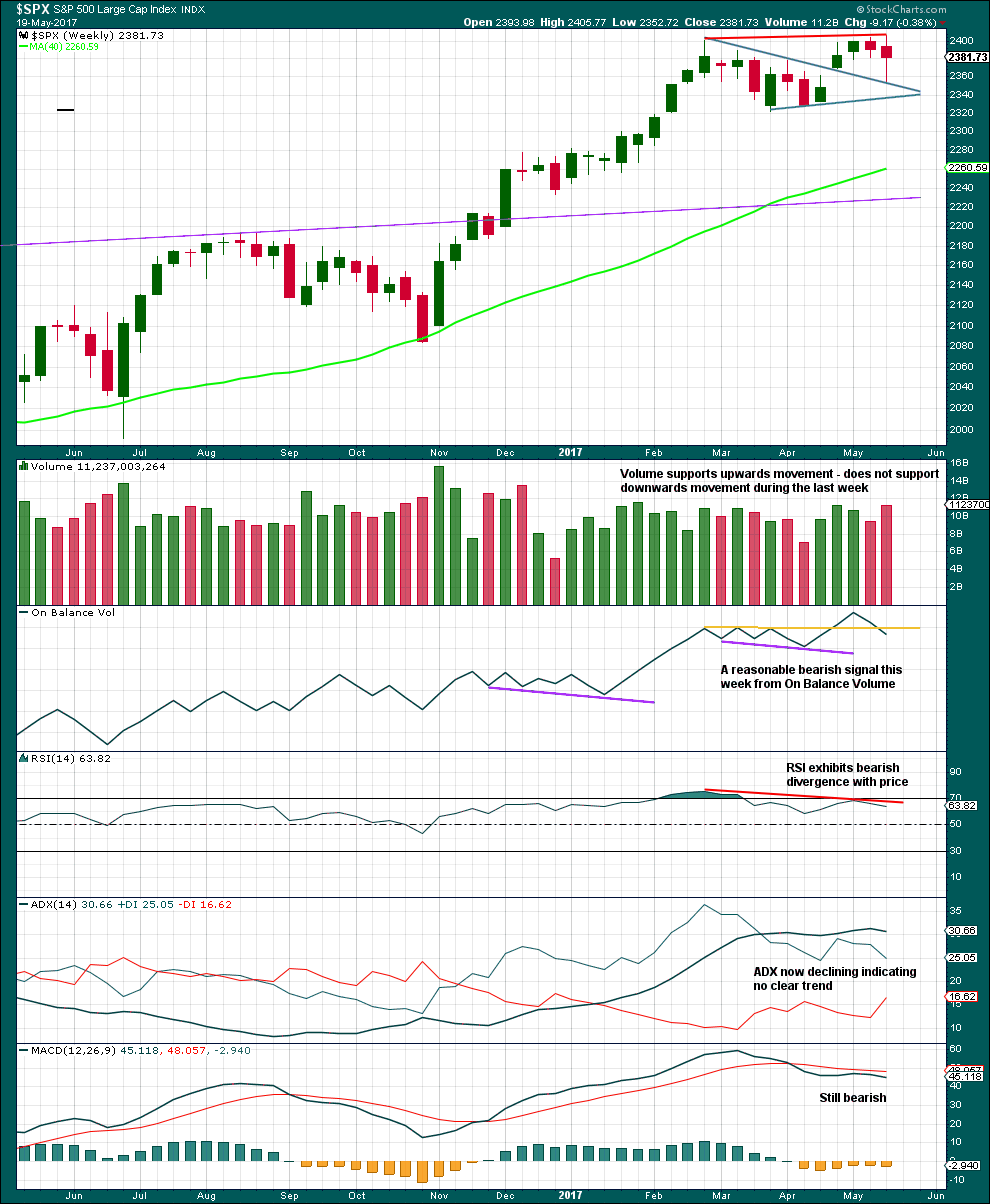
WEEKLY CHART
Click chart to enlarge. Chart courtesy of StockCharts.com.
Last weekly candlestick is an outside week with the balance of volume downwards. Volume shows an increase, so there was support for the fall in price during the week.
The long lower wick on the last weekly candlestick is bullish. Support right at the upper edge of the triangle trend line is bullish. This looks like a typical breakout from the large symmetrical triangle followed by a curve back to test support at prior resistance.
So far this all supports the main wave count more than the alternate.
However, On Balance Volume gives a reasonable bearish signal last week supporting the alternate wave count. Long standing members are aware that I give a lot of weight to On Balance Volume with trend lines because it works very well. For this reason I would judge the alternate wave count to have a fairly reasonable probability.
Divergence with the new all time highs last week from price and RSI is also fairly bearish. This supports the alternate wave count.
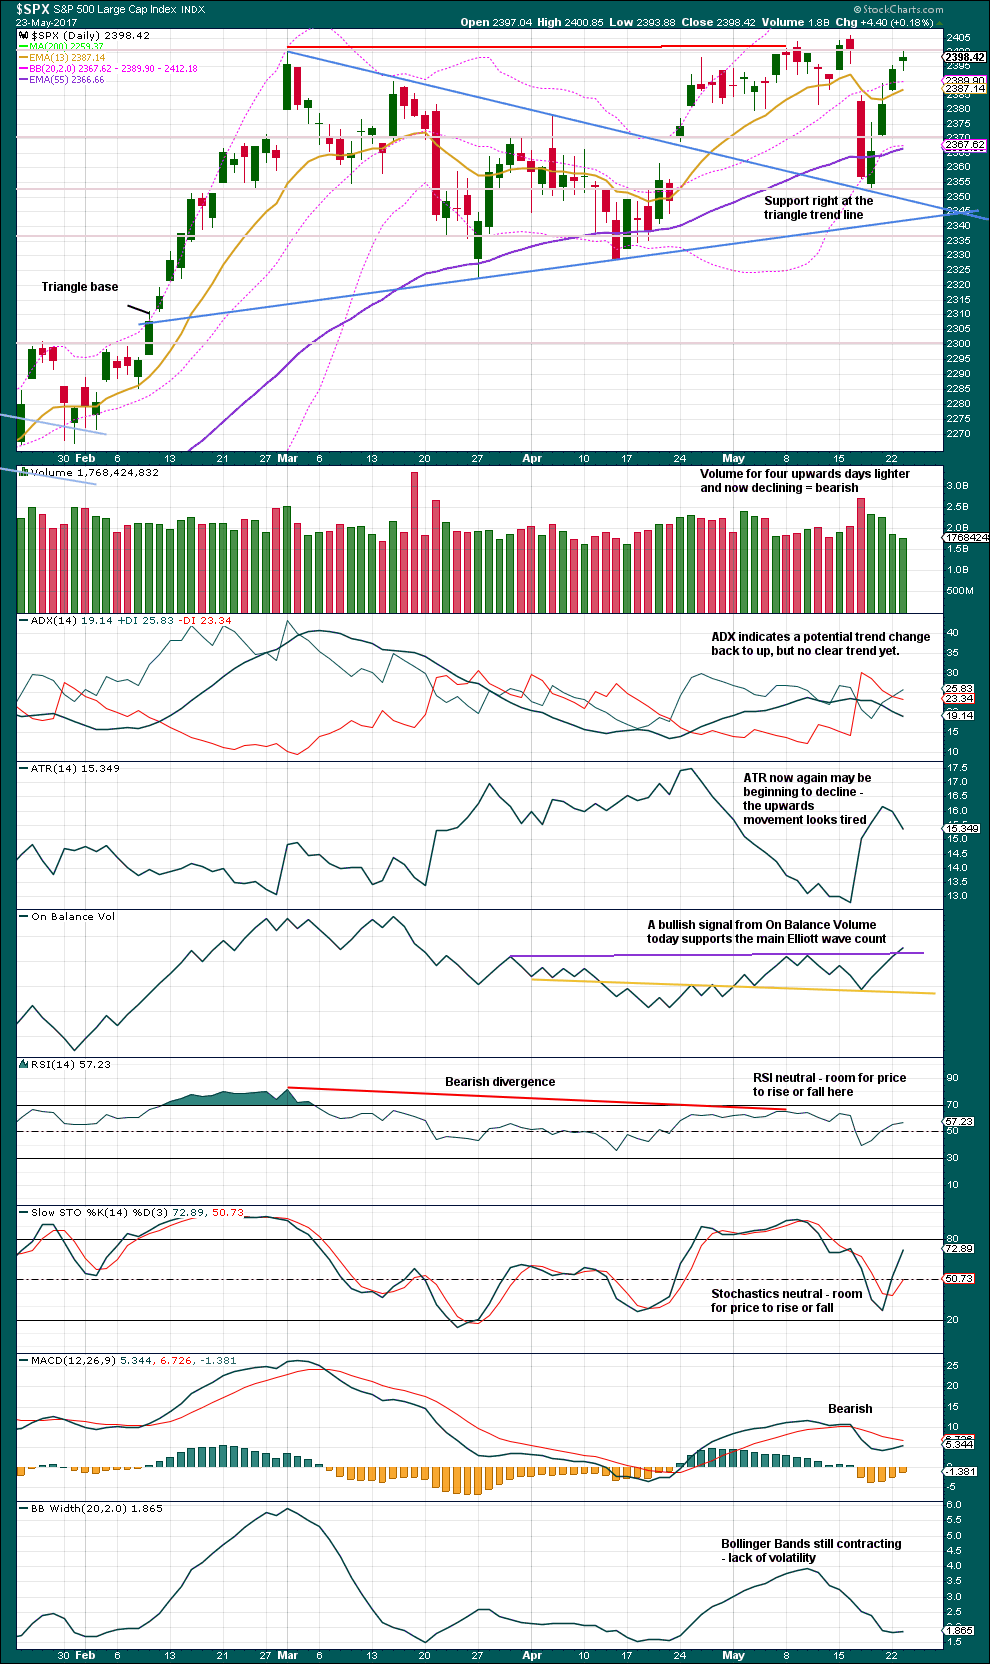
DAILY CHART
Click chart to enlarge. Chart courtesy of StockCharts.com.
The last three candlestick patterns complete a Stalled pattern which has support from declining volume as price moves higher. This is a reversal pattern.
This is contradicted today by a bullish signal from On Balance Volume. The purple trend line is long held and does not have a strong slope, but it has only been tested twice before. This bullish signal is not a strong one but does support the main Elliott wave count.
Given clearly declining volume and the Stalled candlestick pattern, it is my judgement that on balance this chart offers more support today to the alternate Elliott wave count than the main Elliott wave count.
VOLATILITY – INVERTED VIX CHART
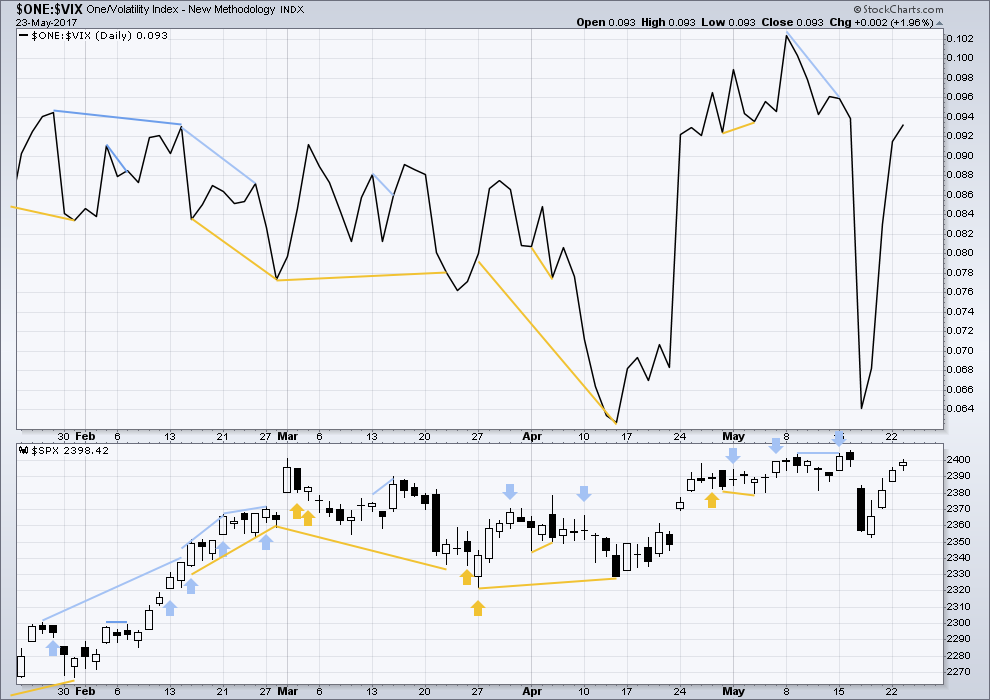
Click chart to enlarge. Chart courtesy of StockCharts.com.
Normally, volatility should decline as price moves higher and increase as price moves lower. This means that normally inverted VIX should move in the same direction as price.
There is no new divergence today between price and VIX.
BREADTH – AD LINE
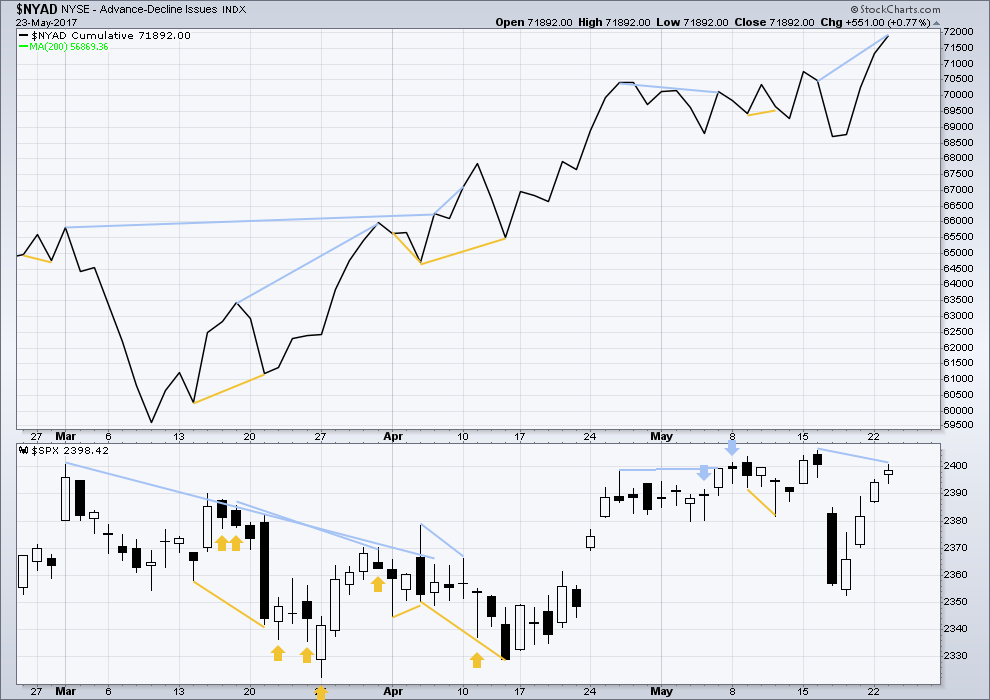
Click chart to enlarge. Chart courtesy of StockCharts.com.
With the last all time high for price, the AD line also made a new all time high. Up to the last high for price there was support from rising market breadth.
There is normally 4-6 months divergence between price and market breadth prior to a full fledged bear market. With no divergence yet at this point, any decline in price should be expected to be a pullback within an ongoing bull market and not necessarily the start of a bear market.
If the alternate wave count is correct, then it would be possible that primary wave 4 may pull the AD line down low enough, so that when primary wave 5 resumes the bull market the AD line may not make new all time highs. Thus divergence may develop from the last high this week with price and the AD line and that divergence may span 4-6 months. However, while this is entirely possible, it is also a rough speculation on the future.
Bearish divergence continues today with the AD line making a new all time high that is not met with a new all time high from price. This indicates weakness within upwards movement from price.
DOW THEORY
The DJIA, DJT, S&P500 and Nasdaq continue to make new all time highs. This confirms a bull market continues.
The following lows need to be exceeded for Dow Theory to confirm the end of the bull market and a change to a bear market:
DJIA: 17,883.56.
DJT: 7,029.41.
S&P500: 2,083.79.
Nasdaq: 5,034.41.
Charts showing each prior major swing low used for Dow Theory are here.
This analysis is published @ 10:40 p.m. EST.
So close to a new ATH…. almost there….
I expected another downwards day today, so much so I took a punt on the short side. Oh dear.
Some reanalysis of this upwards movement. The S&P so often forms slow rounded tops, and this looks like what is happening at the end of minute i.
There will be a pullback. If it begins before a new ATH then the alternate may be possible and it could be deep.
But if it begins after a new ATH then it may be brief and shallow.
So here’s a possible trading strategy for it: a pullback before a new ATH may be shorted, but take profits quickly.
A pullback after a new ATH may be an opportunity to enter long at a good price.
The flash crash on the Russell was pretty indicative of what’s coming; however they were right there to pump back up, while continually slamming the VIX. The only word I have is disgusting. I took all my funds, and Hedge Fund I run to sidelines.
I really appreciate Lara’s allowing members to express opinions on non-market topics with the caveat of course that we do it in a respectful and gracious manner.
I want to again mention my own dismay at our policy of endless wars and intervention here in the US. With the 20/20 vision of hindsight, most thinking citizens can now see that the reasons our leaders gave for prosecuting recent wars, and which so many of us believed, were nothing but a tissue of lies. The sad fact is, there are still very few Americans who understand for example, the invasion of Panama and humiliation of Noriega had nothing to do with communism and everything to do with drugs. The senior Bush is a drug mafioso, plain and simple, as are the Clintons. Our intervention and loss of blood and treasure in Afghanistan has little to do with terrorism, and everything to do with the heroin trade. Our destruction of Iraq had little to do with weapons of mass destruction, and everything to do with Saddam attempting to sell his oil in Euros, so undermining the Petro-dollar. Likewise the destruction of Libya and Ghadaffi’s plan for uniting the Arab nations behind a gold-backed dinar. I could go on but you get the message. The sad fact is the vast majority of Americans are ill-informed about the true motives of the government making decisions on their behalf. The criminals in government depend on this ignorance. In this sense, Western nations are now paying the price for the wanton blood-shed they have visited upon so many Middle Eastern countries, People are not going to want to hear this but it is the truth. Sadly, it is the citizens who will pay, and make no mistake, the US will not escape the terror. All this blood-shed has been taking place during multi generational topping process in the markets. Can you imagine what is going to happen when a bear market of the magnitude that is coming really takes hold? I hope to be snugly tucked away in a little villa in the BVI, far from the US mainland.
I would like to give just four short comments regarding this matter and then I will shut up. First, like Vern, I also am thankful we have this forum to voice our thoughts and hear from others across the world. Iron sharpens iron.
Secondly, throughout all of history humanity has displayed deep seated evil in the heart. It is displayed by power through oppression and dominance. It started with Cain over Able. It has not stopped since. Both Western and Eastern civilizations throughout history have been such perpetrators. This includes all the empires of Middle Eastern societies. Nothing is different today. Even New Zealand as it exists today is the result of conquest and oppression by the British Empire.
Thirdly, the children are not responsible for the sins of the fathers (parents).
Finally, while religious people have acted in evil throughout history, whenever Christians have done so it has been against what is written in their scripture. The atrocities of the Crusades, the burning of the witches and heretics, are all perverse distortions of the Christian scriptures. Those activities and people claiming to be acting for God or Christ, were not acting for God or Christ as they were acting contrary to the teachings of their scriptures.
Islamic terrorists, however, are not acting contrary to their scriptures. The Koran is filled with citations to kill and destroy the infidel. The infidel is defined as any person who does not believe or praise Allah especially the Jew and Christian. While most Muslims in the world today do not condone or practice such terrorist activity, it will never disappear from the Islamic faith because it is part and parcel of their scriptures that guide their beliefs and behavior. Thus we have the atrocity of a Muslim terrorist killing 22 children of ‘infidels’ as they leave a concert.
That is the heart of the problem. The people we call “radical” are actually doing exactly what their holy book prescribes. The “moderates” are correctly accused by the so-called radicals of being untrue to Islamic doctrine. This is a conundrum that few in the West appreciate, even President Trump. The Muslim who is faithful to his faith, must insist on SUBMISSION of every non-muslim.
The radicals do it by violence. The moderates do it by stealth – infiltration of local governments, population dominance, imposition of Sharia law in Western cultures. I mean no disrespect to those who follow Isalm, folk, but this is simply the way it is. I am not sure what the answer is. There are places in the Middle East where people of different faiths have co-existed for thousands of years but they are the exception. I do not think this is any longer a possibility in the 21 century. One of the two belief systems will have to give way. It is starting to look as if Europe has made a choice (or have had it made for them).
I’ll add another piece of the puzzle here, a spanner in the works.
There are more people in the countries within the Middle East being killed by bombs from the USA, UK, Australia and allies at this time, than there are people being killed by terrorist attacks in the western world.
So if you want to calculate damage by a body count, buildings and cities destroyed, our side is doing more damage.
Both sides are guilty of atrocities and violence. But at this stage returning violence with more violence isn’t working, and won’t work.
But then you probably should also know that my opinion also comes from a place of pacifism, wanting peace.
That’s not good for the arms manufactures, who I suspect carry a lot of weight in powerful circles. War makes them profit 🙁
And finally, I’ll add that this membership is global. We have members here in countries in the region of the Middle East. Not many, but we do.
Oh yes! The military industrial complex makes trillions from the war machine. The criminal politicians use the military to protect and transport their drugs and bully countries into submission when they oppose this illegal traffic, or in any way threaten the petro-dollar that enables it. Just think of it. There used to be five countries not under the control of the Rothschild banksters and the IMF: Iraq, Libya, Iran, Cuba and North Korea.
By the way, one of the first things Putin did when he got into power was kick the Rothschild banksters out of Russia. Capisce?!
I am one American who understands the grievances people of these countries have against the US and its war-mongering allies.
It still does not justify the killing of the innocent. As Lara says, two wrongs do not make a right…
Lara, I completely agree with your observations and conclusions. Unfortunately in the USA that disposition is in the vast minority. I agree that the USA has justified many of its enemies. While pacifism is the minority, the evil heart still and always will exist in all humanity. So very sad to me.
Well, I wouldn’t go so far as to say enemies are justified because I would never define violent retaliation as justified.
But I can understand the reaction.
If we really want to end terrorism then we have to listen to what our enemies are saying. And this enemy is saying (amongst other things) that they encourage terrorist attacks on and in the west as retaliation for the west bombing and killing in their countries.
If we don’t listen and try to see their POV we’ll be doomed to an ever escalating cycle of violence and more death. On both sides.
VIX being sold and hard. There is a sense of sheer panic in the way they are trying to manipulate volatlity.
me again,,huuuuu huuuu, that was my best Elmer Fudd laugh
pretty good too it is Doc 🙂