
A bounce was expected for Thursday’s session and this is exactly what happened.
Summary: This upwards bounce may be a counter trend bounce. If price makes a new low below 2,344.51 tomorrow, then the wave count would see either intermediate wave 4 or primary wave 4 continuing lower for at least a few weeks. There is enough bearishness today to have some doubt on the main wave count, so it requires confidence with a strong upwards day or a new all time high.
If price makes a new low below 2,353.29, members may like to consider entering short on a bounce. A new low below 2,344.51 should see only short positions held. Pullbacks can have strong whipsaws and only experienced traders should trade them. Others should wait patiently for the correction to be over.
Always use a stop and do not invest more than 1-5% of equity on any one trade. Manage risk carefully.
New updates to this analysis are in bold.
Last monthly and weekly charts are here. Last historic analysis video is here.
MAIN ELLIOTT WAVE COUNT
WEEKLY CHART
Click chart to enlarge.
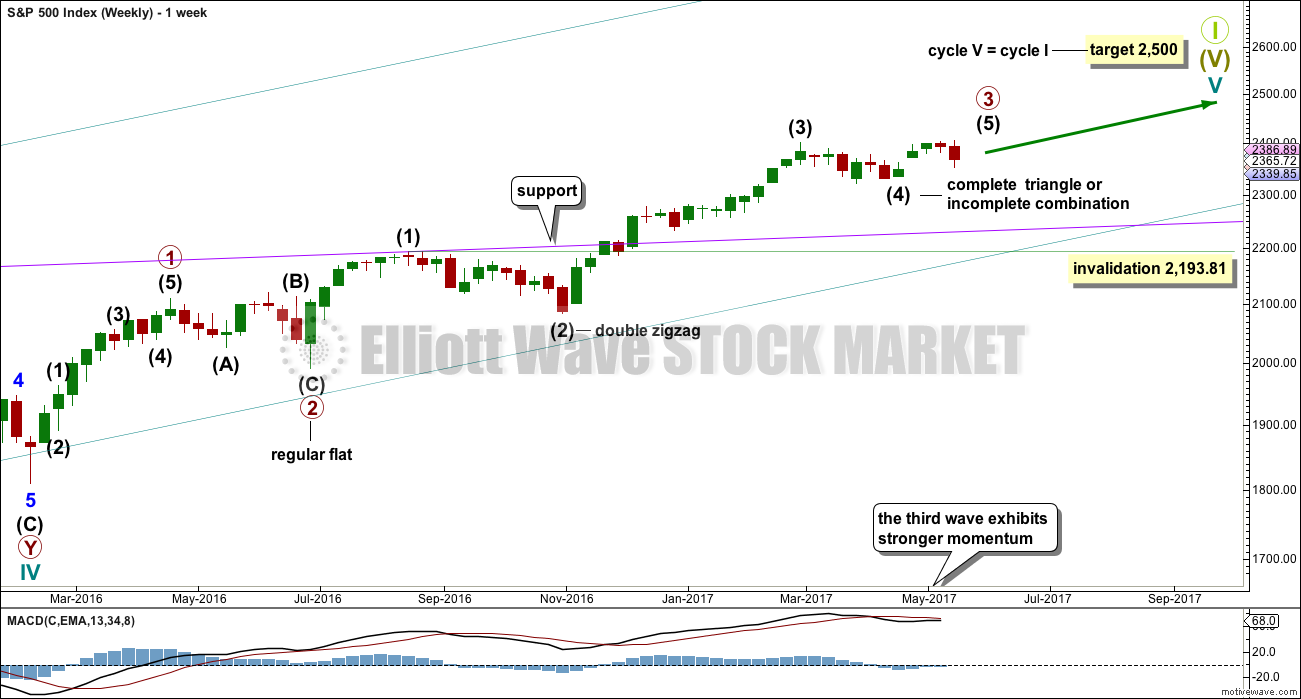
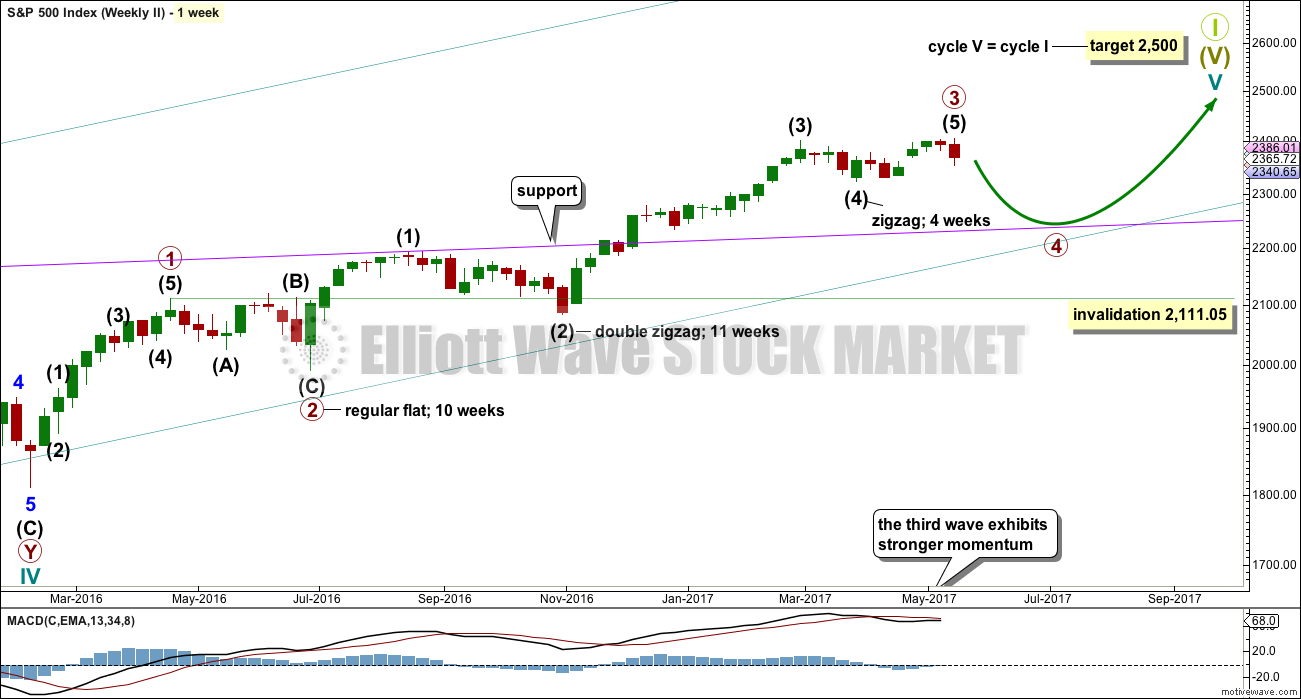
This wave count sees the middle of primary wave 3 a stretched out extension, which is the most typical scenario for this market.
Primary wave 3 may be incomplete. A target is now calculated for it on the daily chart.
There is alternation within primary wave 3 impulse, between the double zigzag of intermediate wave (2) and the possible triangle or combination of intermediate wave (4).
When primary wave 3 is a complete impulse, then a large correction would be expected for primary wave 4. This may be shallow.
Thereafter, primary wave 5 may be expected to be relatively short, ending about the final target at 2,500.
It is also still possible that primary wave 3 was over at the high labelled intermediate wave (3) (this idea has been published previously) and that would mean that price should currently be within primary wave 4. This idea does not at this stage diverge in terms of expected direction or structure from the daily alternate wave count below, so for clarity and to keep the number of charts manageable it will not be published on a daily basis. I will follow the idea and will again publish it when it begins to diverge from the main wave count.
DAILY CHART
Click chart to enlarge.
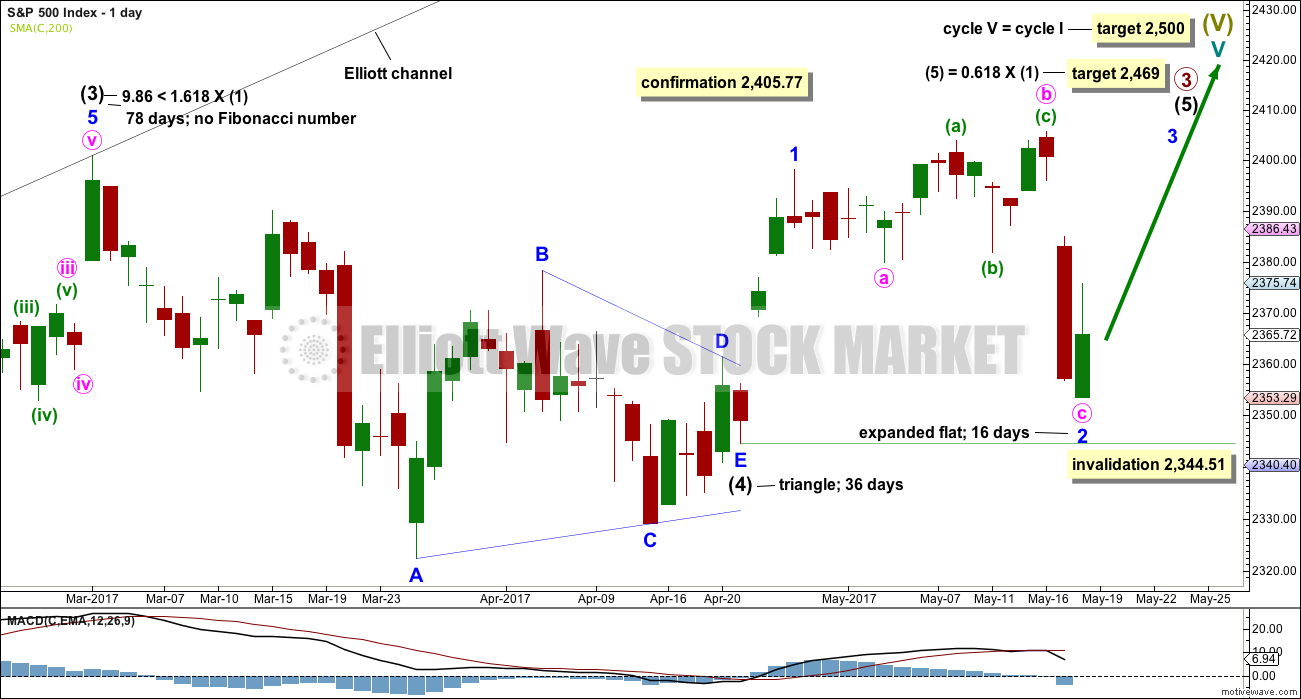
Intermediate wave (4) may be a complete regular contracting triangle. It may have come to a surprisingly swift end with a very brief E wave.
There is already a Fibonacci ratio between intermediate waves (3) and (1). This makes it a little less likely that intermediate wave (5) will exhibit a Fibonacci ratio to either of intermediate waves (1) or (3); the S&P often exhibits a Fibonacci ratio between two of its three actionary waves but does not between all three.
Within intermediate wave (5), minor wave 1 is complete. Minor wave 2 should be complete.
If it continues any lower, minor wave 2 may not move beyond the start of minor wave 1 below 2,344.51.
The structure of intermediate wave (5) on the daily chart does not look complete. So far it looks like a possible three up. Minor wave 3 still needs to complete, then minor waves 4 and 5. This may last another couple of weeks at least.
HOURLY CHART
Click chart to enlarge.
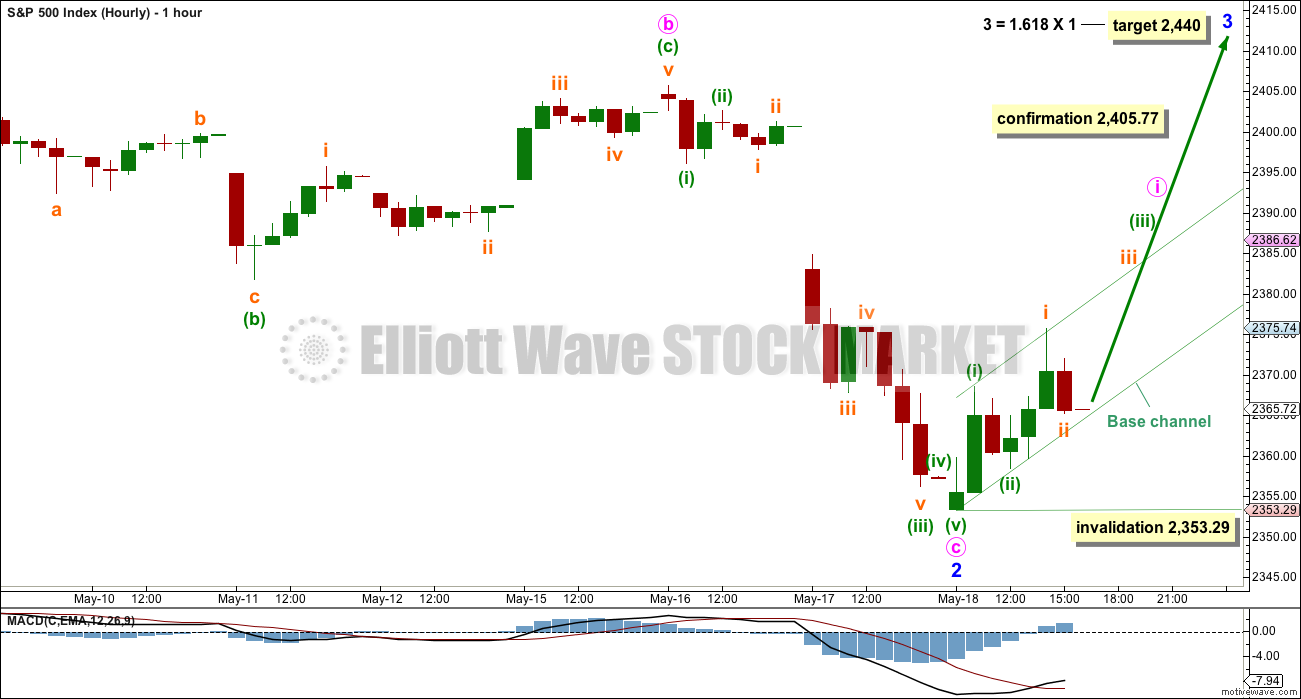
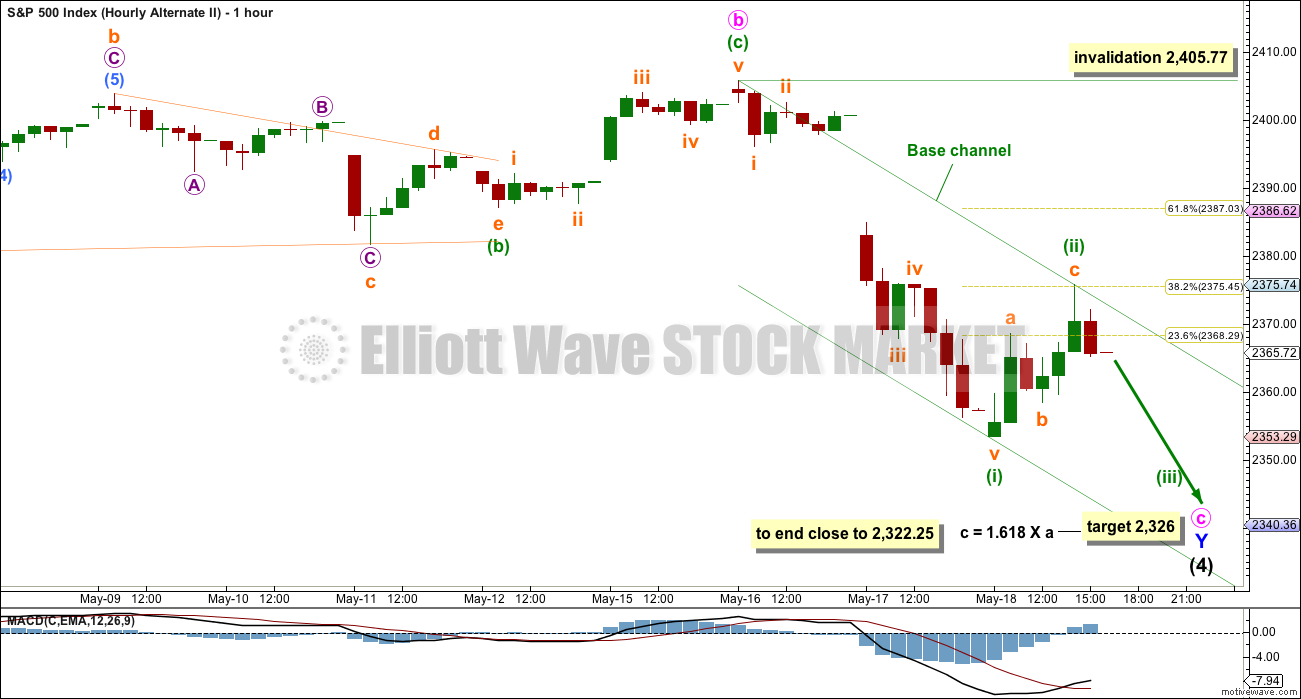
Minor wave 2 fits as a very common expanded flat. Within minor wave 2, minute wave b is a 1.41 length of minute wave a, only a little longer than the common range of up to 1.38.
At the new low today, minute wave c is now 4.28 points longer than 2.618 the length of minute wave a.
The channel about minute wave c, which was drawn on yesterday’s main hourly chart, was breached by upwards movement today. This adds a little confidence to a low being in place, at least for the short term. Minor wave 2 could be over for this wave count.
A new all time high would see the alternate below discarded and this main wave count confirmed.
Within minor wave 3, which may only subdivide as an impulse, the first wave up for minute wave i would likely be incomplete. When it is a complete five, then a three down for minute wave ii may not move beyond the start of minute wave i below 2,353.29.
ALTERNATE DAILY CHART
Click chart to enlarge.
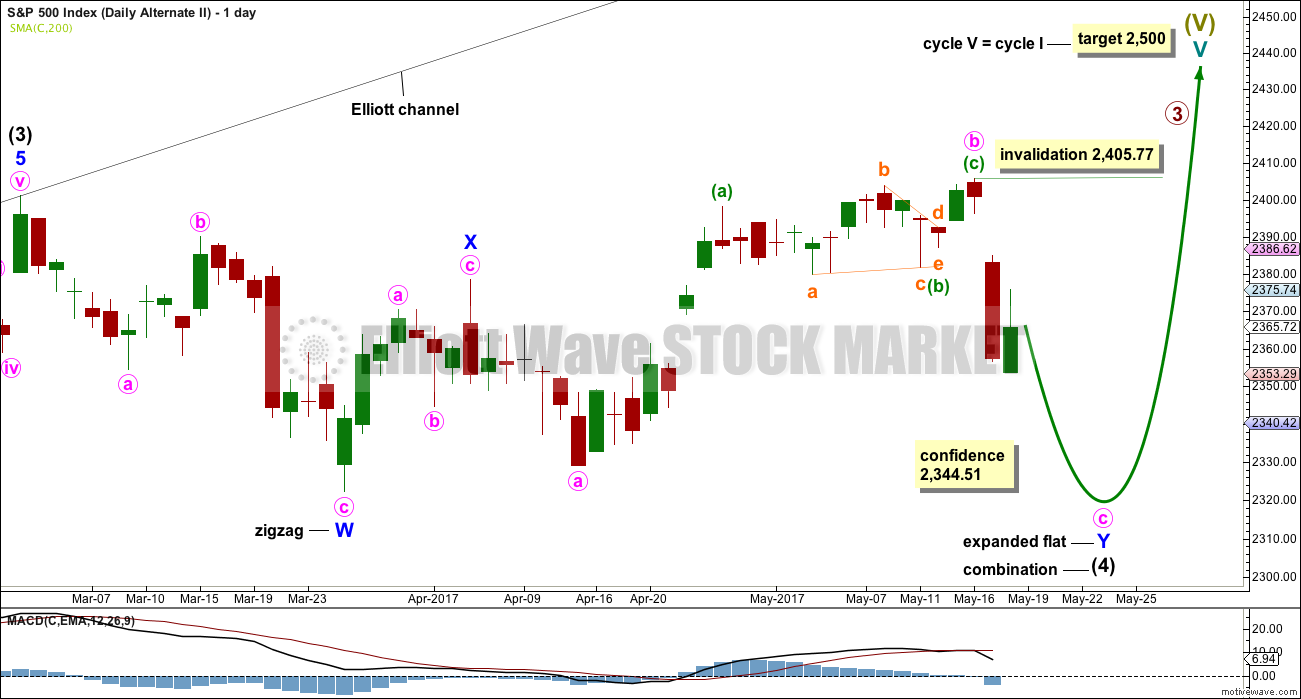
What if intermediate wave (4) was not a complete triangle but is still unfolding as a double combination? The subdivisions of this wave count would be labeled in the same way, with the exception of the degree of labelling, if the correction were to be primary wave 4.
Double combinations are very common structures. This would still provide perfect alternation in structure with the double zigzag of intermediate wave (2). Although double zigzags and double combinations are both labelled W-X-Y, they are very different structures and belong to different groups of corrections.
The purpose of combinations is the same as triangles, to take up time and move price sideways. Intermediate wave (2) lasted 58 days. So far intermediate wave (4) has lasted 55 days. If it continues for another one to two weeks, it would still have excellent proportion with intermediate wave (2).
This alternate wave count still has some support from classic technical analysis, particularly extreme ADX at the weekly chart level.
ALTERNATE HOURLY CHART
Click chart to enlarge.
Minute wave b is longer than the common range of up to 1.38 times the length of minute wave a, but still within allowable limits of up to 2. Minute wave b is a 1.55 length of minute wave a.
However, I have seen plenty of expanded flat corrections with B waves longer than 1.38 times the length of their A waves. This wave count remains entirely acceptable.
Minute wave c would be very likely to end at least slightly below the end of minute wave a at 2,328.95 to avoid a truncation and a very rare running flat.
The target would see minor wave Y end very close to the same level as minor wave W, within 4 points. The whole of intermediate wave (4) would have a big sideways look, typical of combinations.
Minute wave c must subdivide as a five wave structure, either an impulse (much more common) or an ending diagonal (less common). So far it looks likely to be an impulse.
Minuette wave (i) looks to be complete. Minuette wave (ii) may have unfolded today, ending close to the 0.382 Fibonacci ratio. This is a relatively shallow second wave correction though, so look out for the very real possibility that minuette wave (ii) may continue higher as a double zigzag to end close to the 0.618 Fibonacci ratio, about 2,387.
Minuette wave (ii) may not move beyond the start of minuette wave (i) above 2,405.77.
ALTERNATE WEEKLY CHART
Click chart to enlarge.
This idea is new.
What if the last all time high just ended primary wave 3? What if primary wave 4 began with the strong drop yesterday? At the weekly chart level, this labelling has a good look that will also fit on the daily chart.
This only works if intermediate wave (4) was over as a relatively quick single zigzag. This does not offer good alternation nor good proportion with the double zigzag of intermediate wave (2). However, this wave count is still considered because the S&P just does not always exhibit nice proportions nor does it always exhibit good alternation.
Primary wave 2 was a regular flat correction lasting 10 weeks. Given the guideline of alternation, primary wave 4 should be expected to most likely be a single or multiple zigzag and so more brief than 10 weeks. It may find support at the lilac trend line.
This idea will be developed further this weekend. If it has a very good fit and good Fibonacci ratios, then it may be published on a daily basis. At this early stage, primary wave 4 would require a five down to complete at the daily chart level, so at this early stage a new all time high would see this new idea discarded.
TECHNICAL ANALYSIS
WEEKLY CHART
Click chart to enlarge. Chart courtesy of StockCharts.com.
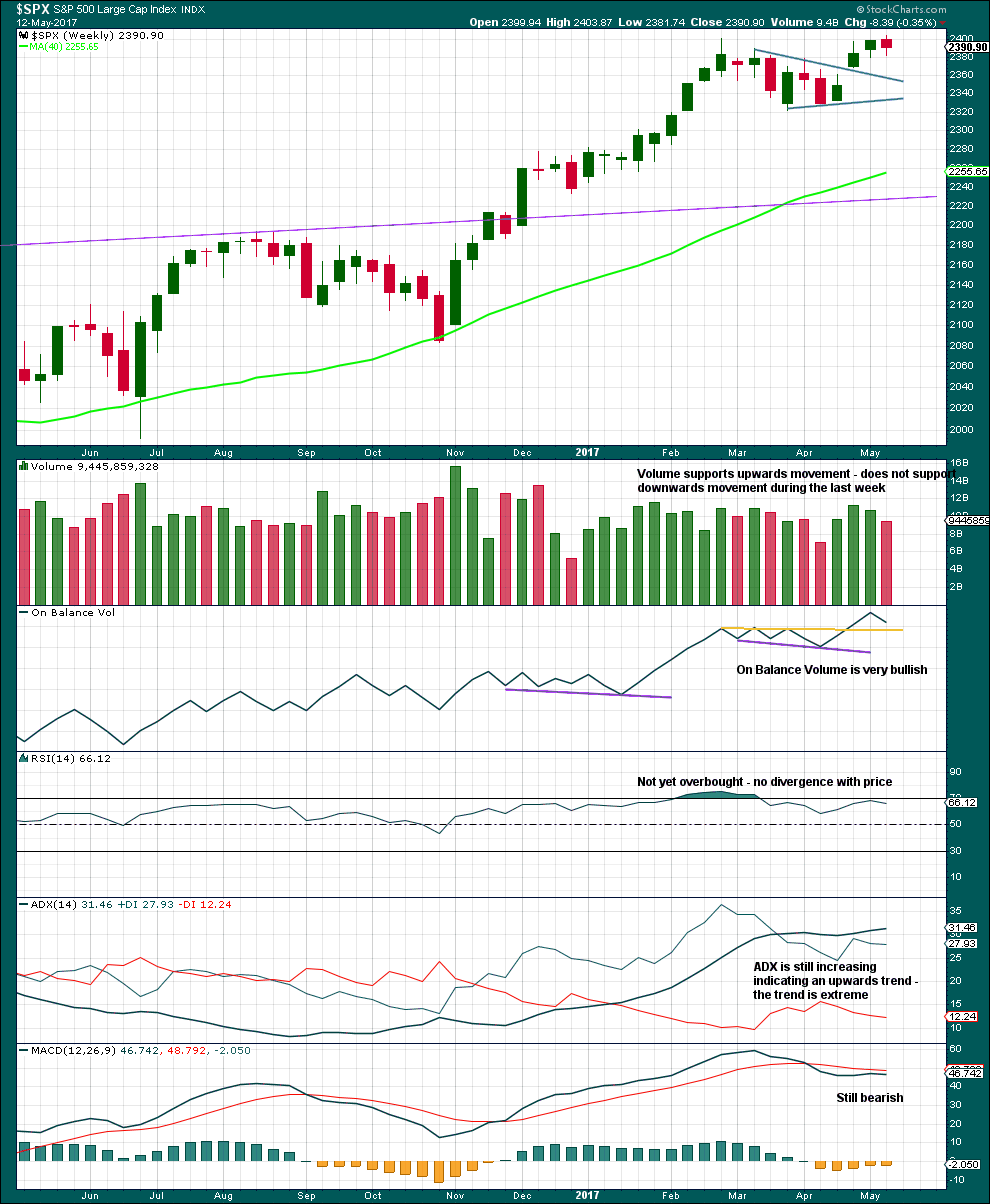
An upwards week is completed but closes red. The balance of volume is down and it shows a decline. Downwards movement during the week did not have support from volume. This looks like a pullback within a larger upwards trend.
ADX is extreme and nearing very extreme. A bigger consolidation or deeper pullback should be expected.
Within this bull market, beginning in March 2009, this has happened at the weekly chart level on four occasions: January 2010, the end of February 2011, early June 2013, and late July 2014. On each occasion it was immediately followed by three to four weeks of downwards movement.
DAILY CHART
Click chart to enlarge. Chart courtesy of StockCharts.com.
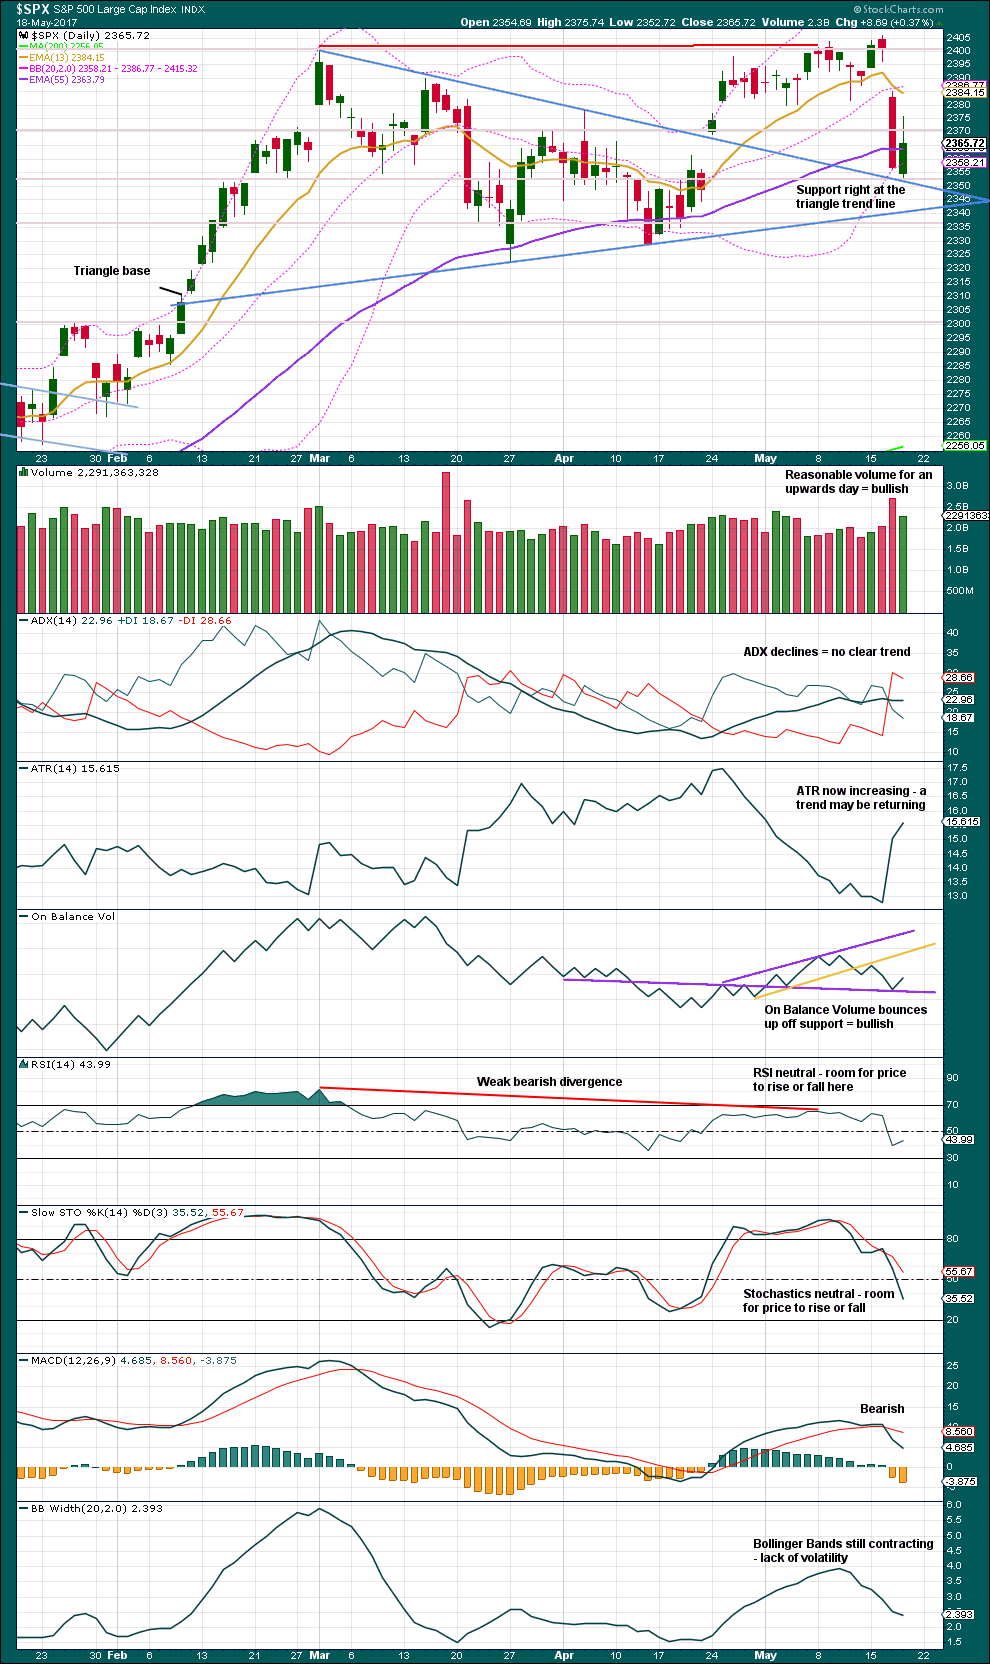
Price bounced up exactly from the triangle trend line and a strong horizontal line of prior support and resistance about 2,350. This was expected, but how high will it go now?
Volume remained fairly heavy today (compared to recent days) although it is lighter than yesterday’s downwards day. Reasonable volume today will be read as bullish for the very short term at least.
The long upper wick on today’s candlestick is fairly bearish. This supports the alternate wave count and the new weekly wave count.
Expect the larger trend still remains up. The short term Fibonacci 13 day moving average is above the mid term Fibonacci 55 day moving average, and both are above the long term 200 day moving average.
On Balance Volume fairly strongly supports the main wave count.
VOLATILITY – INVERTED VIX CHART
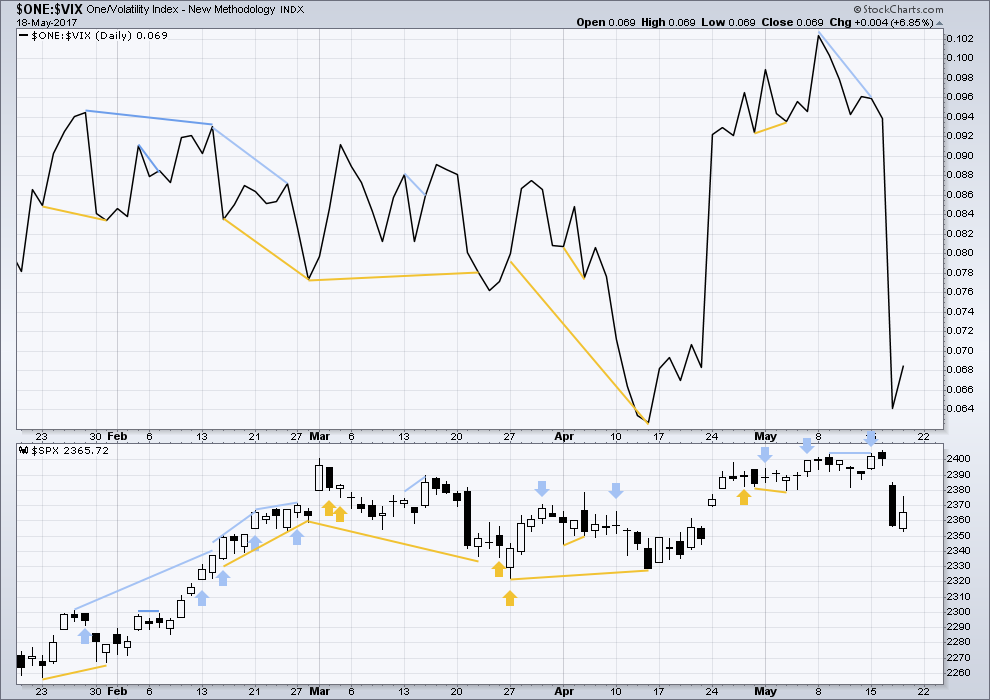
Click chart to enlarge. Chart courtesy of StockCharts.com.
Normally, volatility should decline as price moves higher and increase as price moves lower. This means that normally inverted VIX should move in the same direction as price.
It is noted that there are now six multi day instances of bullish divergence between price and inverted VIX, and all have been followed so far by at least one upwards day if not more. This signal seems to again be working more often than not. It will again be given some weight in analysis.
No new divergence is noted today.
BREADTH – AD LINE
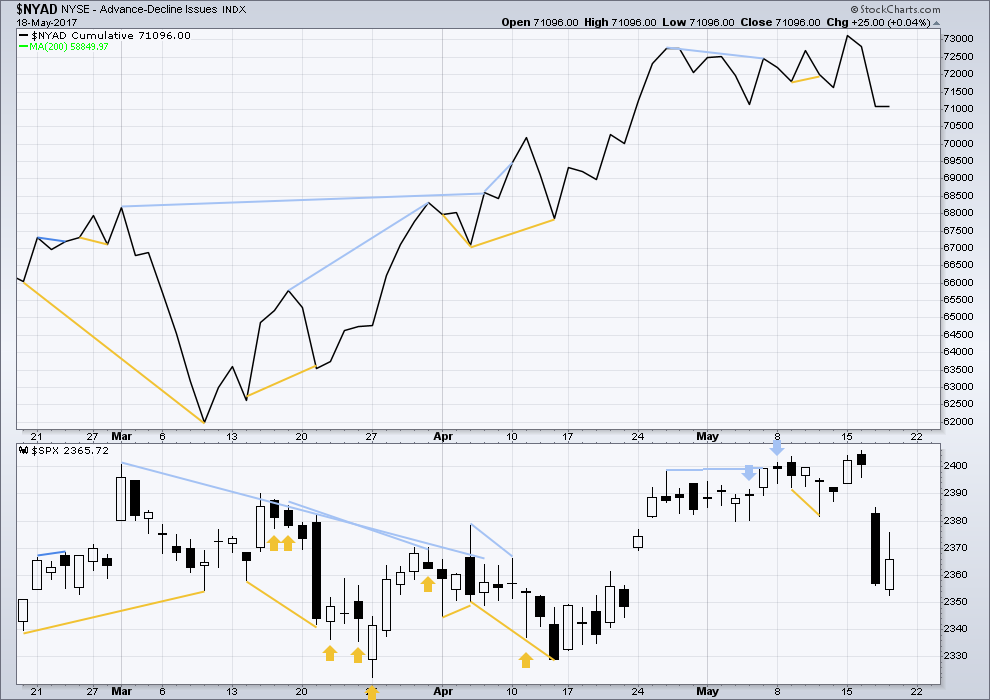
Click chart to enlarge. Chart courtesy of StockCharts.com.
Breadth has remained essentially flat, so the rise in price today did not have support from market breadth. This is not clear divergence, but it will be read as at least slightly bearish. It makes the bounce today look more likely to be a counter trend bounce than the start of a new healthy trend. It supports the alternate wave count.
DOW THEORY
The DJIA, DJT, S&P500 and Nasdaq continue to make new all time highs. This confirms a bull market continues.
The following lows need to be exceeded for Dow Theory to confirm the end of the bull market and a change to a bear market:
DJIA: 17,883.56.
DJT: 7,029.41.
S&P500: 2,083.79.
Nasdaq: 5,034.41.
Charts showing each prior major swing low used for Dow Theory are here.
This analysis is published @ 05:50 p.m. EST.
Updated main hourly chart before the close:
So far it’s possible minute i could be over…. but it has a better look if it needs one final fifth wave higher as I’ve labelled it.
When minute wave i is over I’d expect a red daily candlestick for minute ii to show up, but to be shallow, close to 0.382 of minute wave i.
Lara, what about a 1 down, from (V) of 3 and this is a 2nd wave bounce?
Until the gap fills, that is what I am suspecting. Either way, we get a big move next week. We do have some long upper wicks and somewhat lighter volume than yesterday.
That’s essentially what the alternate has?
It is rare to see market expectations so evenly balanced among option traders. You can get a good sense of what traders are expecting by how options are priced a few weeks out. The SPY week four 238.5 put and calls are priced matched almost perfectly.
Lots of uncertainty in the market and participants are fully aware things have the potential to move substantially in either direction. Have a great weekend all!
Perhaps time for a hedge?
Chris, the alternate would have exactly that. A five down complete, now a three up complete. It’ll have it’s own hourly chart in the next analysis.
Yep. This is the ideal situation for executing a straddle trade prior to the close. I imagine futures will give some indication in which direction we are likely to go, although that has not necessarily always been the case recently.
Thanks!
Today is more proof that Buy and Hold always works!
How about that new Time Mag. Cover? How disgusting!!!
That Mag. should stop publishing and finally go out of business!
Also, I now have 10 more Un-Named Sources confirming the report I posed 2 days ago.
Here is what I posted then for those who did not see it:
An “Un-Named” Source at the NYSE and NASDAQ said that “NYSE and NASDAQ will continue to set new highs for at least the next 3 years heading to 40,000 DJI and 10,000 NASDAQ”. That same “Un-Named” Source continued on to say that “its already Programed in so it’s a 100% Certainty to occur”. I have verified this report from 6 other
“Un-Named” sources!
Have a great day all!
The best laid plans of mice and men…. 🙂
So far, big declines in the markets have certainly been successfully reversed so it does seem like buy and hold is the way to go. It is also clear that weeks of market gains can be erased in a single session. Looks to me like the banksters are giving cover as the smart money exits.
We found Tom the Kiwi today, within about 20 minutes. Third time lucky! Then we also tracked and caught a larger female, Marino, to remove a transmitter and weigh.
Here’s me holding my very first Kiwi. Tom.
And this is Marino. 2.5 kgs of beautiful healthy Kiwi.
Awesome Lara. Good for you.
Thanks Rodney! It was so exciting. I’m still buzzing 🙂
Almost as good as surfing… almost.
Wow!! Absolutely amazing! Great find!
🙂 There are actually three Kiwi in the first pic.
And only one is named Tom 🙂
It was the best day ever Verne. Still buzzing that I got to hold a Kiwi.
Three? Are they hiding, like in Where’s Waldo?
I only see the one you are holding. Is she pregnant and carrying twins?
Can’t be, she’s a birdie…. 🙂
Oops! Birdie is also a He! Unless Tom is an abbreviation of Tomasina… 🙂
There’s Tom of course, the only “real” Kiwi in the pic.
Then there’s me. I’m a Kiwi.
Then there’s the pic of the Kiwi on my T-shirt 🙂
That makes three Kiwi.
How could I have possibly missed the other two?
Particularly the triumphant smile and the mega-cool sun-glasses! 😀
That is amazing! We don’t have anything like that here in NJ.
Yep, he sure is amazing! There’s nothing else like Kiwi in the world.
NZ has only one native mammal, a bat. So all the ecological niches normally occupied by mammals are occupied by birds in NZ. We have a fair few flightless birds with some very unusual characteristics seen no where else in the world.
Unfortunately most of them are endangered. Which is why I help out with predator control in my back yard.
wow ,, peculiar creatures,, look at the pecker on that thing
You meant “Unit”, did you not? 🙂
Yeah, they’re really weird and wonderful birds.
That beak is huge, and while it looks dangerous, it’s quite sensitive.
It has nostrils right at the end of it!
They stick it in the ground sniffing out insects and worms to eat. They can also sense vibrations with it and their whiskers.
Fascinating! The new count. The vigor of that initial wave down does suggest a high degree correction unfolding. Thanks for the new idea!
Key thing to watch today is the 50 dma which was sliced through on Wednesday and proved resistance to Thursday’s bounce. A steep fall away tomorrow and we are probably headed for the 200 dma.
I also just noticed that the purple support line is just at about the 200 dma area.
It would be reasonable to expect a primary four degree correction to tag it as primary two did as well.
We have a gap up and over the 50 Day ema and the 50 day sma. This action is a bit of support for the bullish case of the main count. If we can continue up into and close the gap above today and / or Monday, this will lend a lot of confidence. If the bears are in control, they will not relinquish that 15 point gap from 2385 to 2400.
I agree. The re-take of the 50 dma is important and may indicate at least a short term trend change. The banksters are not quite done yet it would appear. They must have been caught napping on Wednesday.
It seems as if the days of VIX making extended moves above its upper BB are over, at least until the bear market begins. This has now become such a watched move that on every single occasion the last several such moves result in immediate collapse. It has clearly become a popular trade. We no longer see the double penetrations we used to but then of course the impulsed down are all being completed intra day so that is not too surprising- the two penetrations would usually come on the third and fifth waves – no more, Things in the market are constantly changing…
It is very difficult to determine when these kinds of manic moves are due mainly to feverish short covering or a strong new uptrend. The size of the move down this week seem to portend something bigger than just a minor two correction, even if it were a C wave. I was stopped out of my bearish credit call spreads and will remain on the sidelines until I see how we close. I think Rodney is right on the money about that gap. If it remains open today, we could again wake up to freaky futures on Monday at the onset of a third wave down. It is interesting that while SPX has already retaken its 50 dma, DJI seems to be finding strong resistance there so far, indicating a bit of a divergence with SPX, same as we saw at the recent tops.
Gap above Wednesday’s SPX high at 2384.87 so far strong resistance. The bulls need to at least penetrate that area to keep the bull trend alive.
I have been recently wondering if the idea of reversion to the mean is a broken metric. While it is certainly true that these days things are remaining extreme for far longer than anyone could have imagined or has even witnessed previously, RTM will take place, sooner or later. In fact the longer the reversion is delayed, the more violent the resolution. The Euro is now trading at a level that can only be described as ludicrous, a second leap even farther above its upper BB than it displayed two sessions ago, followed by a spinning top last session. Today’s gap up was also the second in the last four sessions. Gaps come at the start, and at the end of bull runs. Buying the March 26 108.50 puts for 0.52 per contract,
SPX bulls starting to poke into gap territory so this is where the real contest is joined. If they can make good progress into this space we could see a melt-up into the close. This ought to be real interesting.
So far they have penetrated by a couple of points at 2385.95
Volume tepid.
They seem determined to close that Wednesday gap but the effort is coming on very low volume.
The whipsaws in this market are starting to become downright stupefying. I suspect we are seeing some crazy machine trading. I have never seen anything quite like it.
The low volume of this move today makes it look more and more like a “shake -the-trees” move along with a flurry of short-covering.
If that is the case, the move up should be mostly reversed by the close. Very tough to figure out what’s going on. The ATH divergence remains and that is usually bearish.
First! 0-0