
The main hourly Elliott wave count was invalidated within the first hour of the session. Two alternate hourly wave counts remained.
Summary: Price is at support and On Balance Volume is at support, and for these reasons the main wave count will expect an end to the pullback here or very soon. Look for a bounce tomorrow, and if the S&P makes a new all time high, the alternate will be discarded. Alternatively, a new low below 2,344.51 would see the main wave count discarded.
New updates to this analysis are in bold.
Last monthly and weekly charts are here. Last historic analysis video is here.
MAIN ELLIOTT WAVE COUNT
WEEKLY CHART
Click chart to enlarge.
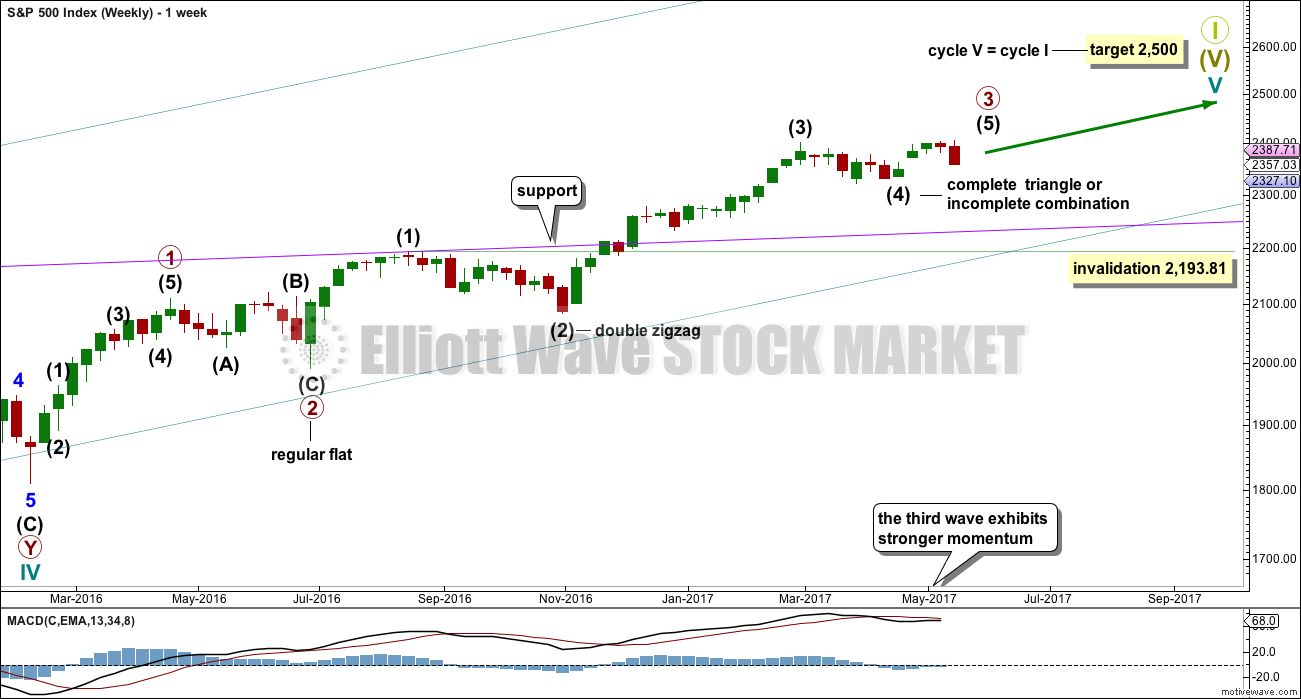
This wave count sees the middle of primary wave 3 a stretched out extension, which is the most typical scenario for this market.
Primary wave 3 may be incomplete. A target is now calculated for it on the daily chart.
There is alternation within primary wave 3 impulse, between the double zigzag of intermediate wave (2) and the possible triangle or combination of intermediate wave (4).
When primary wave 3 is a complete impulse, then a large correction would be expected for primary wave 4. This may be shallow.
Thereafter, primary wave 5 may be expected to be relatively short, ending about the final target at 2,500.
It is also still possible that primary wave 3 was over at the high labelled intermediate wave (3) (this idea has been published previously) and that would mean that price should currently be within primary wave 4. This idea does not at this stage diverge in terms of expected direction or structure from the daily alternate wave count below, so for clarity and to keep the number of charts manageable it will not be published on a daily basis. I will follow the idea and will again publish it when it begins to diverge from the main wave count.
DAILY CHART
Click chart to enlarge.
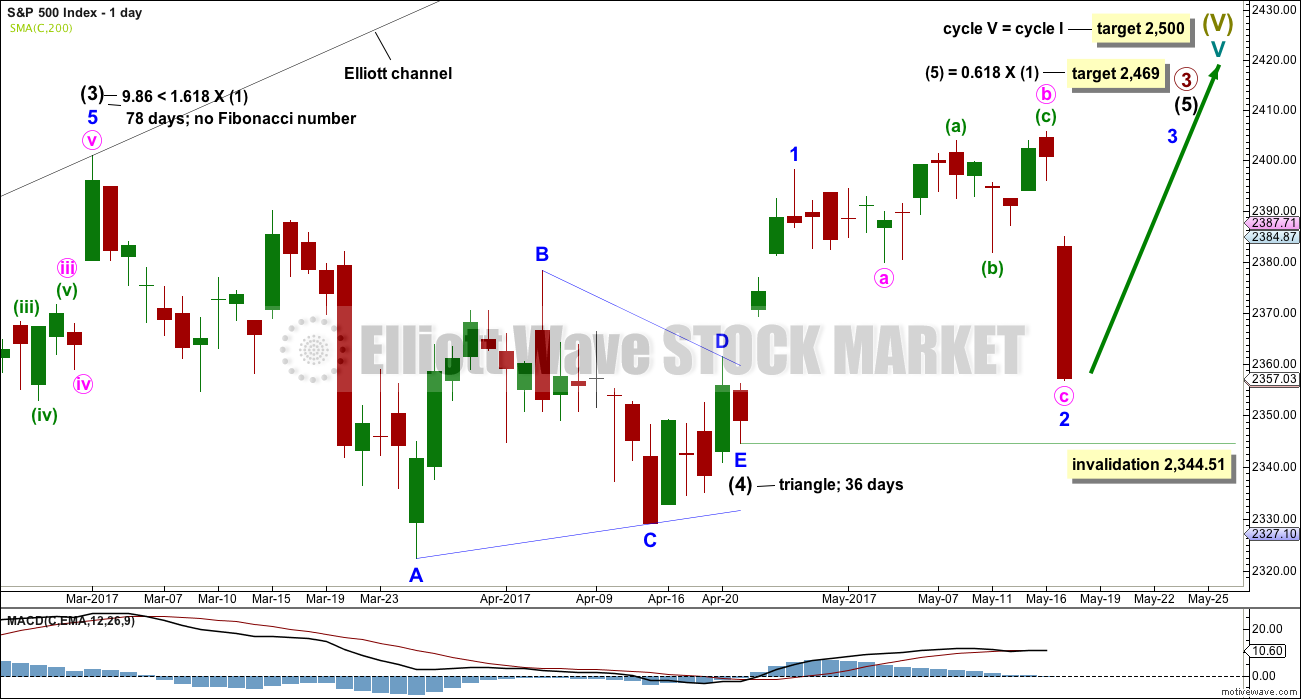
Intermediate wave (4) may be a complete regular contracting triangle. It may have come to a surprisingly swift end with a very brief E wave.
There is already a Fibonacci ratio between intermediate waves (3) and (1). This makes it a little less likely that intermediate wave (5) will exhibit a Fibonacci ratio to either of intermediate waves (1) or (3); the S&P often exhibits a Fibonacci ratio between two of its three actionary waves but does not between all three.
Within intermediate wave (5), minor wave 1 is complete. Minor wave 2 should be complete today or very soon indeed.
Minor wave 2 may not move beyond the start of minor wave 1 below 2,344.51.
The structure of intermediate wave (5) on the daily chart does not look complete. So far it looks like a possible three up. Minor wave 3 still needs to complete, then minor waves 4 and 5. This may last another couple of weeks at least.
HOURLY CHART
Click chart to enlarge.
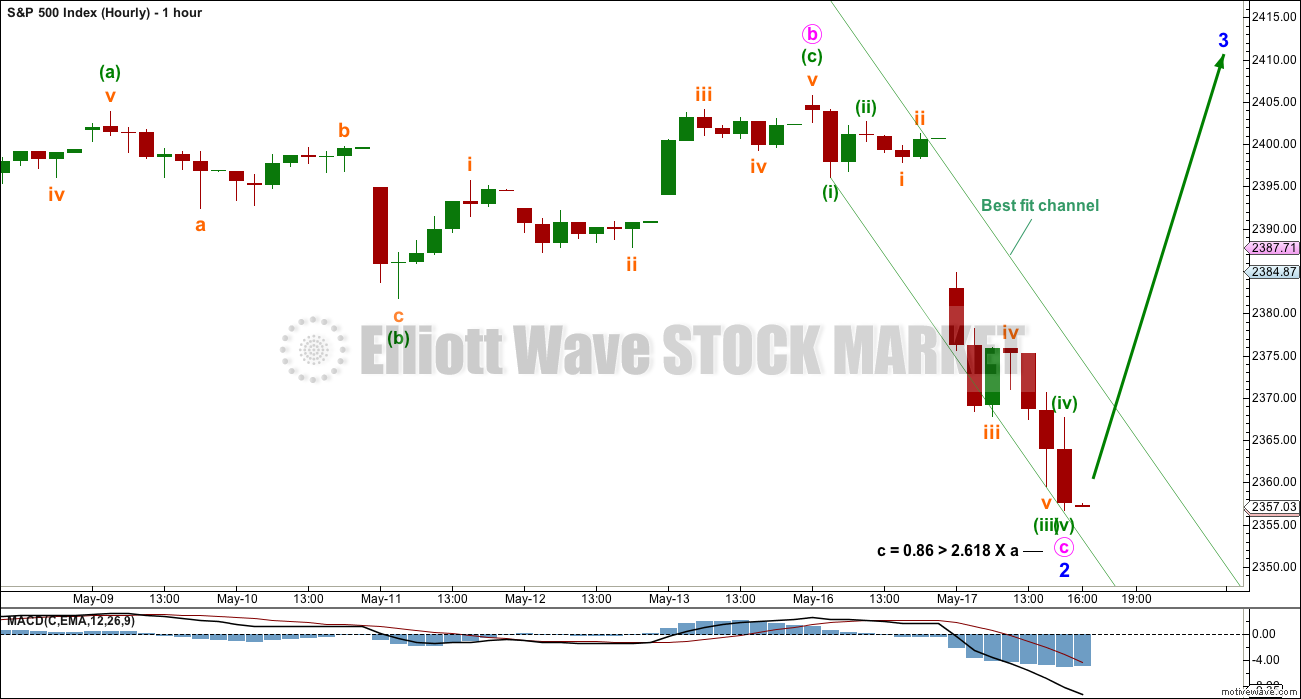
Minor wave 2 fits as a very common expanded flat. Within minor wave 2, minute wave b is a 1.41 length of minute wave a, only a little longer than the common range of up to 1.38.
If minor wave 2 is over at today’s low, then there is a Fibonacci ratio between minute waves a and c.
However, it must be accepted that price could certainly continue lower while it remains within the best fit channel. On the five minute chart, there is no five up at the end of the session to signal a possible low in place.
Only when the channel is properly breached will enough confidence be had that a low is in place in order to calculate a target for minor wave 3.
ALTERNATE DAILY CHART
Click chart to enlarge.
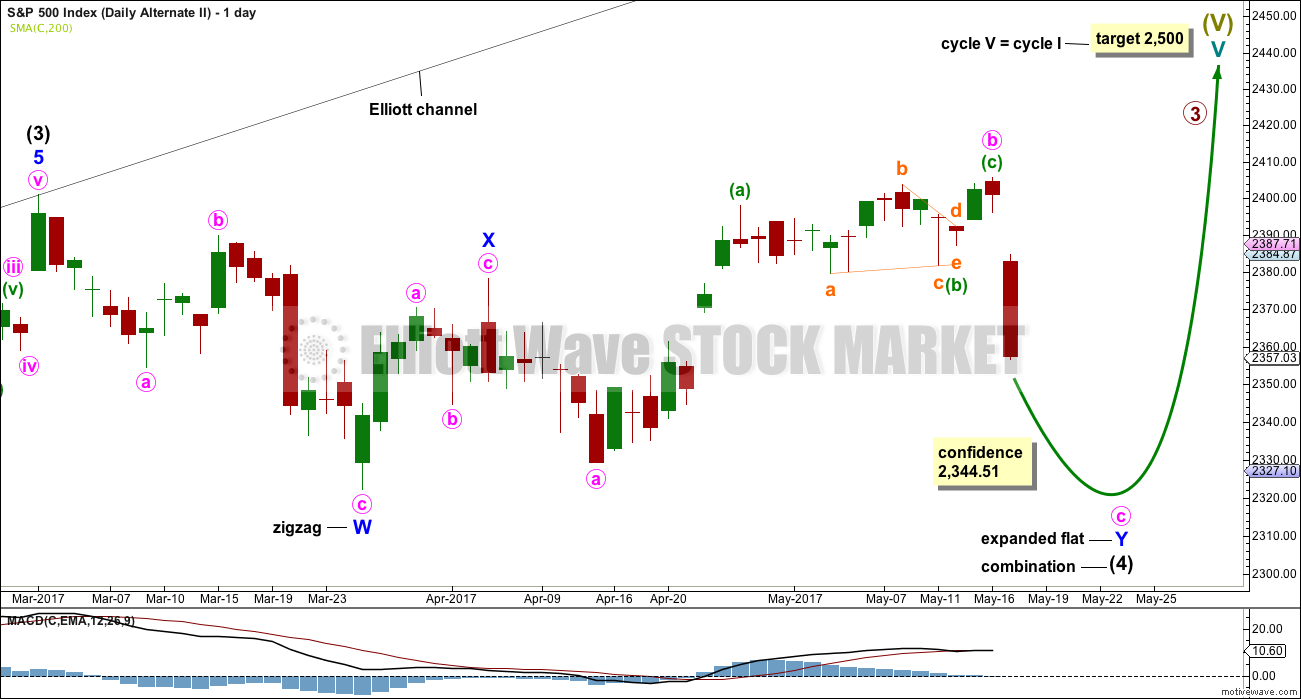
What if intermediate wave (4) was not a complete triangle but is still unfolding as a double combination? The subdivisions of this wave count would be labeled in the same way, with the exception of the degree of labelling, if the correction were to be primary wave 4.
Double combinations are very common structures. This would still provide perfect alternation in structure with the double zigzag of intermediate wave (2). Although double zigzags and double combinations are both labelled W-X-Y, they are very different structures and belong to different groups of corrections.
The purpose of combinations is the same as triangles, to take up time and move price sideways. Intermediate wave (2) lasted 58 days. So far intermediate wave (4) has lasted 54 days. If it continues for another one to two weeks, it would still have excellent proportion with intermediate wave (2).
This alternate wave count still has some support from classic technical analysis, particularly extreme ADX at the weekly chart level.
ALTERNATE HOURLY CHART
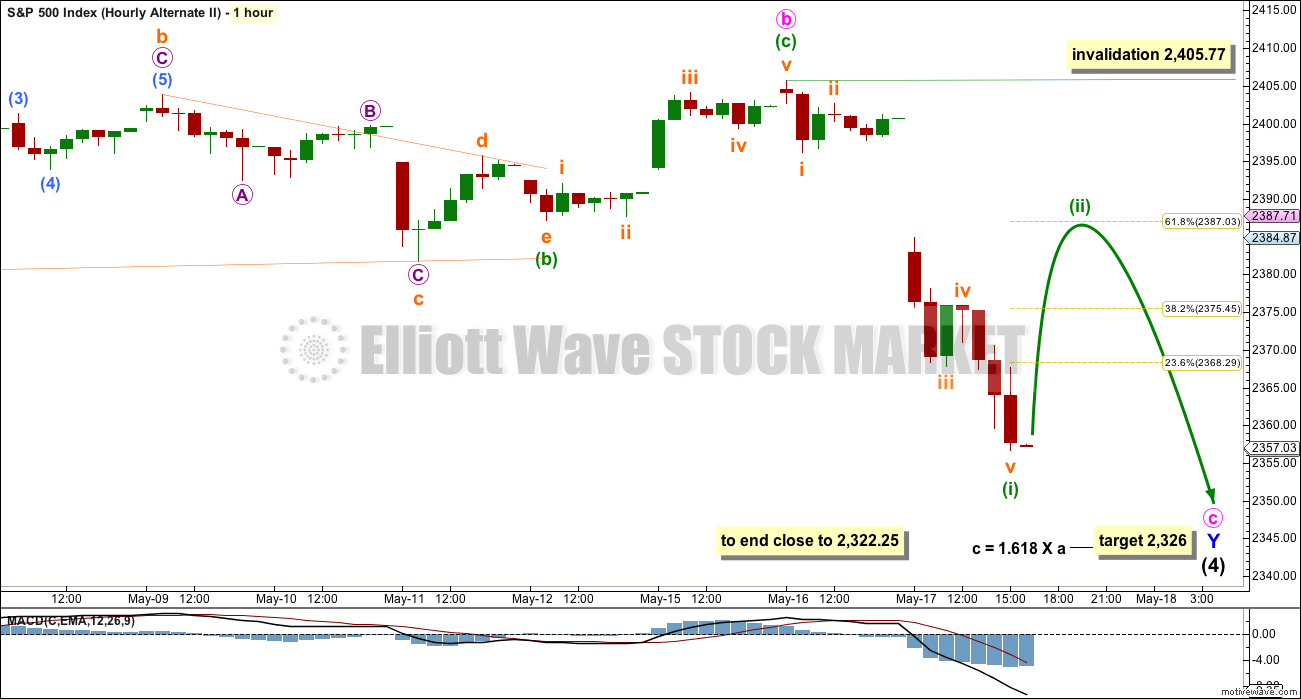
Click chart to enlarge.
Minute wave b is longer than the common range of up to 1.38 times the length of minute wave a, but still within allowable limits of up to 2. Minute wave b is a 1.55 length of minute wave a.
However, I have seen plenty of expanded flat corrections with B waves longer than 1.38 times the length of their A waves. This wave count remains entirely acceptable.
Minute wave c would be very likely to end at least slightly below the end of minute wave a at 2,328.95 to avoid a truncation and a very rare running flat.
The target is checked and today recalculated. The new target today would see minor wave Y end very close to the same level as minor wave W, within 4 points. The whole of intermediate wave (4) would have a big sideways look, typical of combinations.
There may be a five down complete today. This may be followed by a three up that may reach up to the 0.382 Fibonacci ratio, or slightly more likely the 0.618 Fibonacci ratio.
TECHNICAL ANALYSIS
WEEKLY CHART
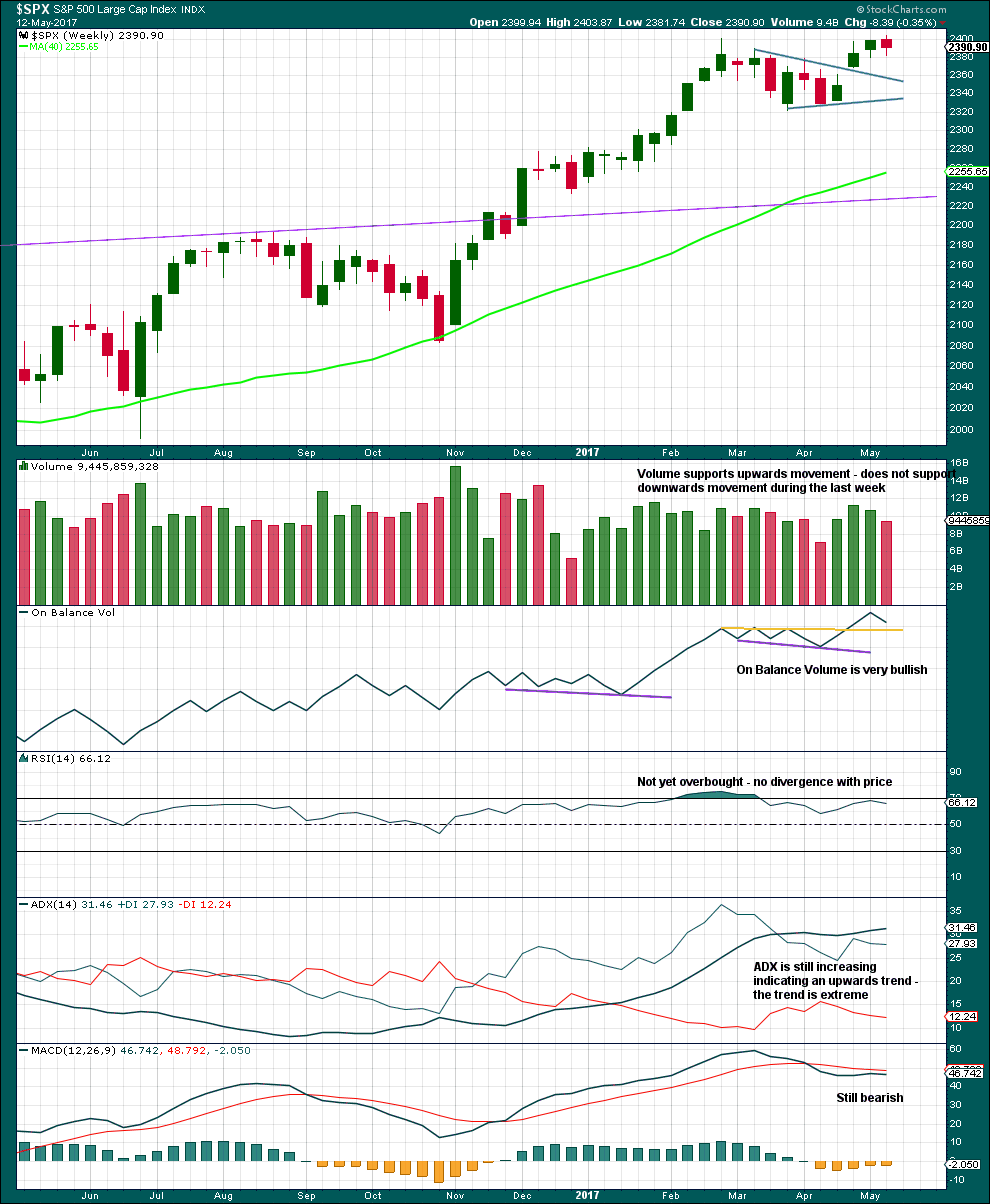
Click chart to enlarge. Chart courtesy of StockCharts.com.
An upwards week is completed but closes red. The balance of volume is down and it shows a decline. Downwards movement during the week did not have support from volume. This looks like a pullback within a larger upwards trend.
ADX is extreme and nearing very extreme. A bigger consolidation or deeper pullback should be expected.
Within this bull market, beginning in March 2009, this has happened at the weekly chart level on four occasions: January 2010, the end of February 2011, early June 2013, and late July 2014. On each occasion it was immediately followed by three to four weeks of downwards movement.
DAILY CHART

Click chart to enlarge. Chart courtesy of StockCharts.com.
Today’s strong downwards day closes the two gaps up from the large symmetrical triangle.
Price may now find some support about the upper edge of the triangle structure, and about 2,350 which was a prior area of support and resistance.
Volume is bearish, ADX is slightly bearish, and MACD today is bearish.
Neither RSI nor Stochastics are oversold. There is room for price to fall further if it can overcome support.
However, there may be strong enough support from On Balance Volume today to halt the fall in price. Look most likely for a bounce tomorrow.
VOLATILITY – INVERTED VIX CHART
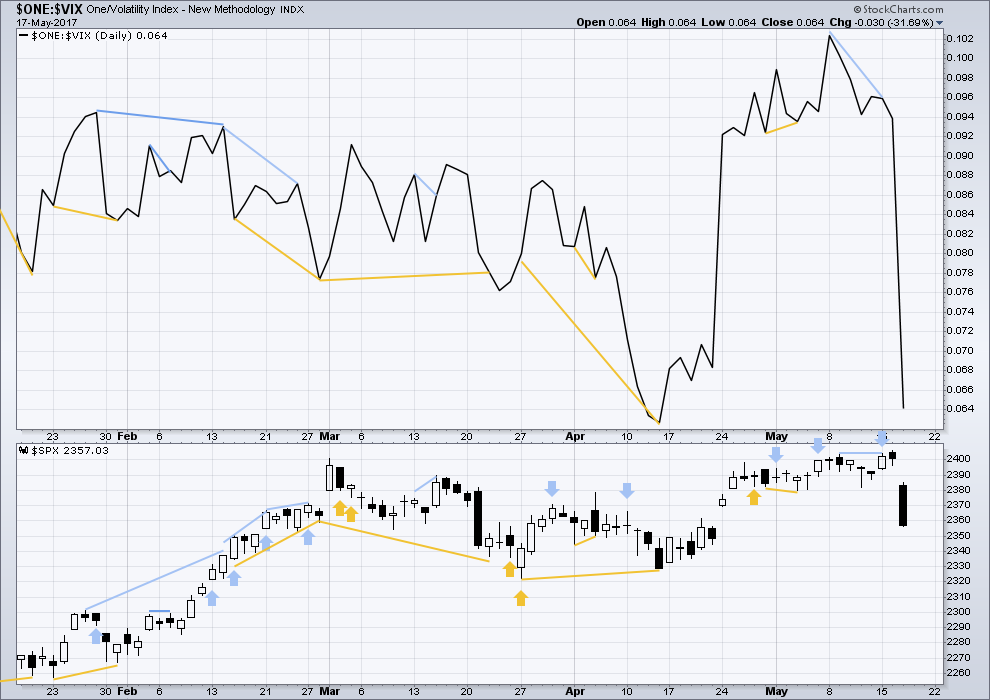
Click chart to enlarge. Chart courtesy of StockCharts.com.
Normally, volatility should decline as price moves higher and increase as price moves lower. This means that normally inverted VIX should move in the same direction as price.
It is noted that there are now six multi day instances of bullish divergence between price and inverted VIX, and all have been followed so far by at least one upwards day if not more. This signal seems to again be working more often than not. It will again be given some weight in analysis.
No new divergence is noted today.
BREADTH – AD LINE
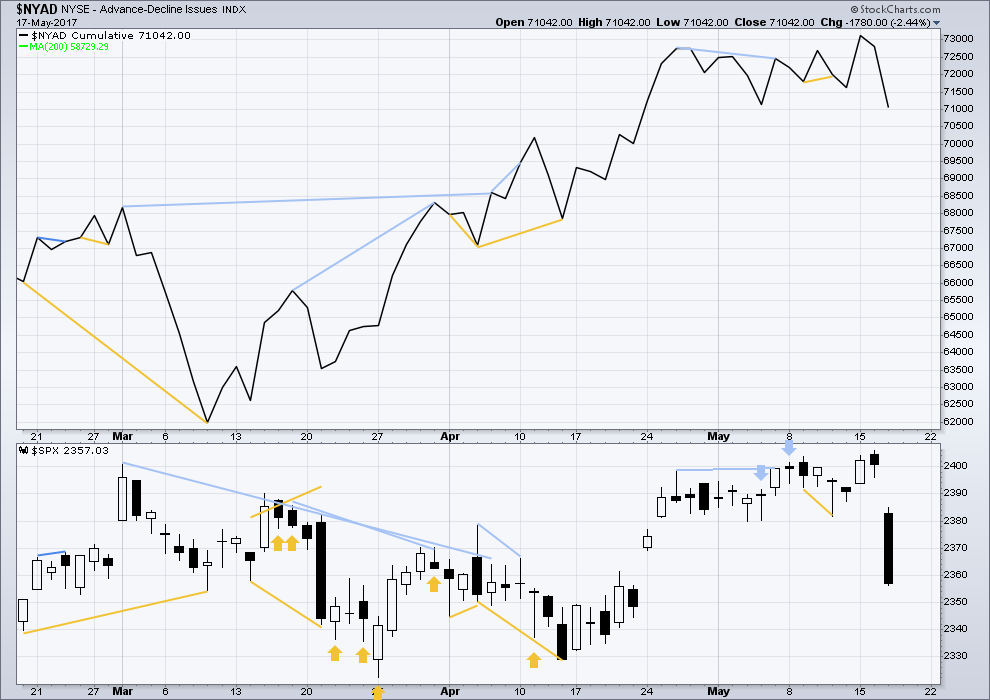
Click chart to enlarge. Chart courtesy of StockCharts.com.
There is no new divergence between price and breadth today. Price has made new lows below the last swing low of the 3rd and 4th of May, and the AD line has also made a very slight new low. The fall in price today had support from a decline in market breadth.
DOW THEORY
The DJIA, DJT, S&P500 and Nasdaq continue to make new all time highs. This confirms a bull market continues.
The following lows need to be exceeded for Dow Theory to confirm the end of the bull market and a change to a bear market:
DJIA: 17,883.56.
DJT: 7,029.41.
S&P500: 2,083.79.
Nasdaq: 5,034.41.
Charts showing each prior major swing low used for Dow Theory are here.
This analysis is published @ 11:33 p.m. EST.
Will publish this analysis early today, quite soon. May have to update volume analysis later today when StockCharts have it available.
I’m off to try and find Tom the Kiwi today, third time lucky!
And StockCharts have volume data already! Thanks StockCharts
Hourly chart, main count, still preferred, now with an invalidation point and target
Price now has resistance at the gap from yesterday’s open to overcome.
Very deep oversold bounce folks. I could be wrong, but I am not convinced we are done. Let’s see how VIX closes the day. It is being sold with a vengeance.
It took awhile bit filled on that bearish call credit spread @0.75
*YAWN*
I am not sure why the VIX short sellers have not yet figured out they traded a counter-trend move. We should get spike into the green before long. Must be sleepy bots…
The second waves in the decline so far are slow, languid, and apparently designed to put one to sleep….and then… KAPOW!!
Is that what we have gong on here?? 🙂
Getting a bit long for a small fourth wave methinks. Possibly a second wave underway?
I stubbornly held onto five UVXY 15.00 strike call expiring tomorrow. Sometimes the final move above the BB of this animal can be the most explosive. Let’s see if we can clear 16.00 today for a double…
This move up clearly corrective. The down-trend should resume. Waiting for VIX confirmation.
I suspect those eager beavers are about to get the royal squeeze…
I am watching the 100 day MA. A continuation of the bearish case requires a clean break below and DJI is much close so will probably lead the way.
I am selling the SPY May week 4 238/240 call credit spread for 0.75 while I wait…
Credit spreads used to get filled fairly quickly mid-point between the bid and ask. Now they are making you wait so I won’t chase. More people must be selling them these days.
Keeping a close eye on the Yen. Kuroda just might have had enough…
The algos are all now very adept at wrecking positional and directional trades in this freakish market. I just don’t see how anyone can stay ahead of them unless you are a merciless scalper, or selling credit spreads. It is nuts!
At this point, I am almost a straight scalper. These moves are mind boggling.
Yep. More than 60% of market volume are trading bots. It’s a minefield.
One thing is for sure. If the early VIX short sellers are on the wrong side of the trade they will know that well before the close…and so will we….a green print means they were forced to cover….and we are not quite done…
VIX sold very hard at this morning’s high. Someone is supremely confident the move down is done.
See! Never any material waves Lower… Never!
Always, Hang Out… then move materially higher. Hang Out again…. then move materially higher again! On a 21K DJIA a 400 point move is a spec of sand on a beach!
ZERO Risk of a Material Sustained move Lower. Buy and Hold Works! Nobody at all in this market is concerned about losing a dime!
That, my friend, is what terrifies me. Mr. Market can always oblige and follow up with a 1000 point DJI decline for those still unconvinced…the question is…will he?
This could still be a fourth wave with another sharp fifth down on deck, and a bigger third later waiting to really spank some of this giddiness out of the bulls. 🙂
1000 point move on a 21K DJIA is 2 1/2 specs of sand on a beach.
It’s not a material move!
Yen pairs trade re-ignited. Let’s see if BOJ steps in and sends the short sellers scurrying.
We do not have five up off the lows as yet…stand by…
What have I been saying about directional trades in this market?
Looks like we may have yet another one session wonder. One has to stay sharp…very sharp indeed!
SPX 4 hour chart shows perfect return to top trendline of recent wave 4 triangle (1 degree lower). Will it hold?
Worth watching very carefully. Price sliced through the 50 day but stopped right at 100 dma. That generally confirms uptrend intact and about to resume. We should know by the close.
ES looks like it could be tracing out some sort of combination for a possible second wave or may be a double Zig Zag. If that is the case we still have an even harder fall ahead.
As hard as it is to believe, there is still active short selling of volatility! Futures have been in the red from the outset and yet we have seen pre-market prints of VIX in the red. It will be interesting to see what the Yen does to day. Not sure if it’s the eager beaver BTFD crowd jumping the gun, or an on-going attempt to suppress volatility in a pairs trade. Either way, it suggests that despite the fat green candle printed yesterday, we have not seen anything remotely like capitulation. It will be interesting to see if this move down once again ends without any significant volatility spike that generally accompanies capitulation. If that does not happen it means that the massively short vol positions not only were not unwound to any significant degree, but actually probably increased and we could see SVXY head back up to the 150 region. Not that I am complaining…in fact I hope it does! 🙂
Lara,
my FXCM charts (futures, not cash I think) is showing a high on 5 May @ 2407 and therefore according to this count we could be in a wave 3 down.
NYSE A/D ratio was only about 5:1 in favor of declining volume during yesterday’s sell-off. That may have only been the first wave down as third waves for intermediate degree declines typically register 10:1
Wave counts for futures will be a bit different to cash.
I’m analysing cash because the leverage is (supposedly) less extreme, so it should adhere better to EW rules.
I know this may not be a popular statement, but it doesn’t matter to the wave count for the cash market if futures have slightly different highs and lows.
Foist!