
A strong whipsaw moved below the short term invalidation point on the hourly Elliott wave count. However, downwards movement was quickly retraced and today’s candlestick looks very bullish.
Summary: There is enough bullishness in the daily technical analysis to expect a green daily candlestick tomorrow. The main wave count will still expect a third wave up within a fifth wave. The target remains at 2,469.
Always remember my two Golden Rules for trading:
1. Always use a stop.
2. Invest only 1-5% of equity on any one trade.
New updates to this analysis are in bold.
Last monthly and weekly charts are here. Last historic analysis video is here.
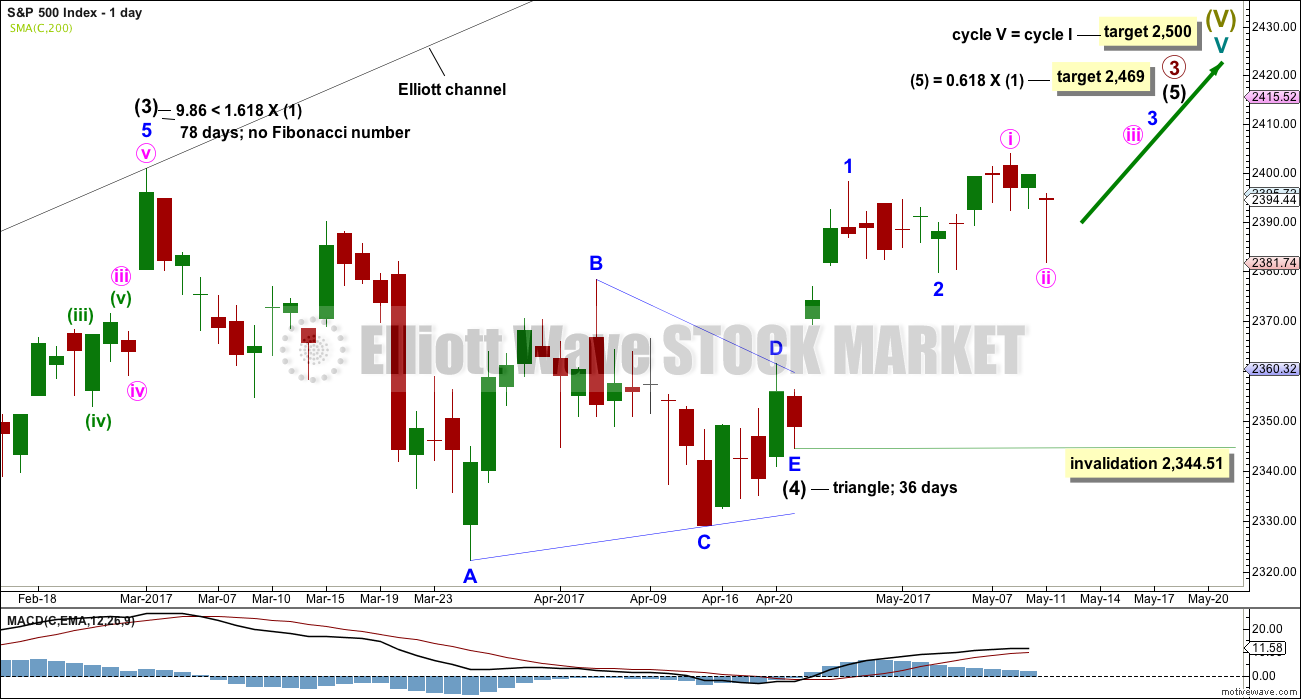
MAIN ELLIOTT WAVE COUNT
WEEKLY CHART

Click chart to enlarge.
This wave count sees the middle of primary wave 3 a stretched out extension, which is the most typical scenario for this market.
Primary wave 3 may be incomplete. A target is now calculated for it on the daily chart.
There is alternation within primary wave 3 impulse, between the double zigzag of intermediate wave (2) and the possible triangle or combination of intermediate wave (4).
When primary wave 3 is a complete impulse, then a large correction would be expected for primary wave 4. This may be shallow.
Thereafter, primary wave 5 may be expected to be relatively short, ending about the final target at 2,500.
It is also still possible that primary wave 3 was over at the high labelled intermediate wave (3) (this idea has been published previously) and that would mean that price should currently be within primary wave 4. This idea does not at this stage diverge in terms of expected direction or structure from the daily alternate wave count below, so for clarity and to keep the number of charts manageable it will not be published on a daily basis. I will follow the idea and will again publish it when it begins to diverge from the main wave count.
DAILY CHART
Click chart to enlarge.
Intermediate wave (4) may be a complete regular contracting triangle. It may have come to a surprisingly swift end with a very brief E wave.
There is already a Fibonacci ratio between intermediate waves (3) and (1). This makes it a little less likely that intermediate wave (5) will exhibit a Fibonacci ratio to either of intermediate waves (1) or (3); the S&P often exhibits a Fibonacci ratio between two of its three actionary waves but does not between all three.
Within intermediate wave (5), minor waves 1 and now 2 look to be complete.
Within minor wave 3, no second wave correction may move beyond its start below 2,379.75. However, a new alternate idea below at the hourly chart level looks at the possibility that minor wave 2 may not be over and may continue lower. This idea has an invalidation point at the start of minor wave 1 at 2,344.51.
The structure of intermediate wave (5) on the daily chart does not look complete. So far it looks like a possible three up. Minor wave 3 still needs to complete, then minor waves 4 and 5. This may last another couple of weeks at least.
HOURLY CHART
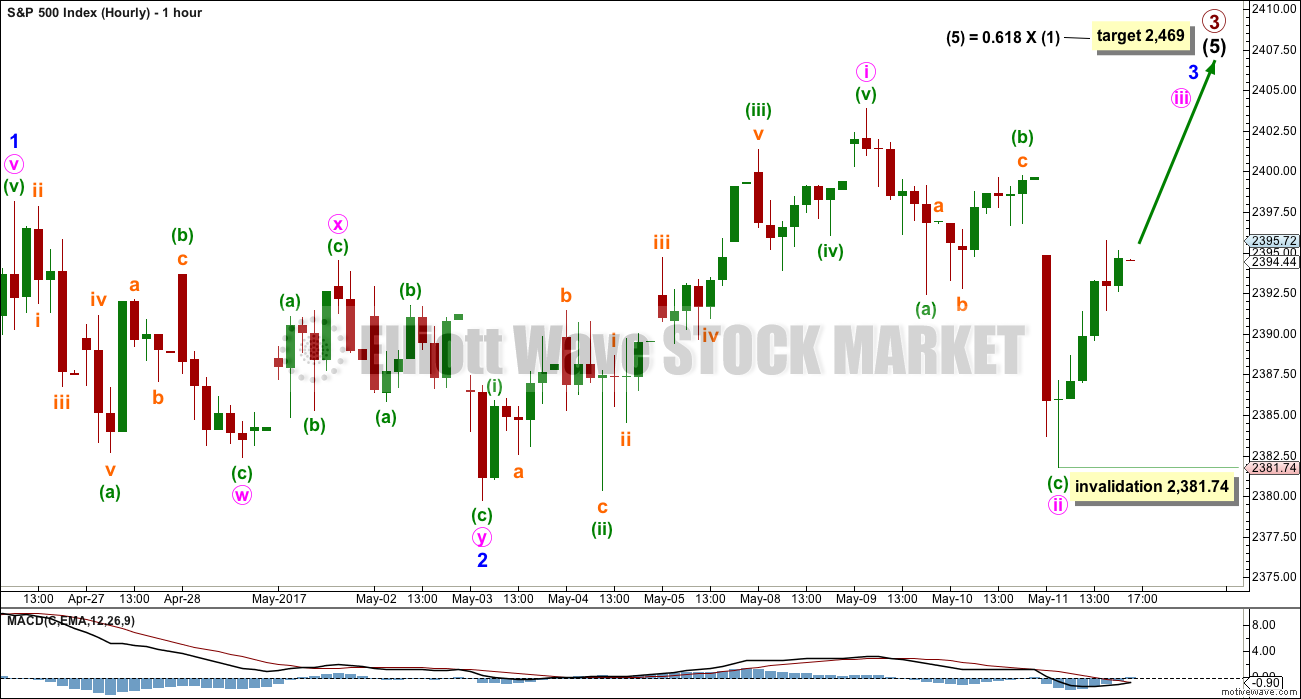
Click chart to enlarge.
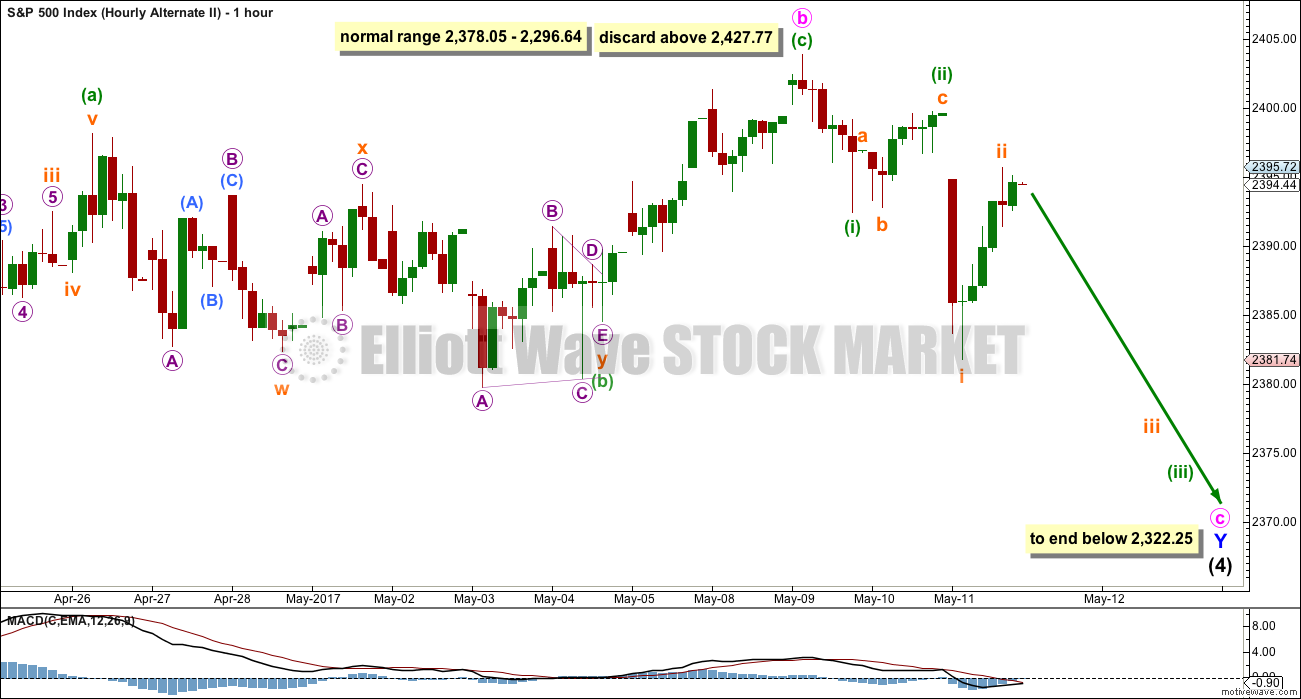
Minor wave 2 may have completed as a double zigzag.
The strong downwards whipsaw during Thursday’s session may have been minute wave ii moving lower as a deep zigzag. It does not fit within a base channel drawn about minor waves 1 and 2 and for this reason the alternate below is published.
This main wave count still expects to see an increase in upwards momentum over the next few days.
Within minute wave iii, no second wave correction may move beyond the start of its first wave below 2,381.74.
ALTERNATE HOURLY CHART
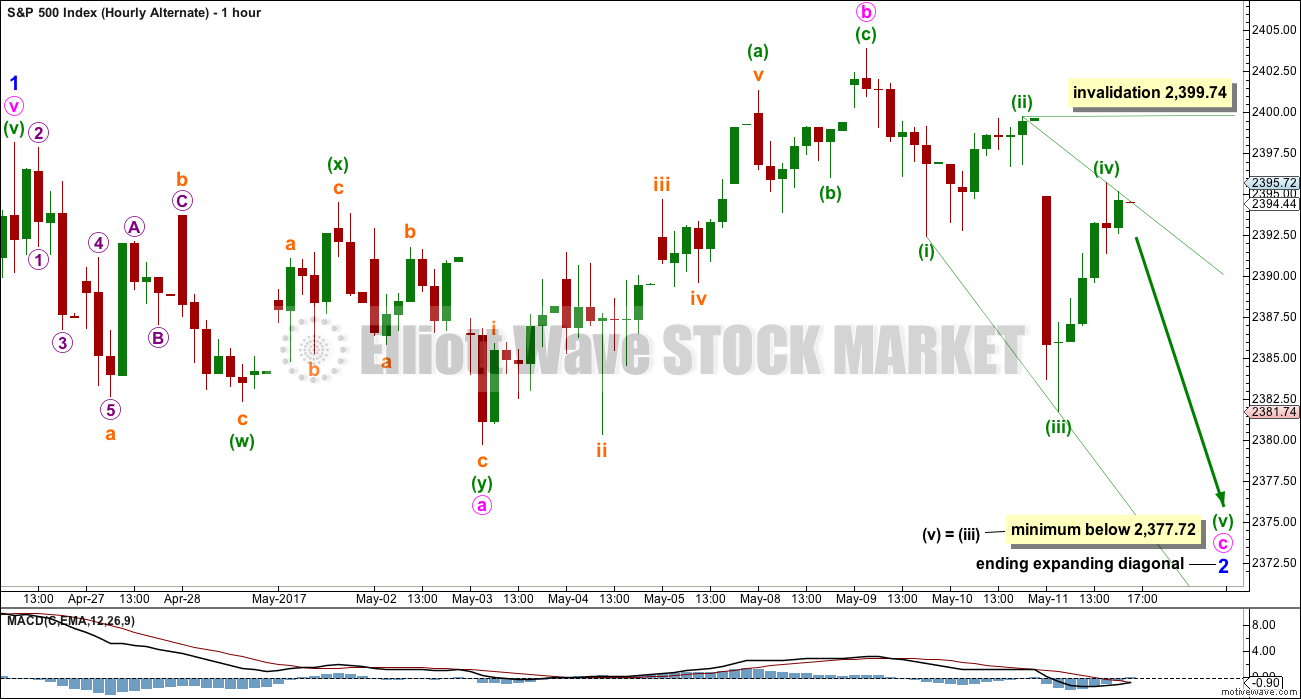
Click chart to enlarge.
It is also possible that minor wave 2 is continuing further as an expanded flat correction. The upwards wave here labelled minute wave b will fit as either a five wave impulse (main wave count) or three wave zigzag (this alternate). Both possibilities are considered.
If minor wave 2 is incomplete, then within it minute wave b is a 1.31 length of minute wave a, within the normal range of 1 to 1.38.
Minute wave c looks like a diagonal with the strong overlapping. The diagonal would be expanding, giving a minimum requirement for the fifth wave to meet rules regarding wave lengths for expanding diagonals.
The minimum requirement for minuette wave (v) would also take minute wave c below the end of minute wave a at 2,379.75, avoiding a truncation and a very rare running flat.
ALTERNATE DAILY CHART
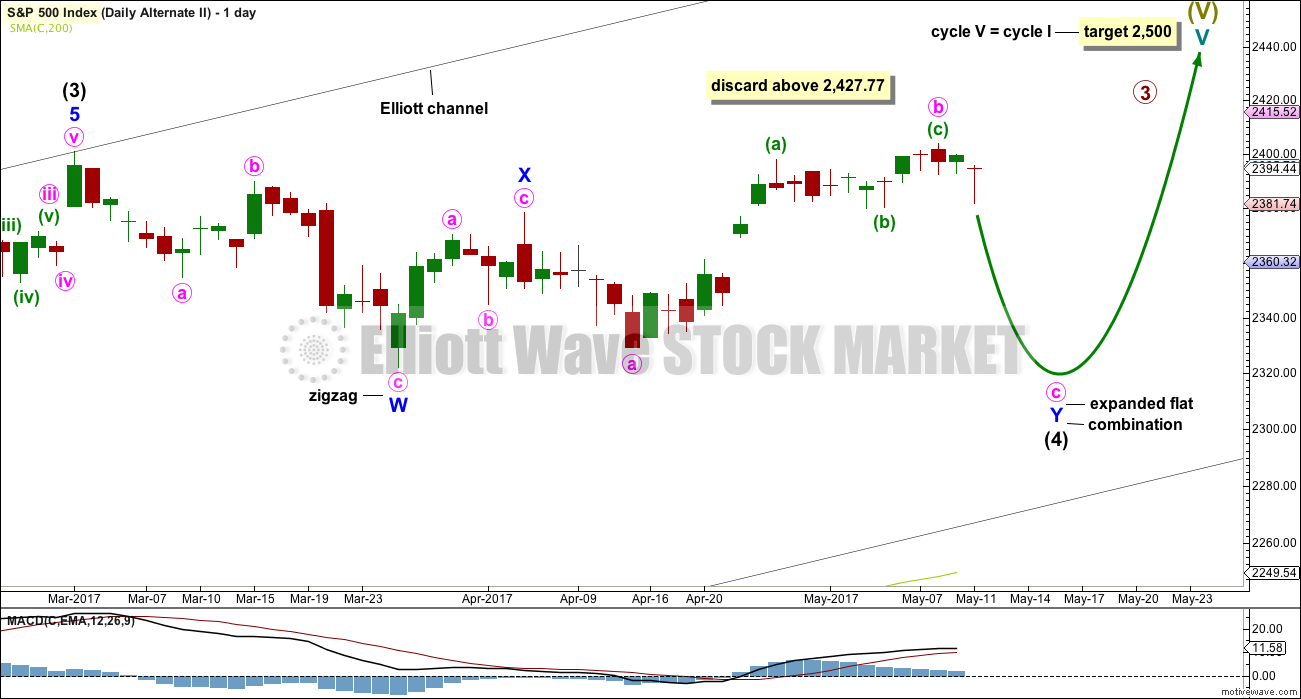
Click chart to enlarge.
What if intermediate wave (4) was not a complete triangle but is still unfolding as a double combination? The subdivisions of this wave count would be labeled in the same way, with the exception of the degree of labelling, if the correction were to be primary wave 4.
Double combinations are very common structures. This would still provide perfect alternation in structure with the double zigzag of intermediate wave (2). Although double zigzags and double combinations are both labelled W-X-Y, they are very different structures and belong to different groups of corrections.
The purpose of combinations is the same as triangles, to take up time and move price sideways. Intermediate wave (2) lasted 58 days. So far intermediate wave (4) has lasted 50 days. If it continues for another one to two weeks, it would still have excellent proportion with intermediate wave (2).
This alternate wave count now has some support from classic technical analysis, particularly extreme ADX at the weekly chart level. Although price suffered a quick reversal today, the reversal was almost fully retraced and is not convincing. There is enough bullishness at the end of this session for this wave count to remain an alternate.
ALTERNATE HOURLY CHART
Click chart to enlarge.
Minute wave b is now a 1.52 length of minute wave a. This is longer than the common range of up to 1.38, but still within allowable limits of up to 2. The higher minute wave b goes the lower the probability that this wave count is correct.
However, I have seen plenty of expanded flat corrections with B waves longer than 1.38 times the length of their A waves. This wave count remains entirely acceptable.
If minute wave c continues, then so far it would have two overlapping first and second waves. This wave count now expects to see an increase in downwards momentum tomorrow.
TECHNICAL ANALYSIS
WEEKLY CHART
Click chart to enlarge. Chart courtesy of StockCharts.com.
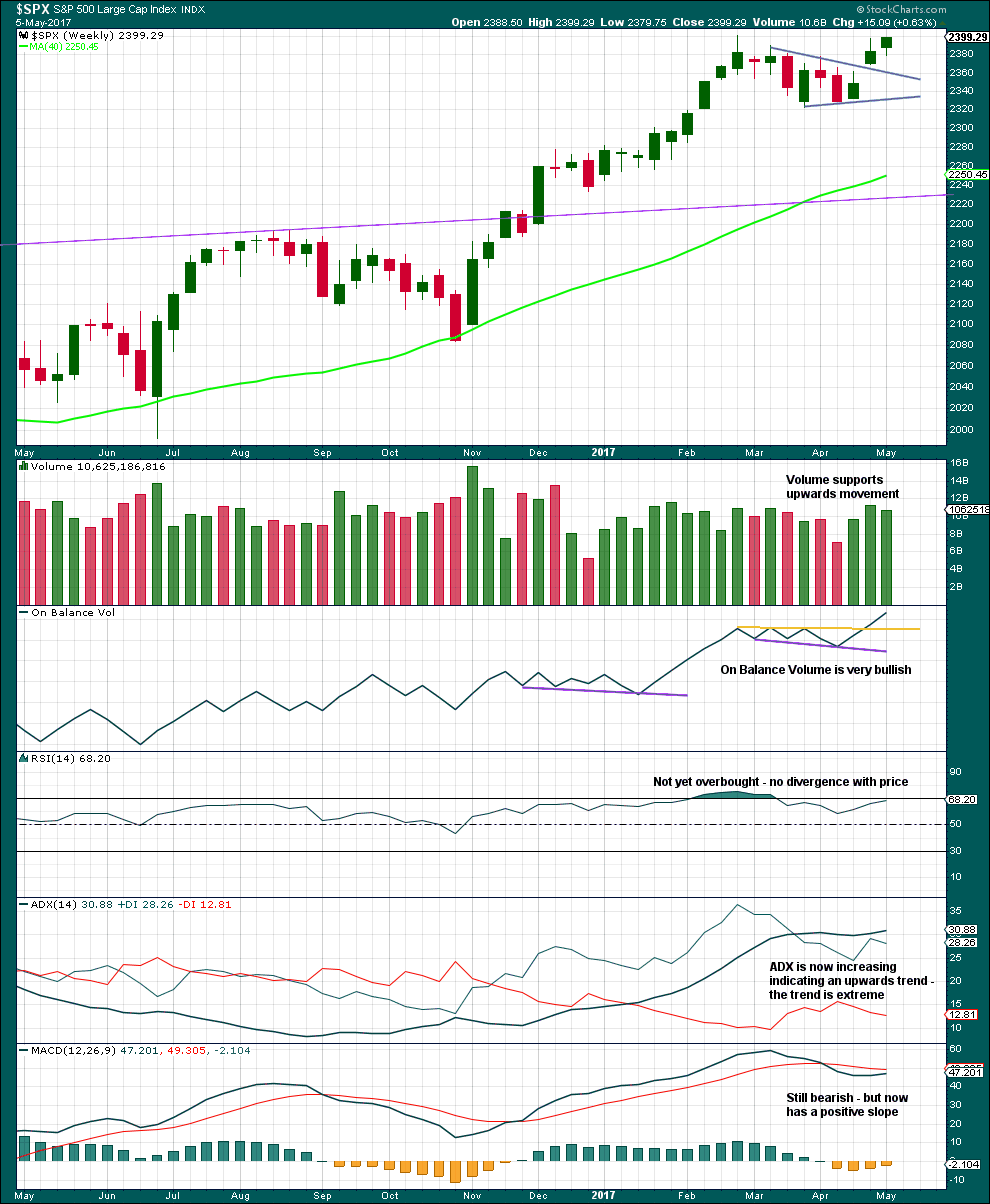
Volume for the last three upwards weeks is all stronger than the two downwards weeks prior. There is more support for upwards movement than downwards. This is bullish.
The only concern here is ADX is extreme. Within this bull market, beginning in March 2009, this has happened at the weekly chart level on four occasions: January 2010, the end of February 2011, early June 2013, and late July 2014. On each occasion it was immediately followed by three to four weeks of downwards movement.
Extreme ADX at the weekly chart level supports the alternate Elliott wave count.
Very bullish On Balance Volume supports the main Elliott wave count.
DAILY CHART
Click chart to enlarge. Chart courtesy of StockCharts.com.
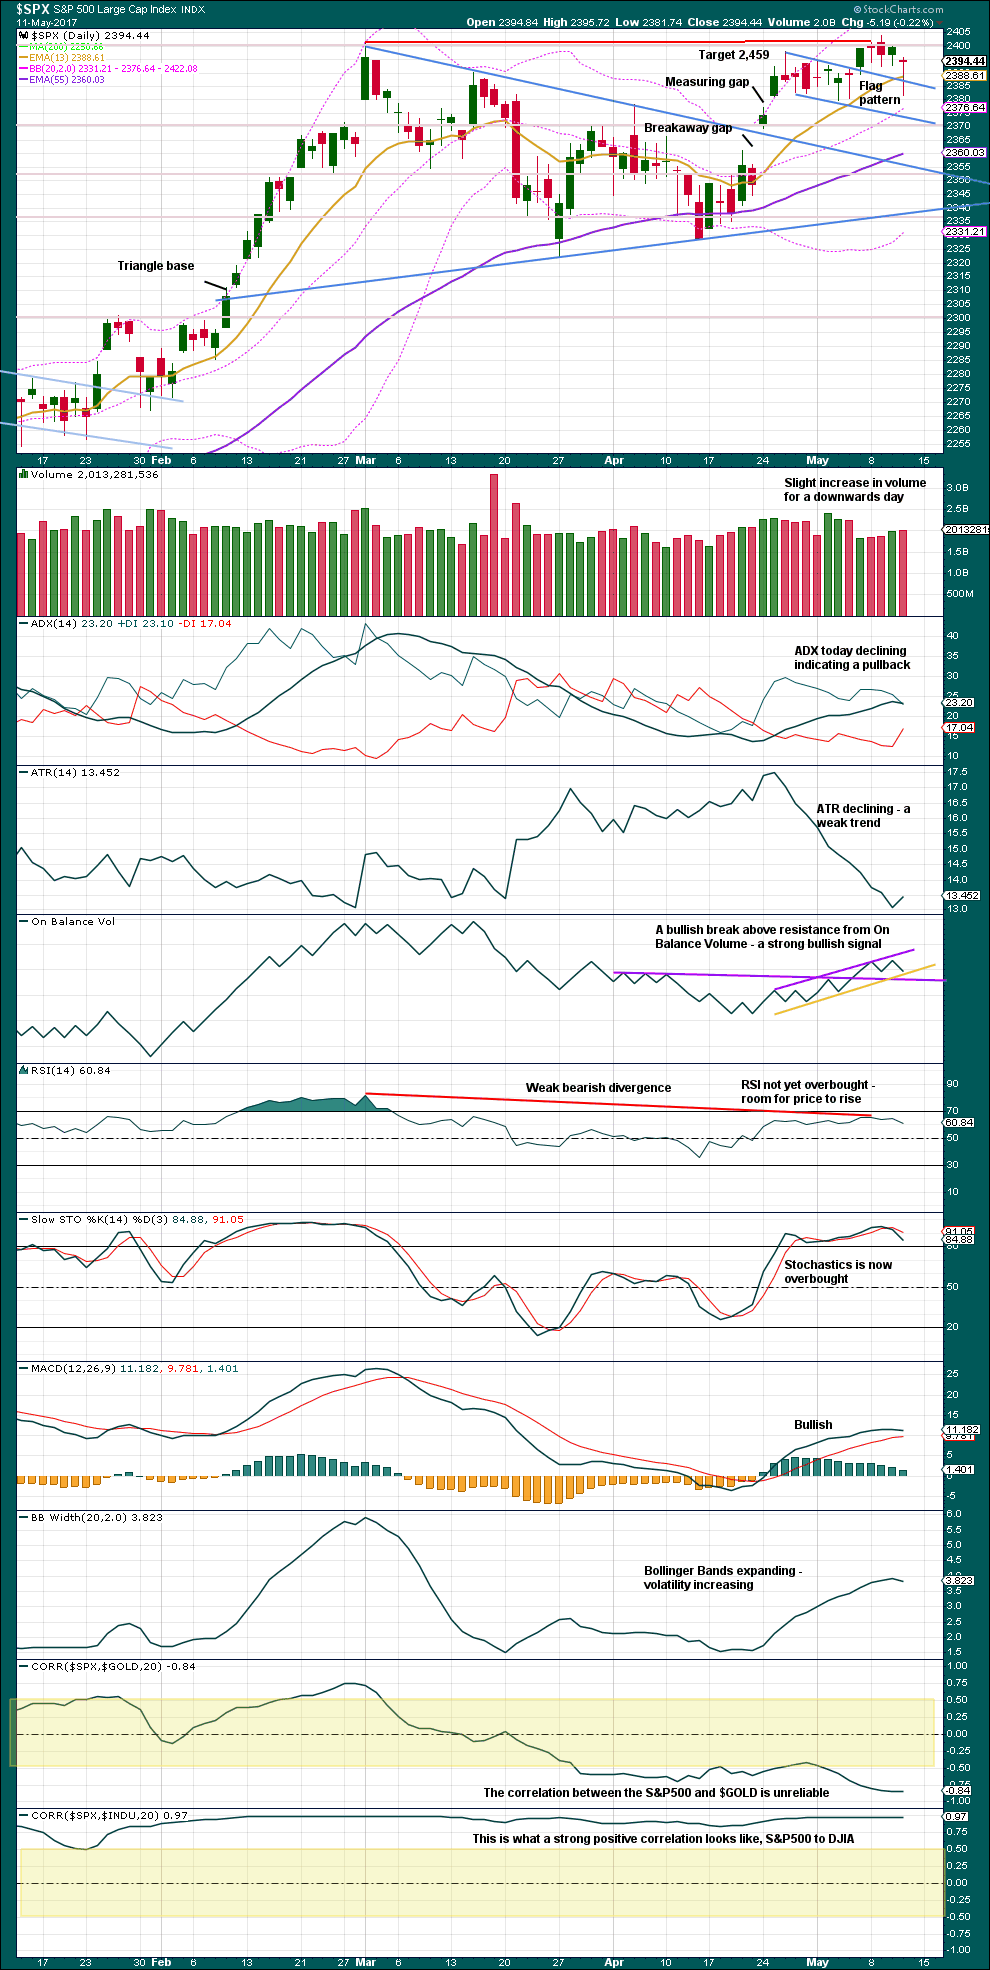
The long lower wicks on the last four daily candlesticks are bullish. The very long lower wick on today’s candlestick is very bullish indeed.
The measuring gap before the flag pattern remains open. This area has been tested several times and continues to provide strong support. Each test reinforces strength of support there, so it is reasonable now to expect this support to hold.
A very slight increase in volume for a downwards day is slightly bearish. Volume is still relatively light though.
A new resistance line is added today to On Balance Volume, which remains bullish, so it now constrained between resistance and support.
Overall, there is enough bullishness in this chart to expect upwards movement from here.
VOLATILITY – INVERTED VIX CHART
Click chart to enlarge. Chart courtesy of StockCharts.com.
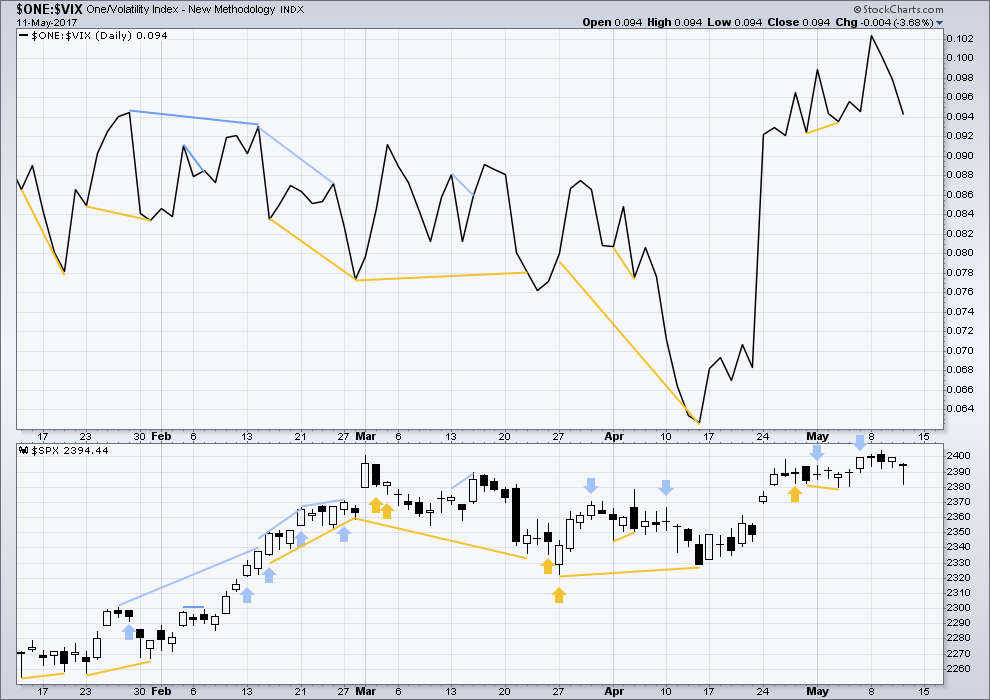
Normally, volatility should decline as price moves higher and increase as price moves lower. This means that normally inverted VIX should move in the same direction as price.
It is noted that there are now six multi day instances of bullish divergence between price and inverted VIX, and all have been followed so far by at least one upwards day if not more. This signal seems to again be working more often than not. It will again be given some weight in analysis.
There is no new divergence between price and inverted VIX today.
BREADTH – AD LINE
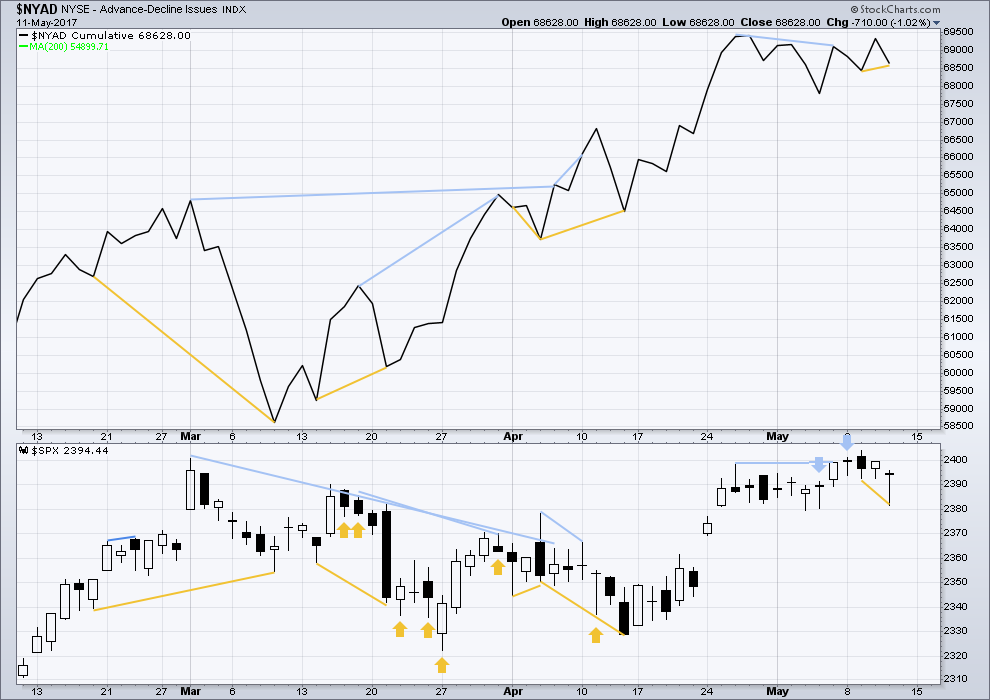
Click chart to enlarge. Chart courtesy of StockCharts.com.
There is short term bullish divergence today between price and the AD line: price has made a lower low, but the AD line has made a higher low. This indicates weakness in price and supports the main hourly Elliott wave count. This short term divergence has been working more often than not recently, so it is given some weight in this analysis.
DOW THEORY
The DJIA, DJT, S&P500 and Nasdaq continue to make new all time highs. This confirms a bull market continues.
The following lows need to be exceeded for Dow Theory to confirm the end of the bull market and a change to a bear market:
DJIA: 17,883.56.
DJT: 7,029.41.
S&P500: 2,083.79.
Nasdaq: 5,034.41.
Charts showing each prior major swing low used for Dow Theory are here.
This analysis is published @ 10:35 p.m. EST.
Anyone here still a subscriber of EWI… Theorist and Financial Forecast?
I cancelled my subscriptions a few months back after years of receiving it.
Today I received a marketing email from them with a testimonial on Robert Prechter’s May Issue which was Published May 9th… saying… “”WOW! I MEAN WOW! I was going to write a longer review of the May Theorist. But I resisted. This publication is genius. This issue will probably be viewed for hundreds of years to come as the most relevant insight into the internet and related human behavior. ”
Anyone know what they are all Giddy about over there at EWI on the MAY Issue of Theorist and Financial Forecast? I refuse to give them any more of my money.
Thanks, Joe
I’m also curious. That sounds interesting.
I must admit, they really are very good at the sales and marketing. I wish I could get some of that happening… but I just can’t do that spin…. makes me dizzy 🙂
I also canceled a few months back. Peter Kimble calls them Elliot Wave Incompetent. Frankly, after years and years of watching them get market calls so horribly wrong I can’t imagine anything thing they have to say at this point would much interest me. I think Rodney still gets the publication so maybe he can weigh in on what the hoopla is all about.
Sorry I cannot offer any insight. I have not received anything from EWI in years.
Let’s see how this week affects the weekly ADX. It’s just not going to be enough though to bring the ADX line back below the +DX line. All it may do is see the ADX line turn to have a negative slope, which would indicate a larger correction and support the alternate.
There’s now a gap below offering a strong floor of support about 2,377.
Now a little gap above…. another consolidation to move sideways? To relieve the extreme ADX reading?
A small triangle forming? Could be a B wave. Another small range yawn inducing sideways day.
Another stalemate today. I am on the sidelines until we get some confirmation.
Have a great weekend all!
Looking to me like the bulls are going to get mauled…a move below 2381.74 and it’s gonna get ugly….
SHHH, she can hear you Verne…..:)
Oh yeah! I forgot; she is always listening isn’t she? 🙂
She listens. But does not obey 🙂
Gap down portends market weakness. They need to fill it quickly or there will be a rout…above 2394.44
The can’t use the Yen to pump the market as pre-market it is up. They are now focused on shorting vol once again to prod the bots to buy; let see how that works for ’em….if VIX goes green early it will really limit their options. Nothing left in the precious metals short side trade it would appear….
The attempt to fill yesterday’s gap managed to penetrate the gap area but not fill it. That could be bearish in that it means diminihing returns to CB pumping. They also failed to drive VIX into negative territory but not for lack of trying, as the long upper wick attests. I think we could see another shatp drop and labored retrace as the tug of war continues…
They’ve been in there the last hour, holding up the roll from the retail sales miss. Disgusting to say the least, but I agree, their power is diminishing. Equity fund out flows were just 22 billion; not sure what would be needed to over power them, as that number is not small.
Ralph Lauren is closing his flag-ship on Fifth Avenue…! Wow!
I held on to my longs today. One day at a time. The bullish case still presents itself. But my patience is wearing thin on this one.
ditto
hee hee,, I got dat darn wabbit
No ya didn”t…I just wanted to be turd, see?