
A new all time high was expected from last analysis.
The Elliott wave count remains the same and the weekly technical analysis still sounds a strong warning.
Summary: The upwards trend has most likely resumed, but a strong warning from ADX at the weekly chart level means members should keep stops on long positions tight and be prepared to take profits more quickly than usual. Stops may be set just below 2,389.38 at this time. The profit target remains at 2,469.
Always remember my two Golden Rules for trading:
1. Always use a stop.
2. Invest only 1-5% of equity on any one trade.
New updates to this analysis are in bold.
Last monthly and weekly charts are here. Last historic analysis video is here.
MAIN ELLIOTT WAVE COUNT
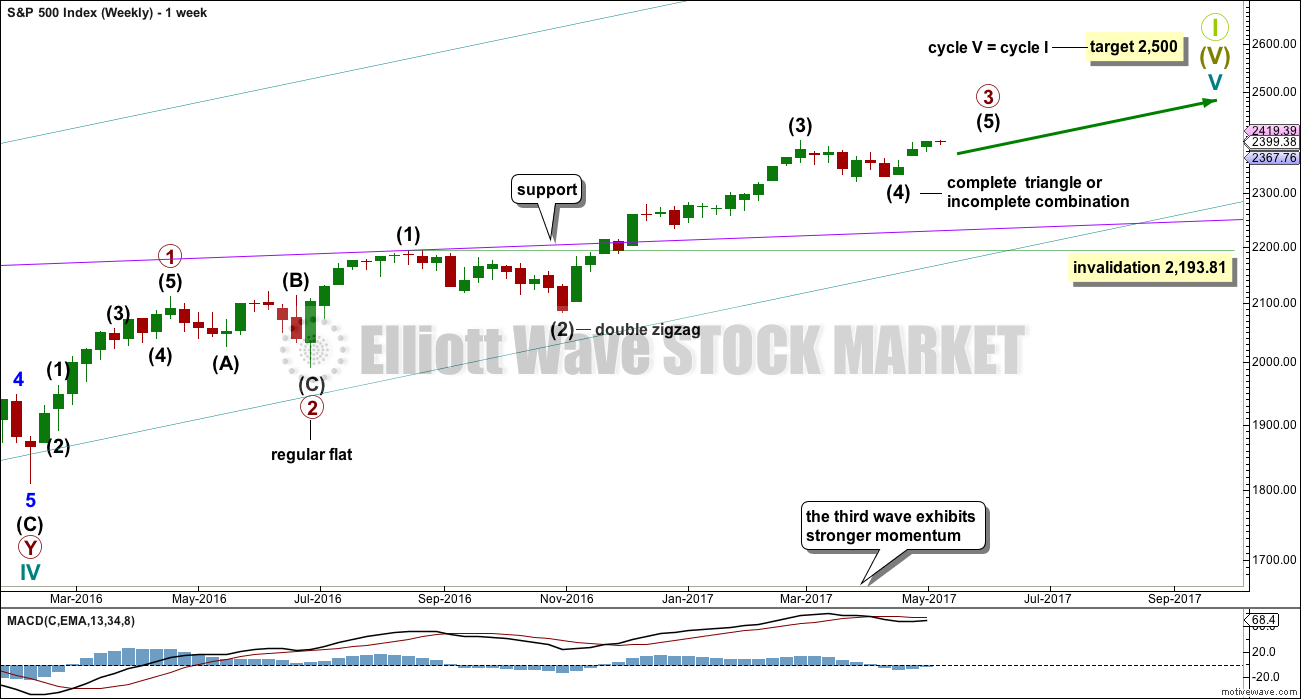
WEEKLY CHART
Click chart to enlarge.
This wave count sees the middle of primary wave 3 a stretched out extension, which is the most typical scenario for this market.
Primary wave 3 may be incomplete. A target is now calculated for it on the daily chart.
There is alternation within primary wave 3 impulse, between the double zigzag of intermediate wave (2) and the possible triangle or combination of intermediate wave (4).
When primary wave 3 is a complete impulse, then a large correction would be expected for primary wave 4. This may be shallow.
Thereafter, primary wave 5 may be expected to be relatively short, ending about the final target at 2,500.
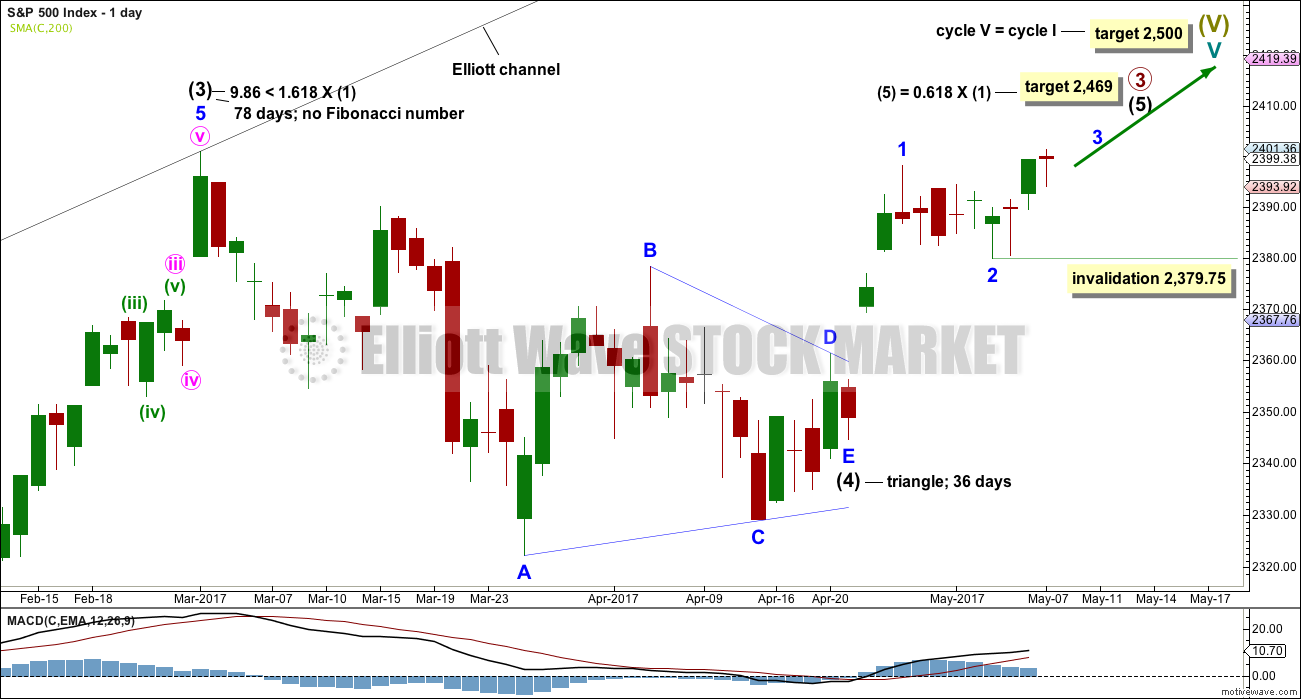
DAILY CHART
Click chart to enlarge.
Primary wave (4) may be a complete regular contracting triangle. It may have come to a surprisingly swift end with a very brief E wave.
There is already a Fibonacci ratio between intermediate waves (3) and (1). This makes it a little less likely that intermediate wave (5) will exhibit a Fibonacci ratio to either of intermediate waves (1) or (3); the S&P often exhibits a Fibonacci ratio between two of its three actionary waves but does not between all three.
Within intermediate wave (5), minor waves 1 and now 2 look to be complete.
Within minor wave 3, no second wave correction may move beyond its start below 2,379.75.
With a new all time high at the open of today’s session, it may be possible that primary wave 3 could be over. However, the structure would only look right if the start of intermediate wave (5) was lower down. To see intermediate wave (4) ending earlier would mean the triangle trend lines would look wrong.
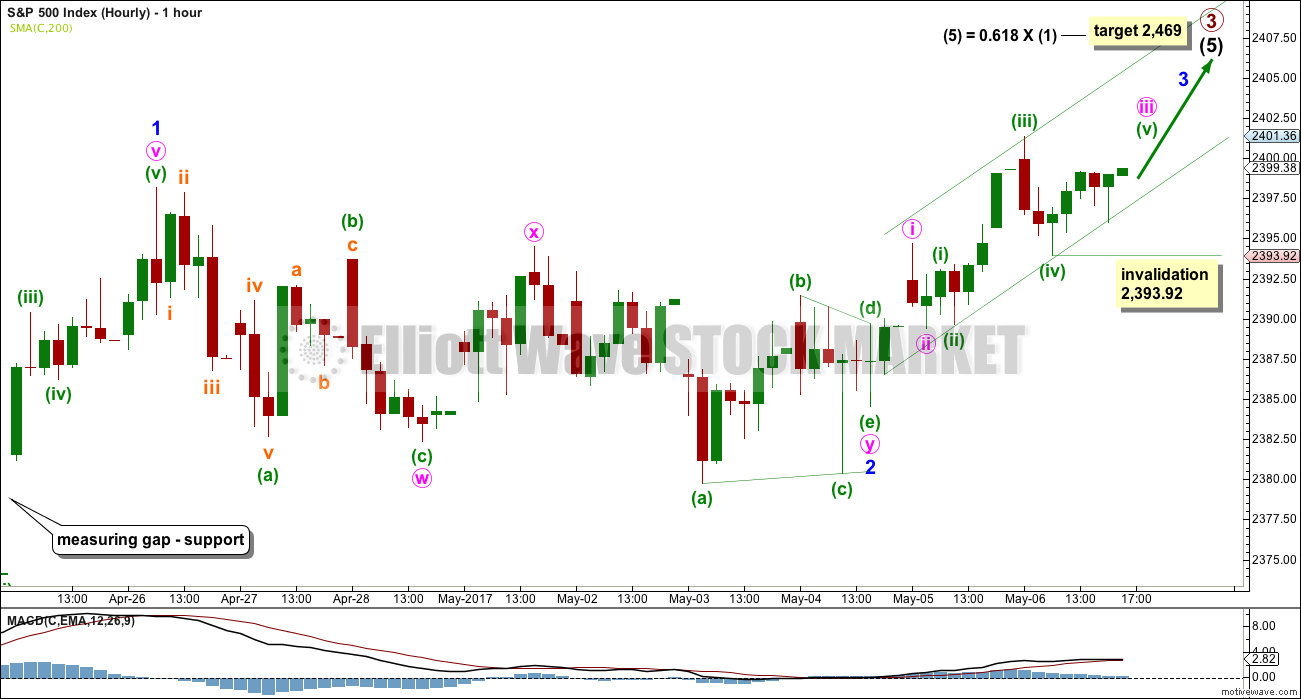
HOURLY CHART
Click chart to enlarge.
Minor wave 2 may have competed as a double combination: zigzag – X – triangle.
So far minute waves i and ii may be complete within minor wave 3. Minute wave iii may only subdivide as an impulse. So far within minute wave iii, minuette waves (i) through to (iv) may be complete. Within minuette wave (v), no second wave correction may move beyond the start of its first wave below 2,393.92.
A best fit channel is drawn about this upwards movement. It may continue to show where price finds support and resistance along the way up as minor wave 3 completes.
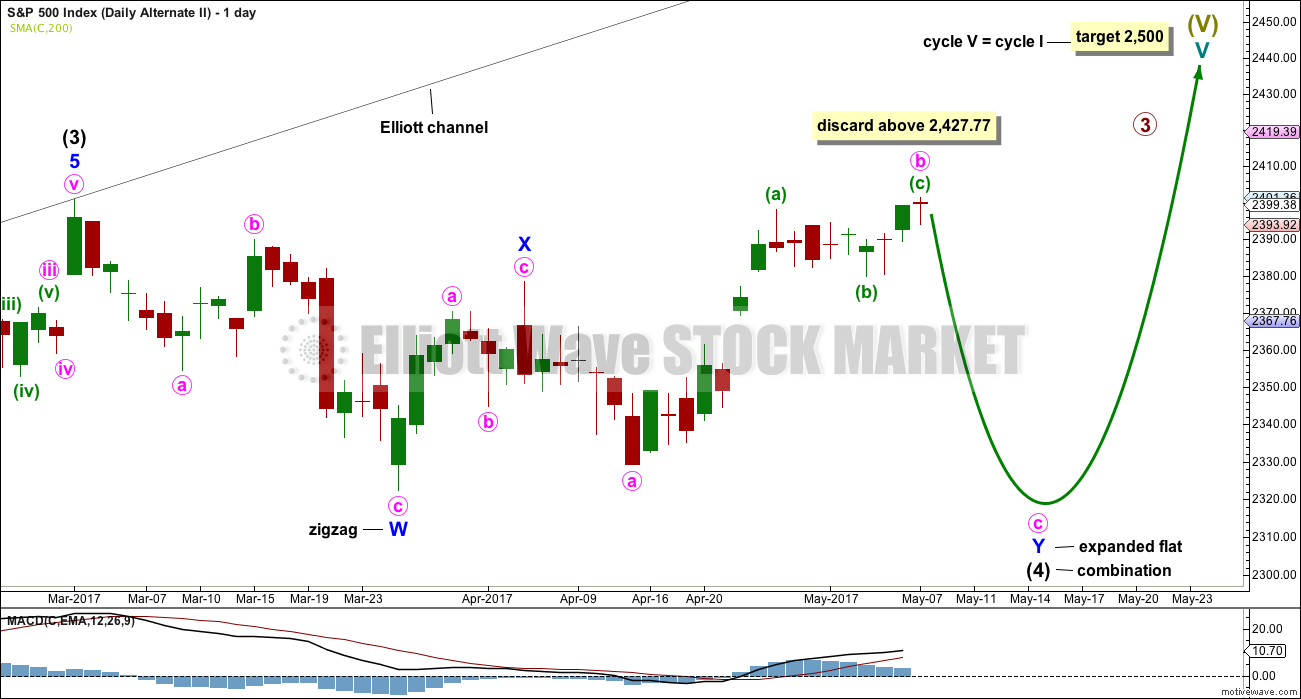
ALTERNATE DAILY CHART
Click chart to enlarge.
What if intermediate wave (4) was not a complete triangle but is still unfolding as a double combination?
Double combinations are very common structures. This would still provide perfect alternation in structure with the double zigzag of intermediate wave (2). Although double zigzags and double combinations are both labelled W-X-Y, they are very different structures and belong to different groups of corrections.
The purpose of combinations is the same as triangles, to take up time and move price sideways. Intermediate wave (2) lasted 58 days. So far intermediate wave (4) has lasted 48 days. If it continues for another one to two weeks, it would still have excellent proportion with intermediate wave (2).
This alternate wave count now has some support from classic technical analysis, particularly extreme ADX at the weekly chart level. If price suffers a quick reversal, then this would be the new main wave count.
ALTERNATE HOURLY CHART
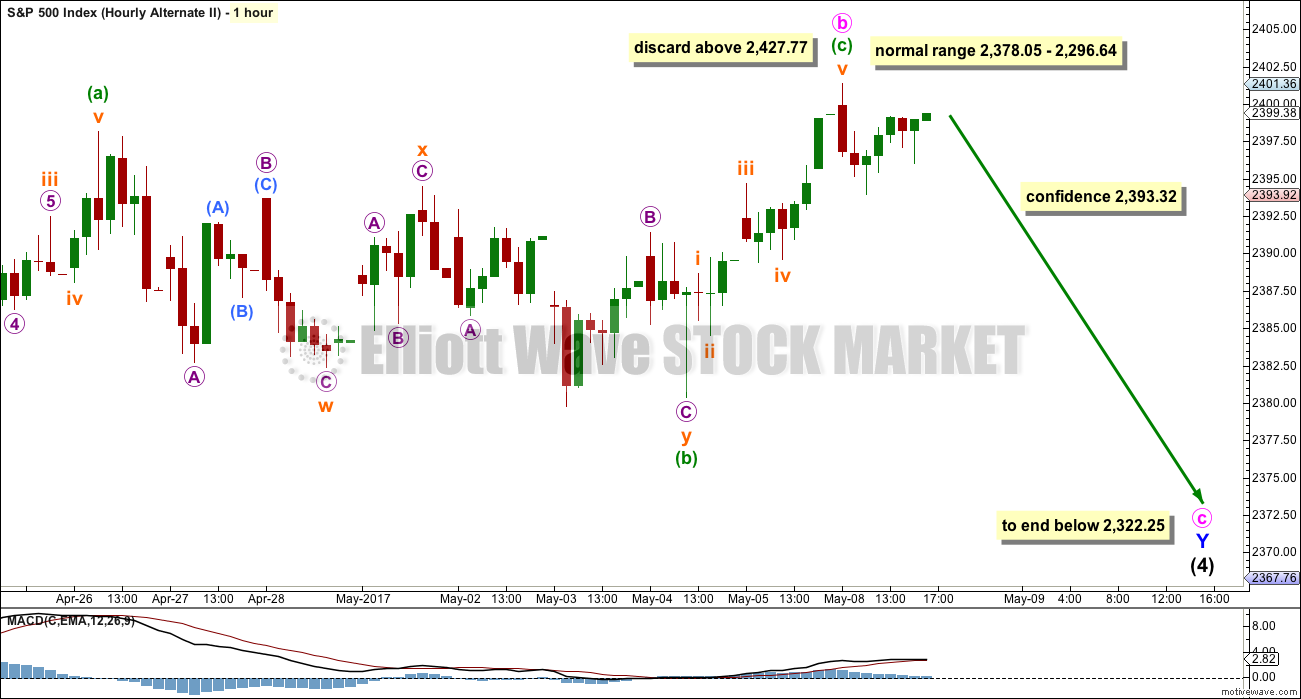
Click chart to enlarge.
Minuette wave (b) will also fit as a double zigzag. This does not have as good a look as the combination idea on the main wave count though. Double zigzags normally have a clear slope against the prior trend but this one moves sideways.
Minute wave b may be over here, or it may continue higher. Only a new high above 2,427.77 should see this alternate wave count discarded.
When minute wave b is complete, then a five wave structure downwards for minute wave c would be expected to most likely take price at least slightly below the end of minute wave a at 2,322.25, so that a truncation is avoided.
If the main wave count is invalidated with a new low tomorrow below 2,393.32, then a little confidence may be had in this alternate.
TECHNICAL ANALYSIS
WEEKLY CHART
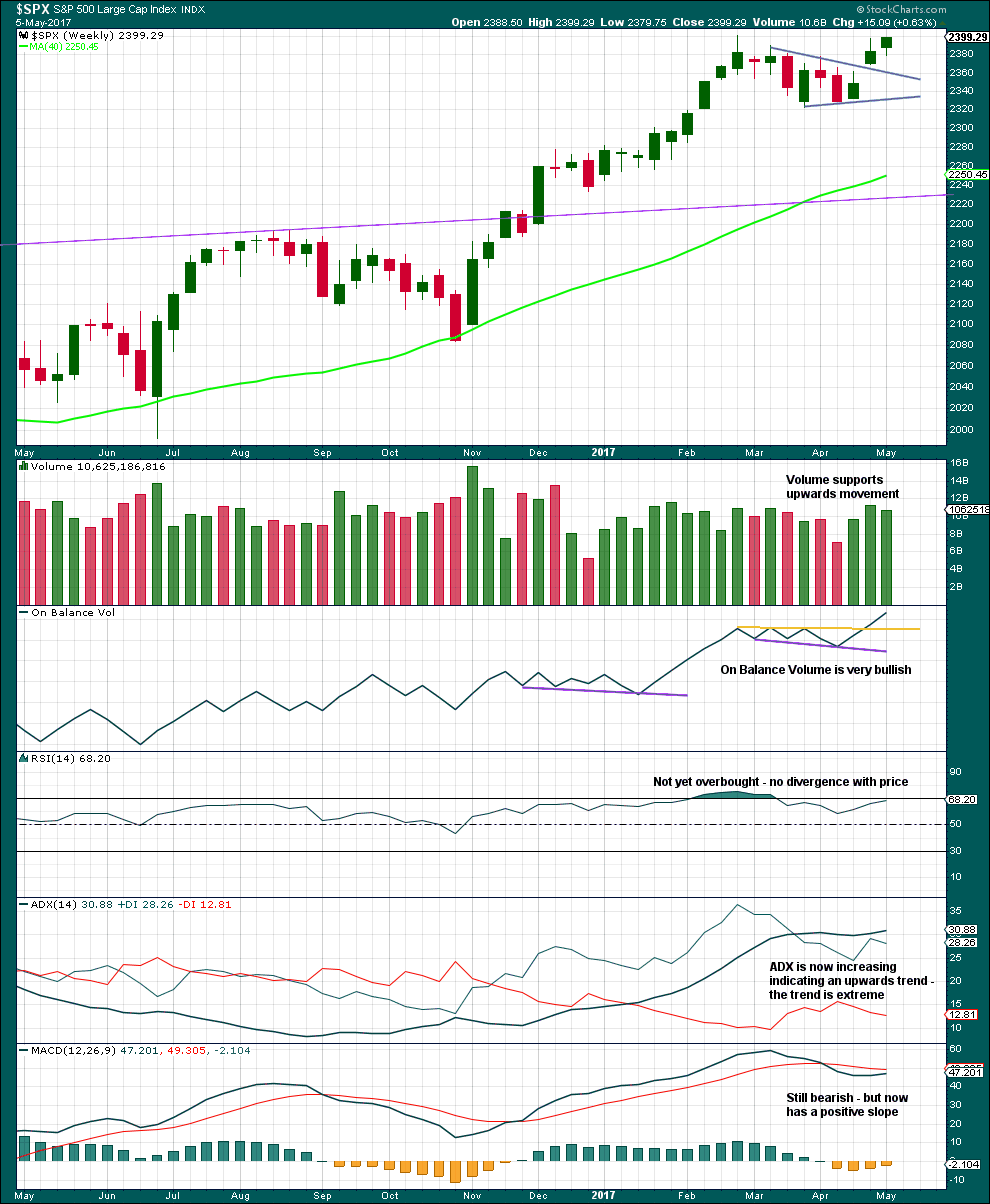
Click chart to enlarge. Chart courtesy of StockCharts.com.
Volume for the last three upwards weeks is all stronger than the two downwards weeks prior. There is more support for upwards movement than downwards. This is bullish.
The only concern here is ADX is extreme. Within this bull market, beginning in March 2009, this has happened at the weekly chart level on four occasions: January 2010, the end of February 2011, early June 2013, and late July 2014. On each occasion it was immediately followed by three to four weeks of downwards movement.
Extreme ADX at the weekly chart level supports the alternate Elliott wave count.
Very bullish On Balance Volume supports the main Elliott wave count.
DAILY CHART
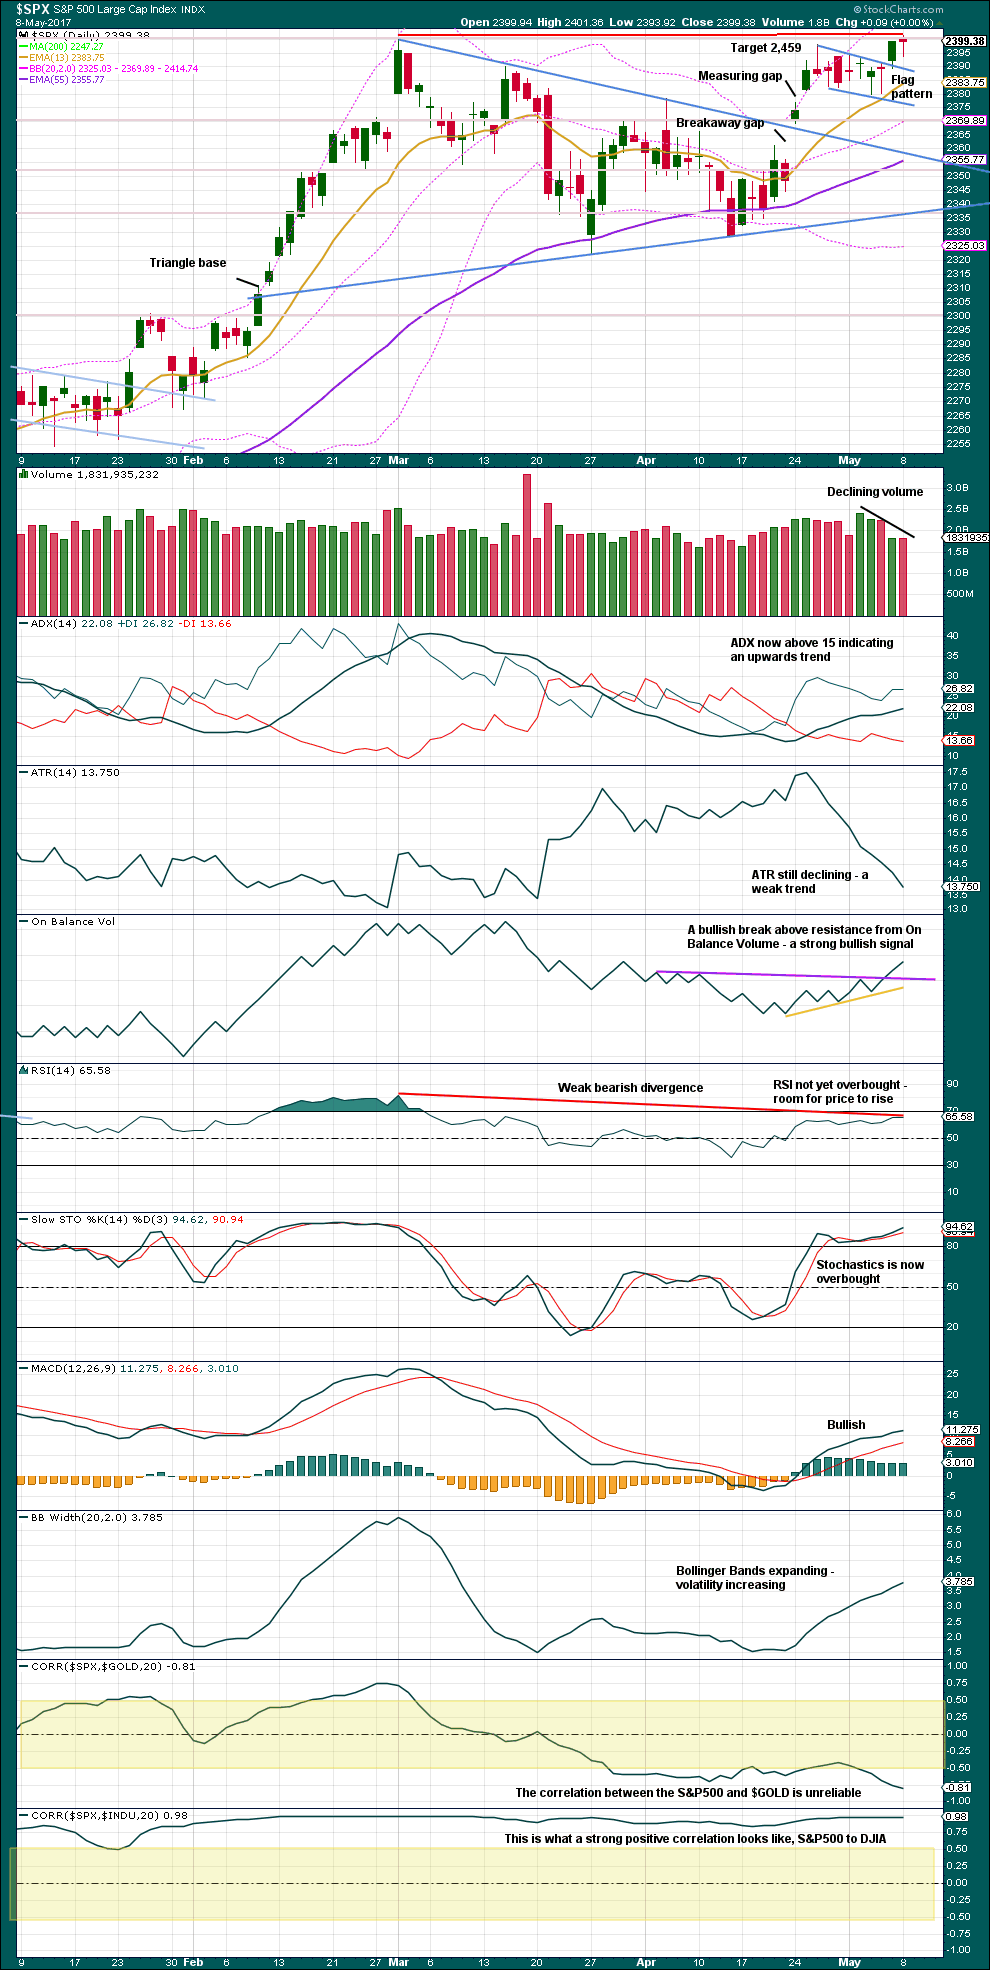
Click chart to enlarge. Chart courtesy of StockCharts.com.
The last two sessions have seen upwards movement with higher highs and higher lows but with much lighter volume than the prior consolidation. If this is an upwards breakout from the bull flag pattern, it is suspicious because it does not have support from volume. Members are advised to manage risk on long positions and keep stops tight.
Bullish On Balance Volume does support the main Elliott wave count.
Some new weak bearish divergence with RSI supports the alternate Elliott wave count.
VOLATILITY – INVERTED VIX CHART
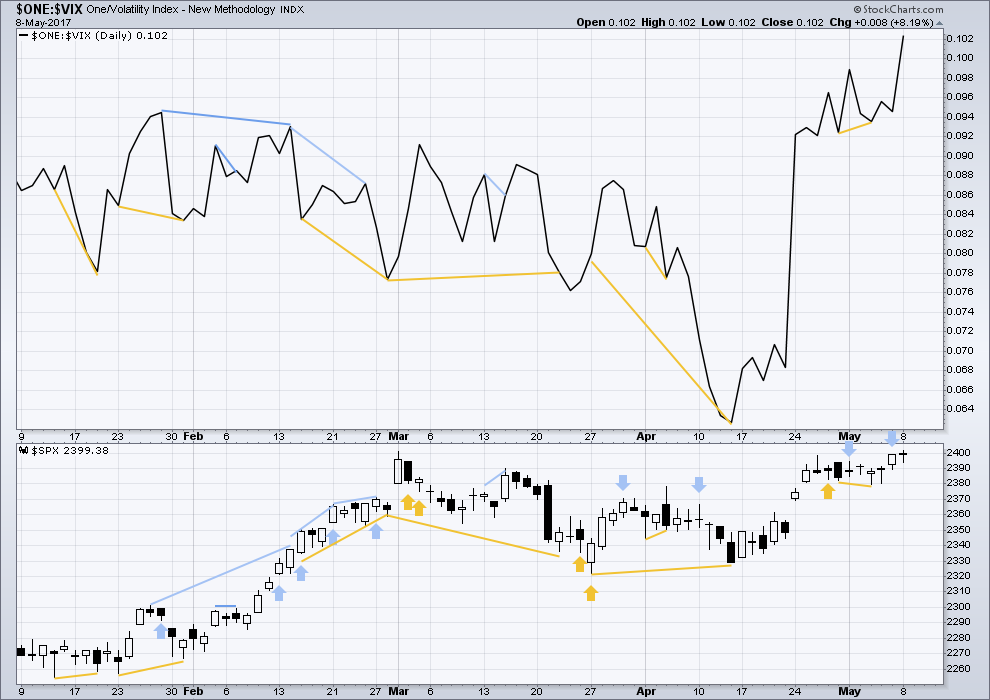
Click chart to enlarge. Chart courtesy of StockCharts.com.
Normally, volatility should decline as price moves higher and increase as price moves lower. This means that normally inverted VIX should move in the same direction as price.
It is noted that there are now six multi day instances of bullish divergence between price and inverted VIX, and all have been followed so far by at least one upwards day if not more. This signal seems to again be working more often than not. It will again be given some weight in analysis.
Single day bearish divergence between price and VIX noted in last analysis has been followed by an upwards day. It is considered to have failed in this instance.
There is no new divergence today. Price has made a new all time high with a decline in volatility.
BREADTH – AD LINE
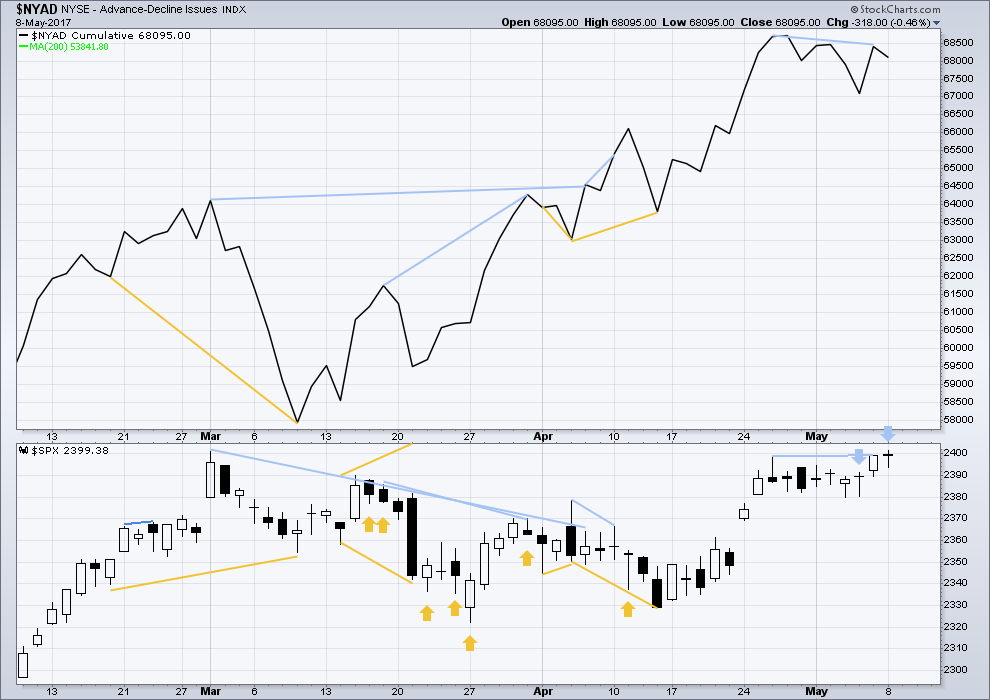
Click chart to enlarge. Chart courtesy of StockCharts.com.
Short / mid term bearish divergence noted in last analysis has been followed by an upwards day, so it is considered to have failed.
While price moved higher the AD line declined. The rise in price did not have support from a rise in market breadth. This is single day bearish divergence and indicates weakness in price today.
DOW THEORY
The DJIA, DJT, S&P500 and Nasdaq continue to make new all time highs. This confirms a bull market continues.
The following lows need to be exceeded for Dow Theory to confirm the end of the bull market and a change to a bear market:
DJIA: 17,883.56.
DJT: 7,029.41.
S&P500: 2,083.79.
Nasdaq: 5,034.41.
Charts showing each prior major swing low used for Dow Theory are here.
This analysis is published @ 08:43 p.m. EST.
Main hourly updated:
I don’t like the three wave look of subminuette v to end minuette (i). Nor do I like the large size of minuette (ii).
Hourly alternate updated:
I don’t like the truncation. But everything else fits nicely. So far I cannot see a solution for either wave count that avoids truncations or running flats 🙁
Still working on it
What if its 5 of 5 of 5? Can that count properly?
So you would see P3 complete at the recent high? Triple zig zag perhaps?
That would explain the volatility price action.
Yes, but only with that severe truncation
Another possible hourly alternate?
That’s what I was thinking as well Peter
Well, Well, Well!
Seems I spoke too soon. I took a quick look at my positions just before heading out and viola! VIX trade already showing some green. Calls now bid at 1.50.
I am tempted to sell half but I am holding. You know the trade has been executed correctly when it goes green the same day. Feeling MUCH better… 🙂
Bye again!
Bye Verne
I was hoping to be out of those VIX calls today but it ain’t gonna happen. This means at least one more high tomorrow. Vol still being smashed. Still looking for a possible outside reversal day. Take care!
SPX made a new 52 week high but SPY so far has not. Strange…
A significant gap down in the market does not necessarily have to come by way of
an aggressive short seller. There is another event that could produce the same effect. The indices are seeing a marked roll-over in the number of stocks trading above their 200 dma, yet the indices continue to post new highs. The reason of course is that they being held up by a relatively few extremely popular names that are owned by oodles of folk, even banks, as Chris pointed out earlier. All it would take for a sharp, sudden plunge in the market is for enough holders of those particular stocks to exit their positions.
Chop on the Russell 2 tells me both smart and dumb money doesn’t know what’s going on. Caveat; the sheer quantity of commercial short positions on all indices is also telling me we are sooner rather than later going to see real fear return to the market.
That we are in a bull market is undeniable. Red flags however, are flying everywhere.
Not only are we seeing multi-decade lows for VIX, we are also seeing multi-decade S&P 500 PE ratios relative to VIX.
Sentiment Trader confirms the exuberance with an RAI (Risk Appetite Index) near 100%. Market breadth is also deteriorating. A peek under the hood reveals that many indices, especially NDX, are being kept aloft by a relatively small number of stocks.
Another very interesting and unusual statistic reported by Sam Colins is that DJI has not had a three day winning streak for over 50 days, a streak drought not seen in 100 years!
Plenty of reasons to tread carefully out there…
When you refer to market breadth deteriorating, can I assume you mean short term?
I’m following Lowry’s Operating Companies Only AD line. That made a new ATH in April. Before a bull market turns to bear that line should have a 4-6 month divergence with price.
I guess I was using that term in a very narrow sense. I just charted the rate of change for stocks in the indices trading below the 200 day VS ones trading above it, and then that VS index price, and there is strong divergence. I don’t think this is the actual formal calculation typically used for market breadth as that includes additional momentum oscillators , A/D ratios etc.
Volatility and the Yen still being sold quite hard with former seeming to have reached the smack-down limit….
Buying S triple Q May 19 32 strike calls for 0.85….
It is hard to imagine that there are not traders with much deeper pockets that us small fry looking at these markets and thinking this kind of over-sold extreme is absolutely nuts. We will have confirmation of a heavy hitter on the move with a serious gap down in the next day or two. Of course, it could well be the banksters themselves doing a rinse and repeat on all the retail investors who have recently piled in.
While we are in uncharted waters, and to the degree that VIX can still convey any meaningful messages about market price action, the hammer and early reversal could be saying time for everyone to get out of the pool….
Buying 50 SVXY May 19 155.00 strike puts for 3.8
Adding to VIX 10.00 strike calls. Lowering cost basis to 1.30
It is becoming difficult to figure out if the levels of complacency indicated by VIX readings is real, or somehow an artifact of unusual trading activity in the markets. It is looking like VIX will make another multi-decade low during today’s session. While I understand that we should expect sentiment extremes at a generational top like the one we are in the process of forming, is it possible that the instinct for even self-preservation has been undone by the Pavlovian conditioning of the crowd these past several years?
I realize that this is not the official wave count and I am certainly sticking with Lara’s analysis until proven otherwise, but I find myself wondering if this is not a top or extremely close to it, it is hard to imagine what the real one is going to look like. I find the current situation very sobering…very sobering indeed…
Square of 9s suggested a 2411 high, which now is a pivot. I can’t believe this late in the cycle we are at 23yr lows in Vol. The Central Banks must think they are masters of the universe. Apparently, the Swiss Central Bank was not phased by AAPL’s earnings miss, as they are now the largest holder. If I was Tim Cook, I wouldn’t be pleased by that.
NDX, and all Fab Five are trading at extremes from 20 dma last seen in 2000. The current extreme exceeds even then…
New 52 week lows in several volatlity instruments today, including VIX, is consistent with a generally high degree second wave. It is quite unusual to see a new 52 week low in VIX ahead of what would at most a third wave of only minuette degree. Of course much in the markets have been a bit strange of late. An impending higher degree fourth wave could be a possible explanation.
woo hoo
Welcome back Doc 🙂