
An upwards breakout from a bull flag pattern was expected. This looks like what has happened at the end of Friday’s session.
Summary: The upwards trend has most likely resumed, but a strong warning from ADX at the weekly chart level means members should keep stops on long positions tight and be prepared to take profits more quickly than usual. Stops may be set just below 2,389.38 at this time. The profit target remains at 2,469.
Always remember my two Golden Rules for trading:
1. Always use a stop.
2. Invest only 1-5% of equity on any one trade.
New updates to this analysis are in bold.
Last monthly and weekly charts are here. Last historic analysis video is here.
MAIN ELLIOTT WAVE COUNT
WEEKLY CHART
Click chart to enlarge.
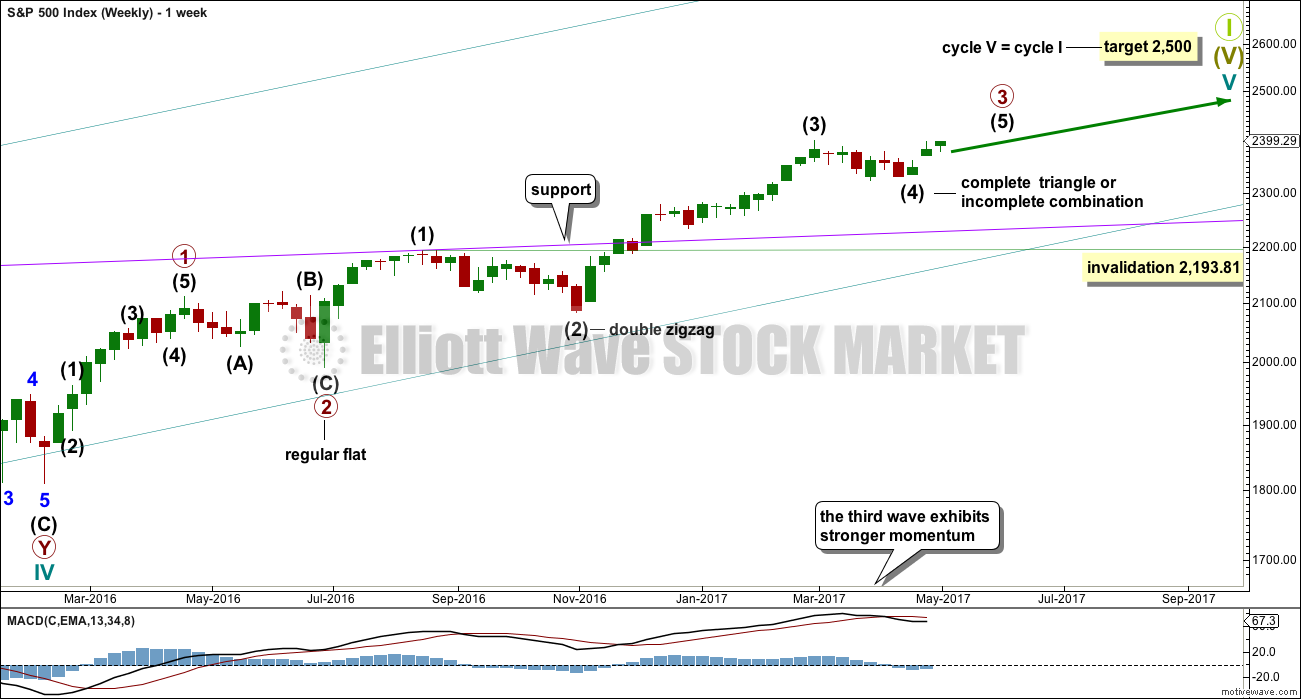
This wave count sees the middle of primary wave 3 a stretched out extension, which is the most typical scenario for this market.
Primary wave 3 may be incomplete. A target is now calculated for it on the daily chart.
There is alternation within primary wave 3 impulse, between the double zigzag of intermediate wave (2) and the possible triangle or combination of intermediate wave (4).
When primary wave 3 is a complete impulse, then a large correction would be expected for primary wave 4. This may be shallow.
Thereafter, primary wave 5 may be expected to be relatively short, ending about the final target at 2,500.
DAILY CHART
Click chart to enlarge.
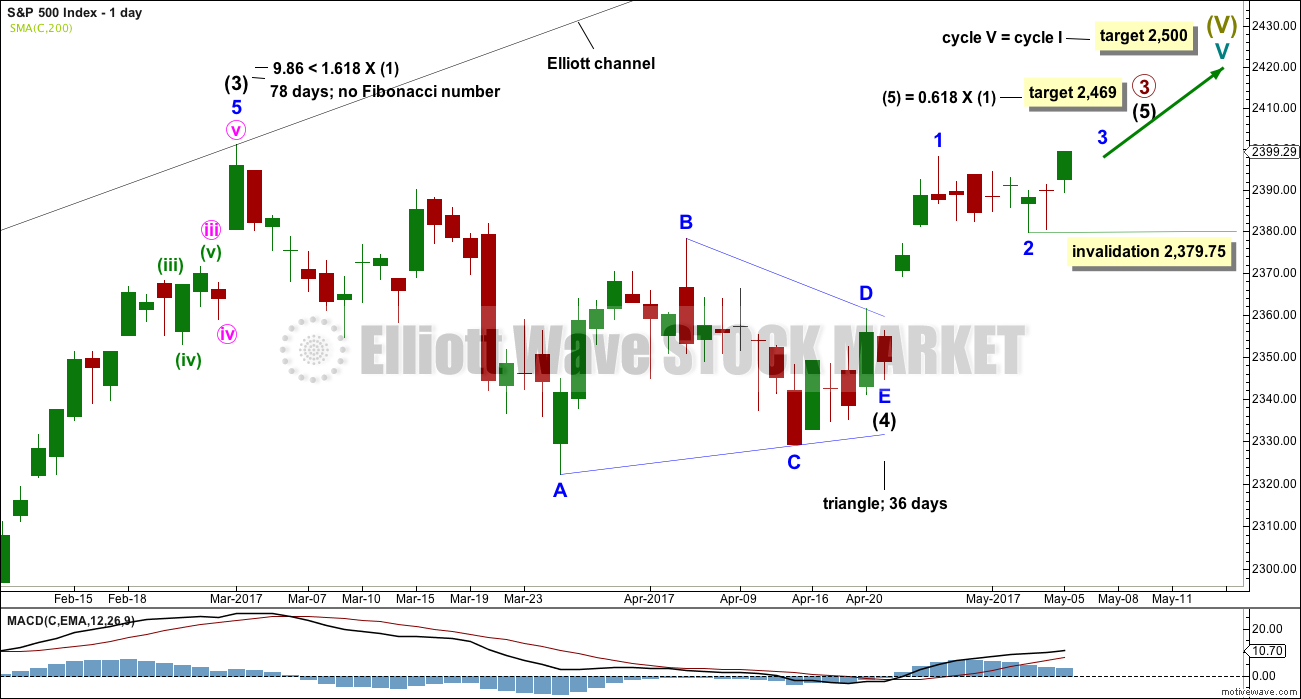
Primary wave (4) may be a complete regular contracting triangle. It may have come to a surprisingly swift end with a very brief E wave.
There is already a Fibonacci ratio between intermediate waves (3) and (1). This makes it a little less likely that intermediate wave (5) will exhibit a Fibonacci ratio to either of intermediate waves (1) or (3); the S&P often exhibits a Fibonacci ratio between two of its three actionary waves but does not between all three.
Within intermediate wave (5), minor waves 1 and now 2 look to be complete.
Within minor wave 3, no second wave correction may move beyond its start below 2,379.75.
HOURLY CHART
Click chart to enlarge.
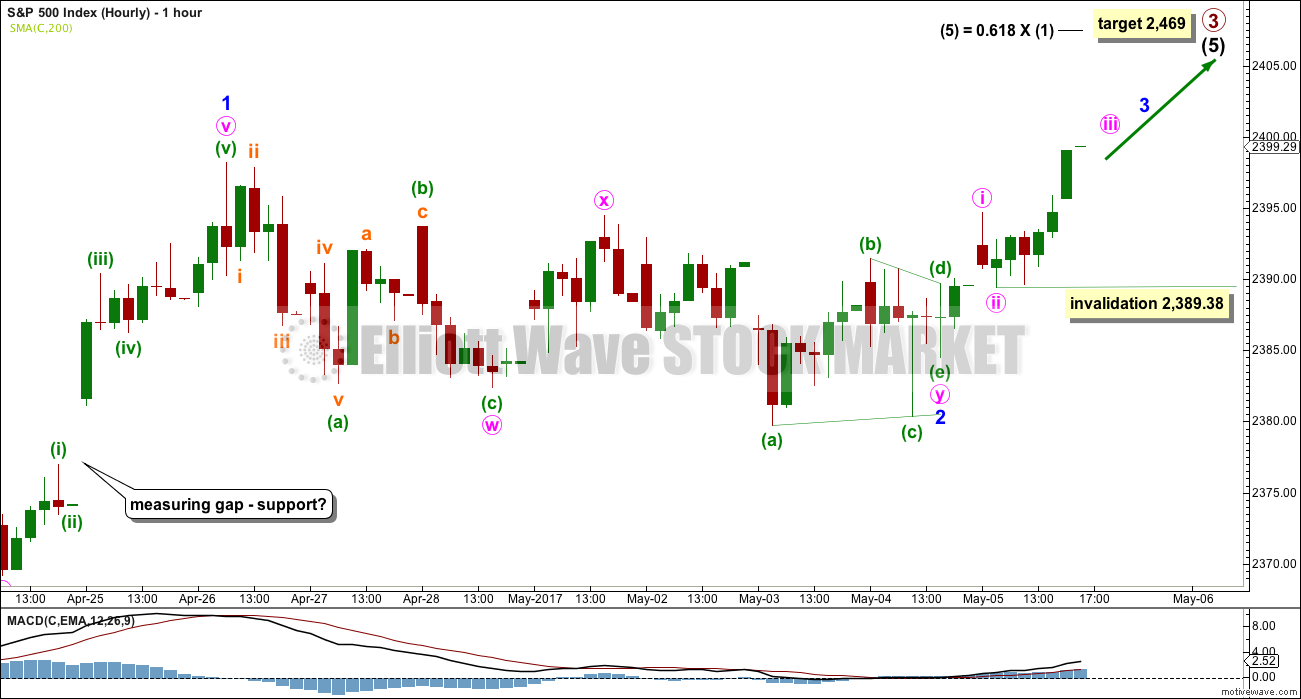
The last gap has continued to provide support, and it still looks like a measuring gap. Minor wave 2 may have competed as a double combination: zigzag – X – triangle.
At the end of Friday’s session, price moved up and away to get very close to the last all time high at 2,400.98. At the hourly chart level, this looks like an upwards breakout from a sideways consolidation for minor wave 2.
So far minute waves i and ii may be complete within minor wave 3. Within minute wave iii, no second wave correction may move beyond the start of its first wave below 2,389.38.
ALTERNATE DAILY CHART
Click chart to enlarge.
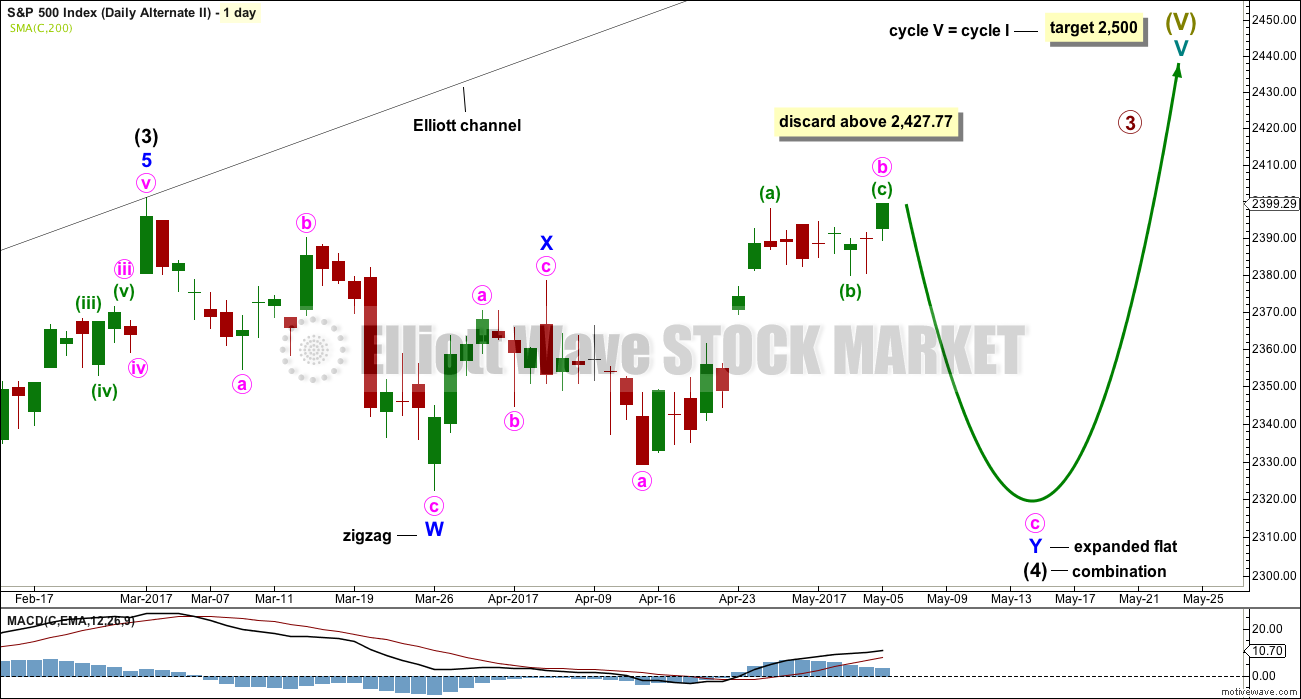
What if intermediate wave (4) was not a complete triangle but is still unfolding as a double combination?
Double combinations are very common structures. This would still provide perfect alternation in structure with the double zigzag of intermediate wave (2). Although double zigzags and double combinations are both labelled W-X-Y, they are very different structures and belong to different groups of corrections.
The purpose of combinations is the same as triangles, to take up time and move price sideways. Intermediate wave (2) lasted 58 days. So far intermediate wave (4) has lasted 47 days. If it continues for another two or three weeks, it would still have excellent proportion with intermediate wave (2).
Although this wave count actually has a better look than the main wave count, it does not have support from classic technical analysis. For this reason it will be published as an alternate with a lower probability.
ALTERNATE HOURLY CHART
Click chart to enlarge.
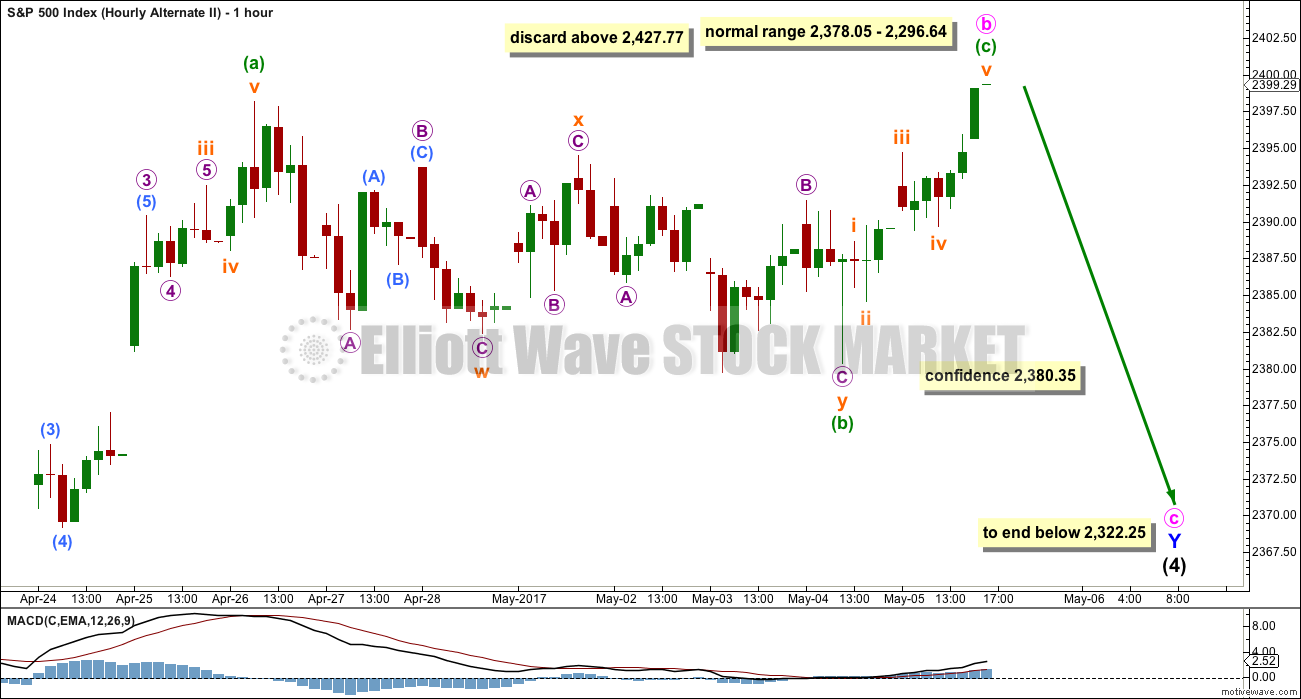
Minuette wave (b) will also fit as a double zigzag. This does not have as good a look as the combination idea on the main wave count though. Double zigzags normally have a clear slope against the prior trend but this one moves sideways.
Minute wave b may be over here, or it may continue higher. Only a new high above 2,427.77 should see this alternate wave count discarded.
When minute wave b is complete, then a five wave structure downwards for minute wave c would be expected to most likely take price at least slightly below the end of minute wave a at 2,322.25, so that a truncation is avoided.
TECHNICAL ANALYSIS
WEEKLY CHART
Click chart to enlarge. Chart courtesy of StockCharts.com.
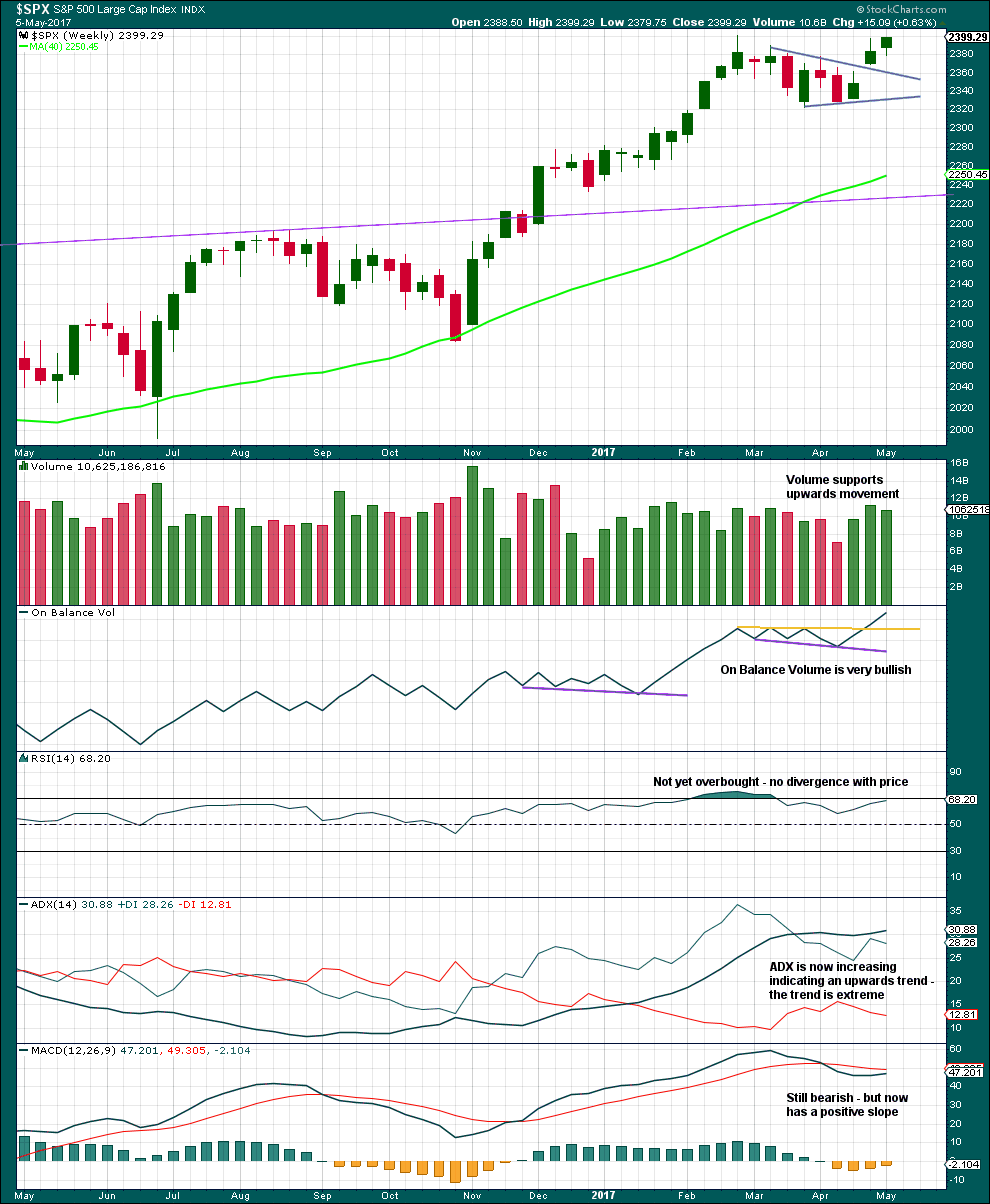
Volume for the last three upwards weeks is all stronger than the two downwards weeks prior. There is more support for upwards movement than downwards. This is bullish.
The only concern here is ADX is extreme. Within this bull market, beginning in March 2009, this has happened at the weekly chart level on four occasions: January 2010, the end of February 2011, early June 2013, and late July 2014. On each occasion it was immediately followed by three to four weeks of downwards movement.
Extreme ADX at the weekly chart level supports the alternate Elliott wave count.
Very bullish On Balance Volume supports the main Elliott wave count.
DAILY CHART
Click chart to enlarge. Chart courtesy of StockCharts.com.
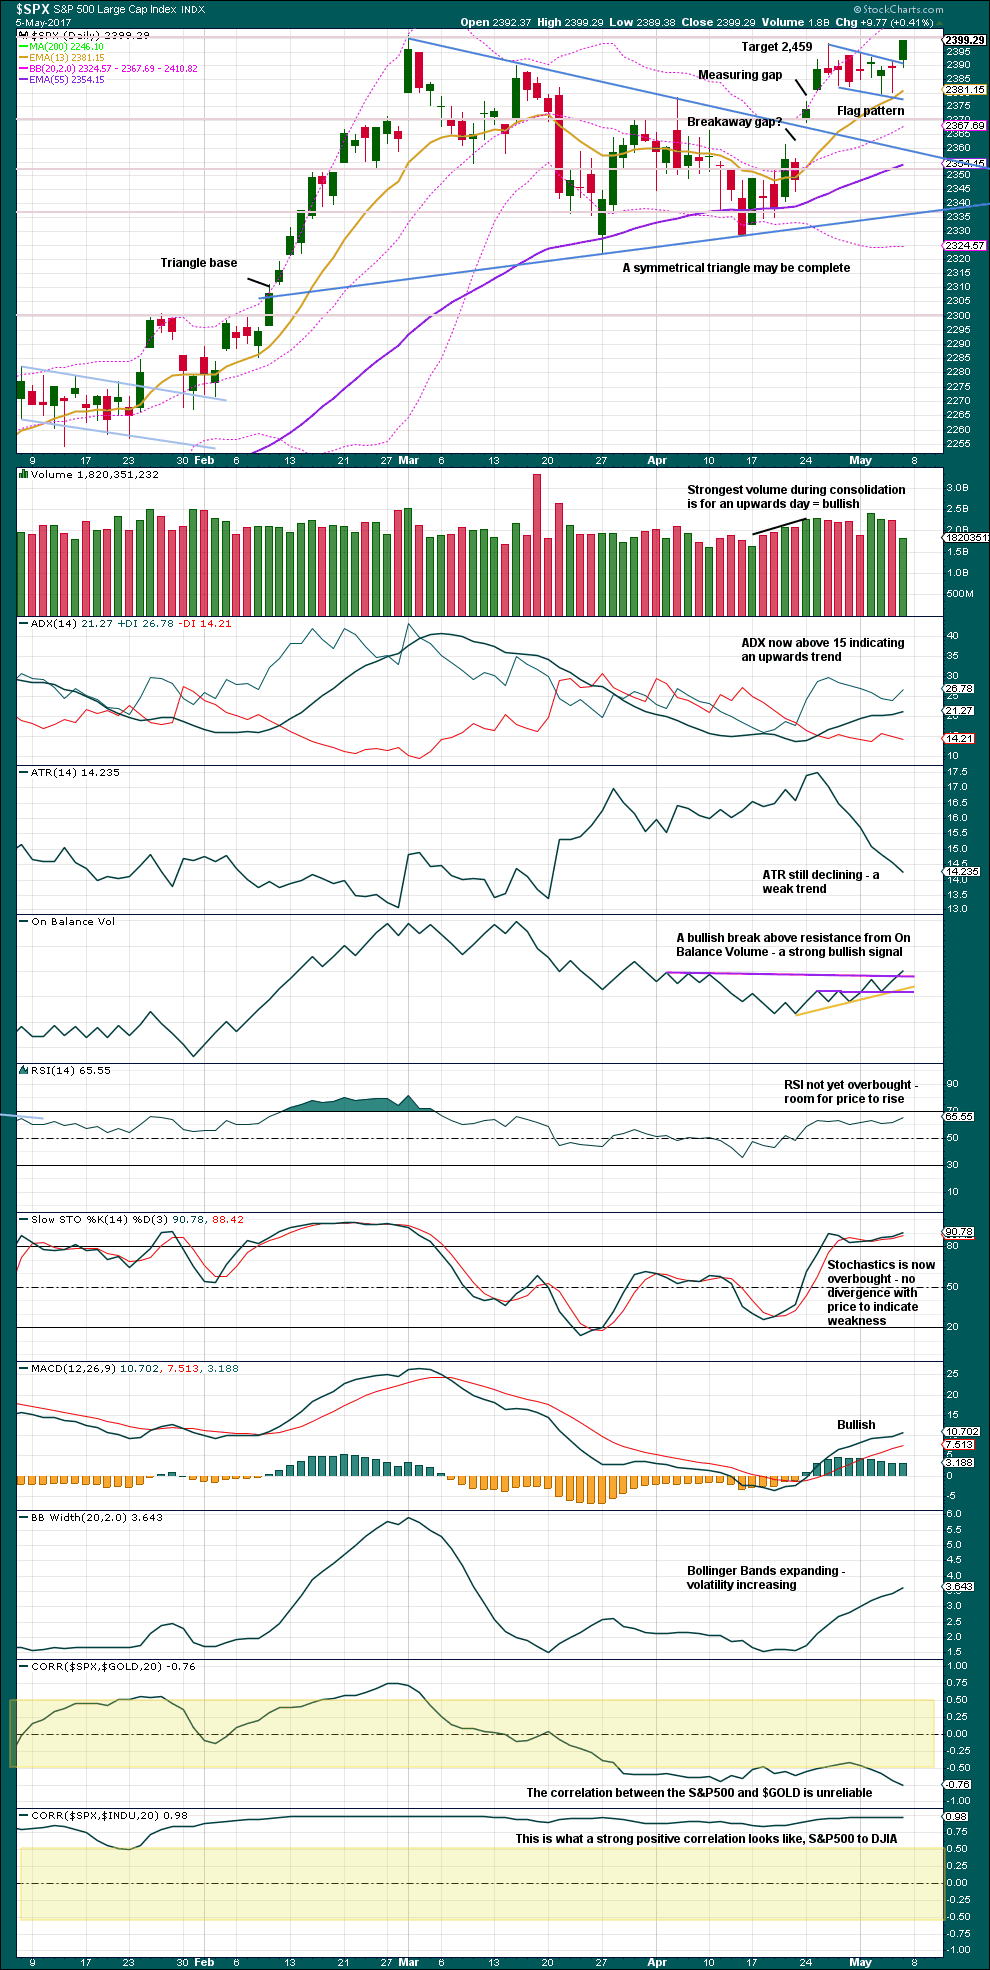
Friday’s session looks like an upwards breakout from the bull flag consolidation pattern. However, it lacks support from volume and should be approached with some suspicion. It may turn out to be false.
Friday’s candlestick is bullish with price closing at the high and no upper wick and a longer lower wick.
ADX at the daily chart level indicates room for the upwards trend to continue, so it is bullish. On Balance Volume is also very bullish at the daily chart level.
There is room for price to continue higher yet, but extreme ADX at the weekly chart level is sounding a strong warning. Keep stops on long positions tight and be prepared to exit quickly.
VOLATILITY – INVERTED VIX CHART
Click chart to enlarge. Chart courtesy of StockCharts.com.
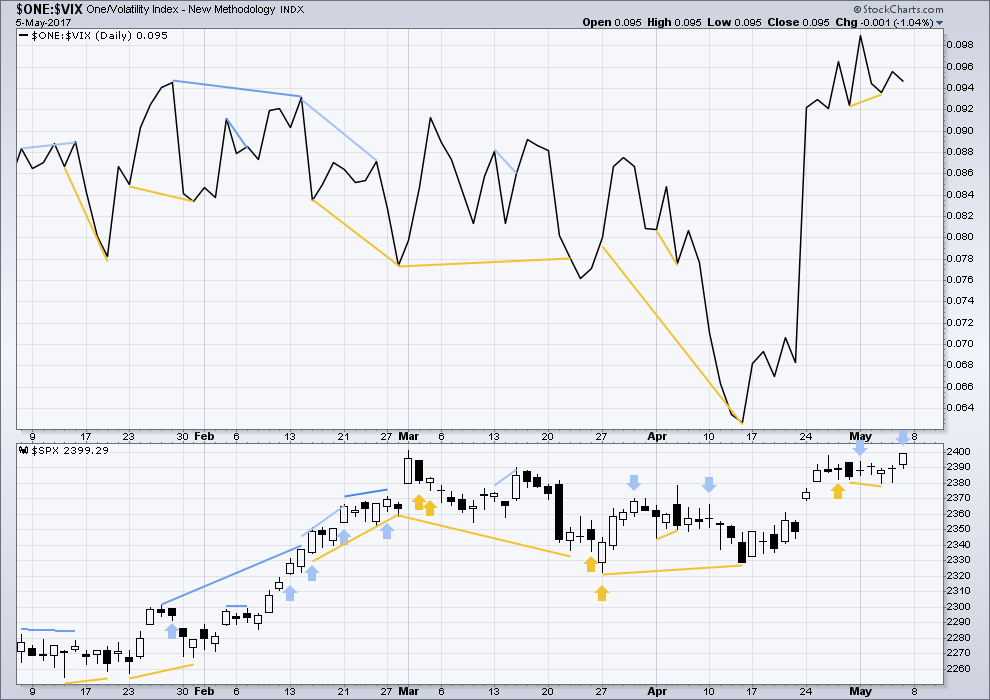
Normally, volatility should decline as price moves higher and increase as price moves lower. This means that normally inverted VIX should move in the same direction as price.
It is noted that there are now six multi day instances of bullish divergence between price and inverted VIX, and all have been followed so far by at least one upwards day if not more. This signal seems to again be working more often than not. It will again be given some weight in analysis.
There is single day bearish divergence for Friday between price and VIX: volatility increased and did not show a normal decline while price moved higher. This divergence indicates weakness within price. The last three occasions noted here of single day bearish divergence were followed by some downwards movement.
BREADTH – AD LINE
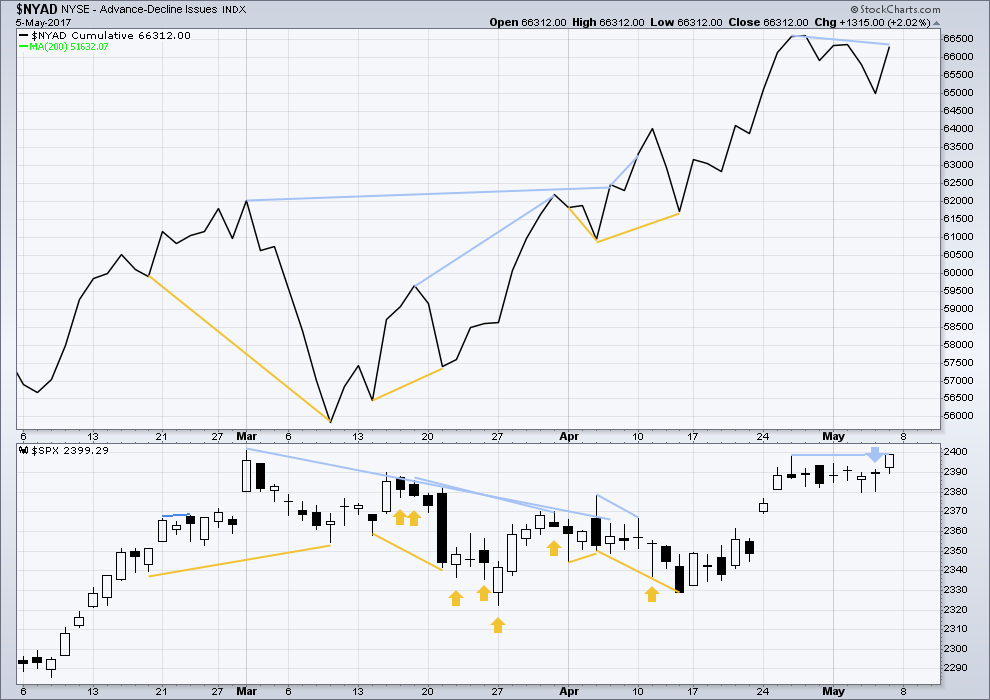
Click chart to enlarge. Chart courtesy of StockCharts.com.
Single day bearish divergence noted in last analysis has not been followed by downwards movement. It has been followed by upwards movement, so it may have failed.
There is short / mid term bearish divergence with a slightly higher high for price on Friday but a lower high for the AD line. This divergence is weak though and should not be given much weight.
DOW THEORY
The DJIA, DJT, S&P500 and Nasdaq continue to make new all time highs. This confirms a bull market continues.
The following lows need to be exceeded for Dow Theory to confirm the end of the bull market and a change to a bear market:
DJIA: 17,883.56.
DJT: 7,029.41.
S&P500: 2,083.79.
Nasdaq: 5,034.41.
Charts showing each prior major swing low used for Dow Theory are here.
This analysis is published @ 10:11 p.m. EST on 6th May, 2017.
I don’t look for the Hindenberg Omen because it’s so complicated to work out. So I let others do that for me 🙂 I have enough on my plate with EW.
Looking at Kirkpatrick and Dhalquist for an interpretation of the Hindenburg Omen:
“this indicator reportedly occurred prior to every major crash since 1985 (including the 1987 crash). Twenty-seven confirmed omens have occurred with only two failing to be followed by a decline of 2% or more. The other subsequent decline were not all crashes because the omen often gives false signals for crashes. However, the odds of a crash (down more than 15%) are about 27% after a confirmed signal. Clusters of signals don’t seem to have any correlation to the extent of the subsequent decline.”
Perhaps these two Hindenburg Omen’s are foretelling the end of primary wave 3 and the start of primary wave 4?
Updated hourly chart:
The invalidation point and stops on long positions can be moved higher. A best fit channel can now be drawn.
New highs in SPX and NDX Composite. Awaiting DJI…
Volume remains muted…
Wasn’t there a Hindenburg Omen on Thursday or Friday last week?
Yep! A second one in a month is generally very bad news…for the bulls….
Indeed, I believe we are running out of bearish signs. Don’t know what would happen if we got some bullish ones. I think H-Omens are 37%ish accurate or something in that range. VIX at FEB 2007 lows is literally hilarious. Buying again, despite my awareness of its manipulation.
Ordinarily a new 52 week low in VIX under these circumstances would see a pretty good pop in days. Lately VIX has been trading at these extremely low levels for weeks. Let’s hope not this time around.
We should really start to see volatility creeping higher with some price divergence with SPX as we approach a primary degree top. May be another day or two of new 52 week lows before we get an upside pop.
Lowering cost basis to 1.45 per contract with additional 100 contracts at 1.40…
A few months ago Tim knight commented that the markets were getting so ridiculously distorted that even he, the ultimate dyed in the wool bear trader, would not enjoy what happens when the thing finally unravels…I think I am startting to get what he was meaning…
A green print today will trigger one of the most bullish signals for volatility there is. VIX should at the very least tag its downtrend line at around 14.50 before the final wave up.
A sharp move above that line would have I think very serious implications.
It’s gonna need a ton of horsepower from down 7%. Below 10 at this stage would normally be an easy long, but loads of dark forces at work here. Would love to know what they think their end game is…Loads of new NYSE 52 wk lows, so I would imagine vol picking up and then continuing into the last wave up.
A few months ago I was starting to think that Reversion to the Mean was no longer a trade-able thesis. What has been happening is the distortion leading to ridiculous standard deviations has not negated or nullified the thesis, it has simply resulted in a protracted period before the ultimate reversion. Reversions (at least volatiity) have been sharp and brief, and repeated, only to face almost immediate subsequent even more virulent deviations. SVXY has shown consistent extreme moves of this sort over the last month or so. This is quite an anomaly when these cycles used to be months or at the very least weeks in the making. This market is probably ultimately not going to correct, it is going to collapse.
I expect we will shortly get another Hindenburg Omen…
Wasn’t there a Hindenburg Omen on Thursday or Friday last week?
Buying to open 100 VIX May 17 expiration 10.00 strike calls for 1.50
If there was any doubt about how VIX and its various instruments have become completely disconnected from market price action, and therefore loosing all usefulness as a gauge of probably market direction, just take a look at what the short VIX short- term futures ETF, SVXY(which should move in the same direction as the market) did during the last correction. The market topped on March 1 at 2400.98 then proceeded to decline over the next several weeks to a low of 2322.25 on March 27. What did SVXY do during the same period? Well take a look. It traded at a high of 128.75 on the day the market topped March 01. Amazingly, while SPX declined over the next several weeks, SVXY continued to rise from 128.75, to a peak of 148.89 on March 21, while SPX declined from 2400.98 to 2341.9 during the same period!
I do not believe these instruments are in any way any longer correlated with the actual put call ratio of SPX. Clearly what is happening is that regardless of market direction, these instruments are being massively used to short volatility. In fact a case could be made that as the market declines, fear is DECREASING!
Now that is what I call IRRATIONAL EXUBERANCE!
Look for the same thing to happen on the imminent corrective move down. Trade safely! 🙂
First?
Yep! Foist indeed! 🙂