
Price remains range bound. Another small doji completes an inside day.
The Elliott wave counts remain mostly the same with a small change for the main hourly chart.
Summary: This small consolidation may present an opportunity to join the upwards trend. Stops may be set just below the last gap, which has its low at 2,356.18. The target is at 2,469.
A new low below 2,344.51 would be bearish; if that happens, expect price to continue lower to 2,319.
Always remember my two Golden Rules for trading:
1. Always use a stop.
2. Invest only 1-5% of equity on any one trade.
New updates to this analysis are in bold.
Last monthly and weekly charts are here. Last historic analysis video is here.
MAIN ELLIOTT WAVE COUNT
WEEKLY CHART

Click chart to enlarge.
This wave count sees the middle of primary wave 3 a stretched out extension, which is the most typical scenario for this market.
Primary wave 3 may be incomplete. A target is now calculated for it on the daily chart.
There is alternation within primary wave 3 impulse, between the double zigzag of intermediate wave (2) and the possible triangle or combination of intermediate wave (4).
When primary wave 3 is a complete impulse, then a large correction would be expected for primary wave 4. This may be shallow.
Thereafter, primary wave 5 may be expected to be relatively short, ending about the final target at 2,500.
DAILY CHART
Click chart to enlarge.
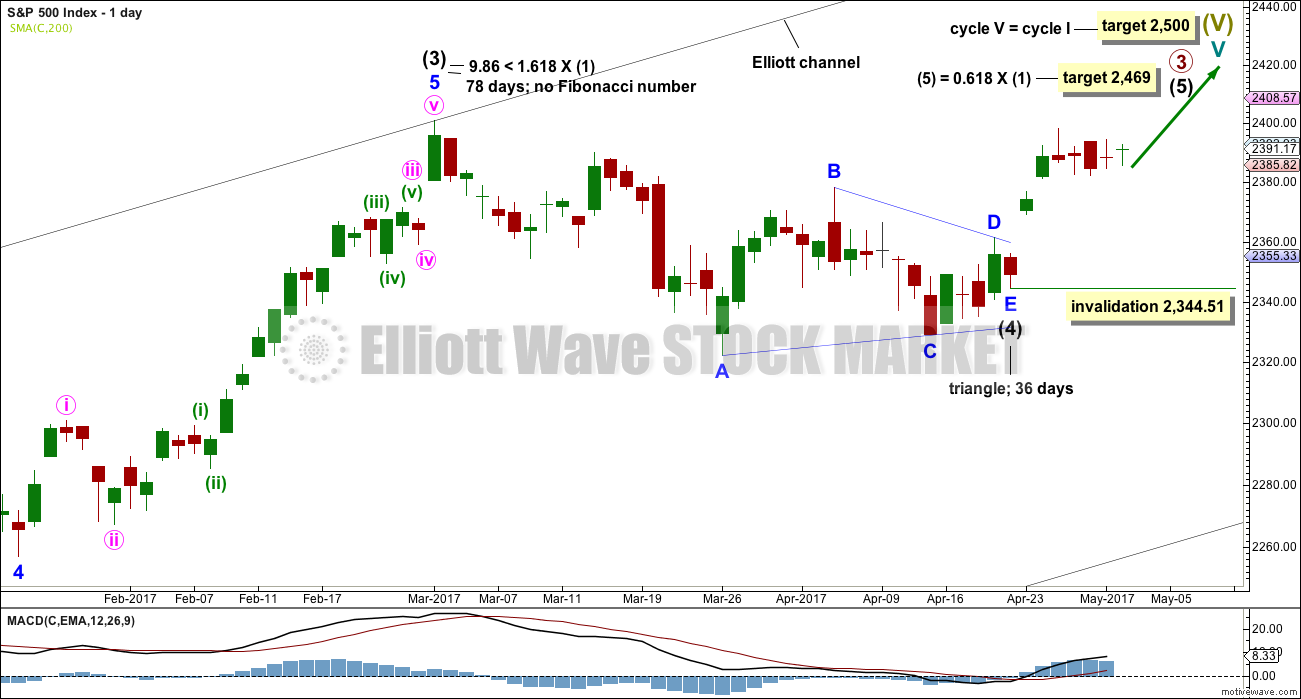
Primary wave (4) may be a complete regular contracting triangle. It may have come to a surprisingly swift end with a very brief E wave.
There is already a Fibonacci ratio between intermediate waves (3) and (1). This makes it a little less likely that intermediate wave (5) will exhibit a Fibonacci ratio to either of intermediate waves (1) or (3); the S&P often exhibits a Fibonacci ratio between two of its three actionary waves but does not between all three.
Within intermediate wave (5), no second wave correction may move beyond the start of its first wave below 2,344.51.
HOURLY CHART
Click chart to enlarge.
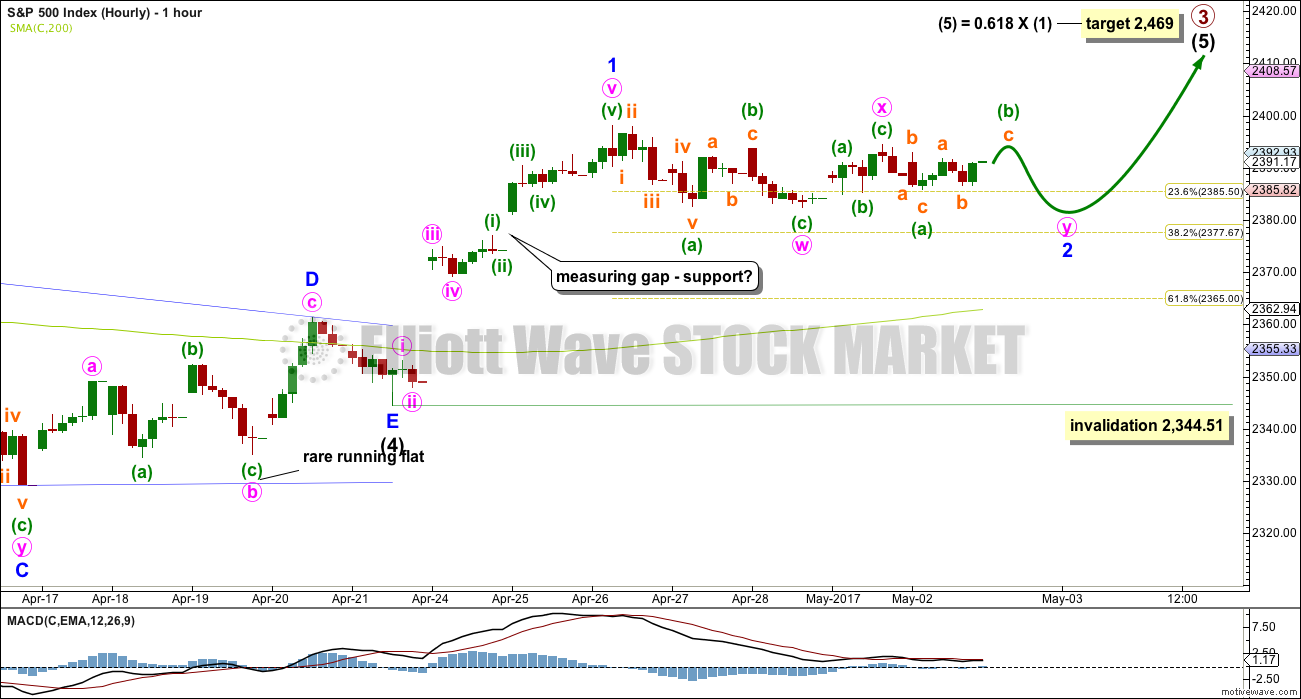
The triangle may have come to a surprisingly quick end. Triangles normally take their time, so this quick end does slightly reduce the probability of this first wave count. A rare running flat within minor wave D of the triangle also slightly reduces the probability. For these reasons an alternate is provided below.
If the triangle is over, then the next wave up has begun. A five up may be complete.
A following three for minor wave 2 may be still incomplete. This structure is reanalysed today. Minor wave 2 may be continuing as a double combination, which are very common structures. The first structure in this combination is labelled minute wave w and fits as a zigzag. There may be only one zigzag within a combination, so the second structure may only be a flat or a triangle. A flat would be much more common.
So far within minute wave y the upwards wave of minuette wave (b) has not yet retraced the minimum 0.9 length of minuette wave (a), which would be at 2,393.62. Minuette wave (b) may move above the start of minuette wave (a) as in an expanded flat, which are very common. There is no Elliott wave rule stating a maximum length for minuette wave (b), but if it reaches twice the length of minuette wave (a) at 2,403.16, then the idea of a flat continuing should be discarded based upon a very low probability.
A new high now above 2,403.16 would add reasonable confidence that minor wave 2 is over and minor wave 3 has begun.
This wave count now expects another one to three days of sideways movement to complete minor wave 2.
If the last gap is correctly named as a measuring gap, then it may not be filled; the lower edge may provide support. If this is the case, then minor wave 2 may be a relatively shallow correction. Within a new trend for this market, the early second wave corrections are often surprisingly brief and shallow.
If price closes the gap, then use the 0.618 Fibonacci ratio as the next target for minor wave 2.
Minor wave 2 may not move beyond the start of minor wave 1 below 2,344.51.
If price does make a new low below 2,344.51, then the alternate below shall be used.
ALTERNATE DAILY CHART
Click chart to enlarge.
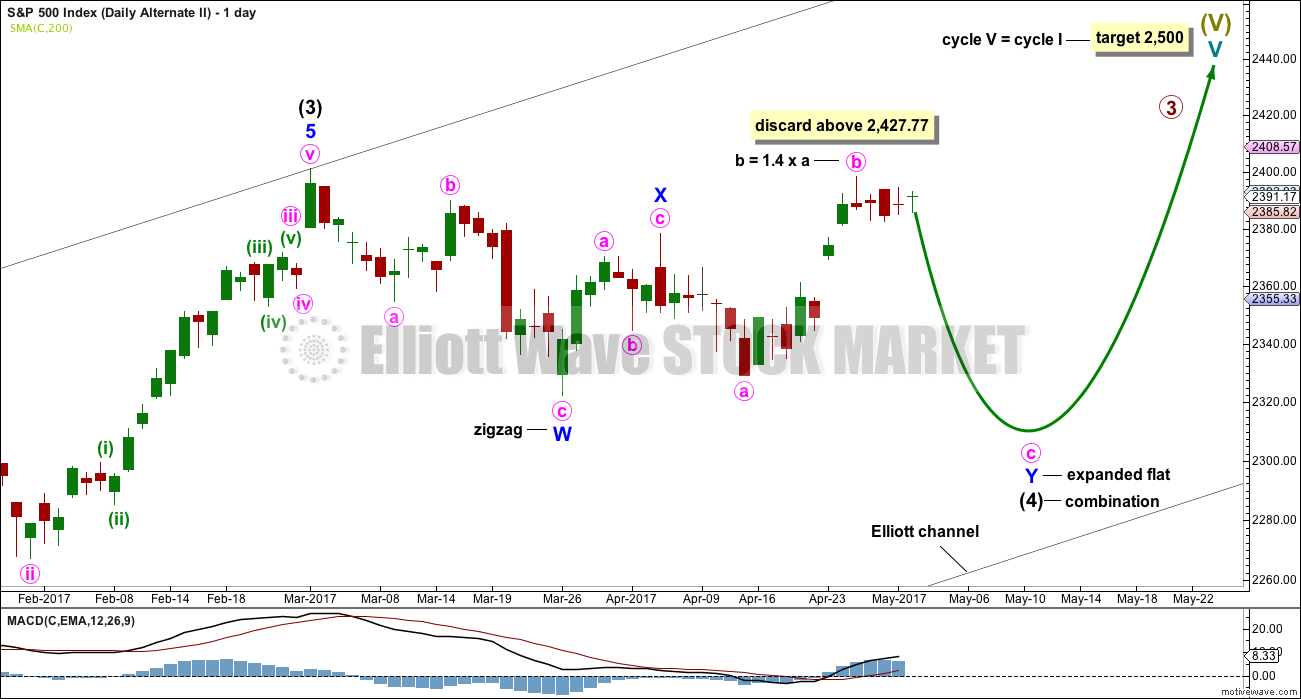
What if intermediate wave (4) was not a complete triangle but is still unfolding as a double combination?
Double combinations are very common structures. This would still provide perfect alternation in structure with the double zigzag of intermediate wave (2). Although double zigzags and double combinations are both labelled W-X-Y, they are very different structures and belong to different groups of corrections.
The purpose of combinations is the same as triangles, to take up time and move price sideways. Intermediate wave (2) lasted 58 days. So far intermediate wave (4) has lasted 43 days. If it continues for another two or three weeks, it would still have excellent proportion with intermediate wave (2).
Although this wave count actually has a better look than the main wave count, it does not have support from classic technical analysis. For this reason it will be published as an alternate with a lower probability.
ALTERNATE HOURLY CHART
Click chart to enlarge.
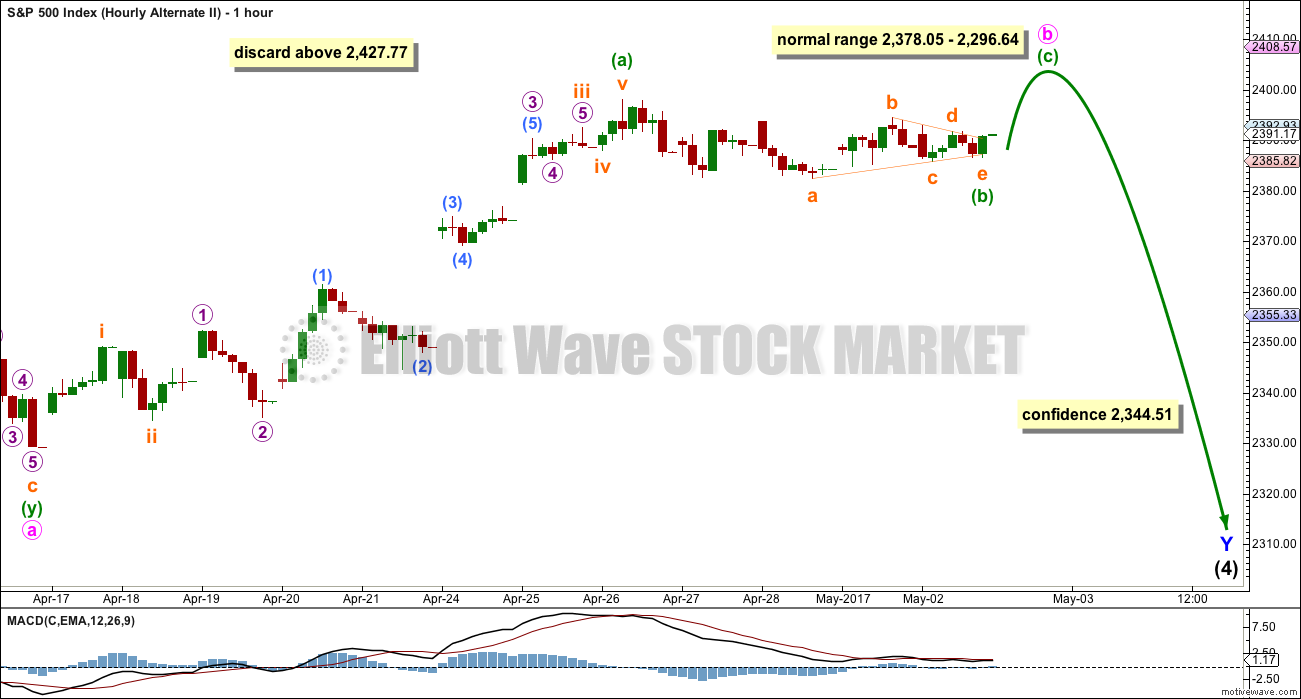
The problem of the running flat within the main wave count is here resolved.
The second structure of the combination may be an expanded flat labelled minor wave Y. There is no rule regarding the maximum length of B waves within flats, but there is an Elliott wave convention that states when the potential B wave reaches twice the length of the A wave the idea of a flat should be discarded based upon a very low probability. That price point would be at 2,427.77.
The best fit channel is discarded. Although it was breached, it was not by downwards movement.
Price is moving slowly sideways.
Minute wave b is reanalysed today. It may be incomplete and sideways movement may be a triangle for minuette wave (b) within the zigzag for minute wave b.
Elliott wave triangles are tricky structures to get right. When it looks like a triangle may be unfolding, it is always important to consider other corrective structures; the possible combination for the main wave count does this. Both a triangle and a combination are equally as likely, but it is impossible at this stage to know for sure which one will complete.
If the triangle is correct, then it may be followed by a short sharp upwards thrust above 2,398.16 before minute wave c downwards begins.
TECHNICAL ANALYSIS
WEEKLY CHART
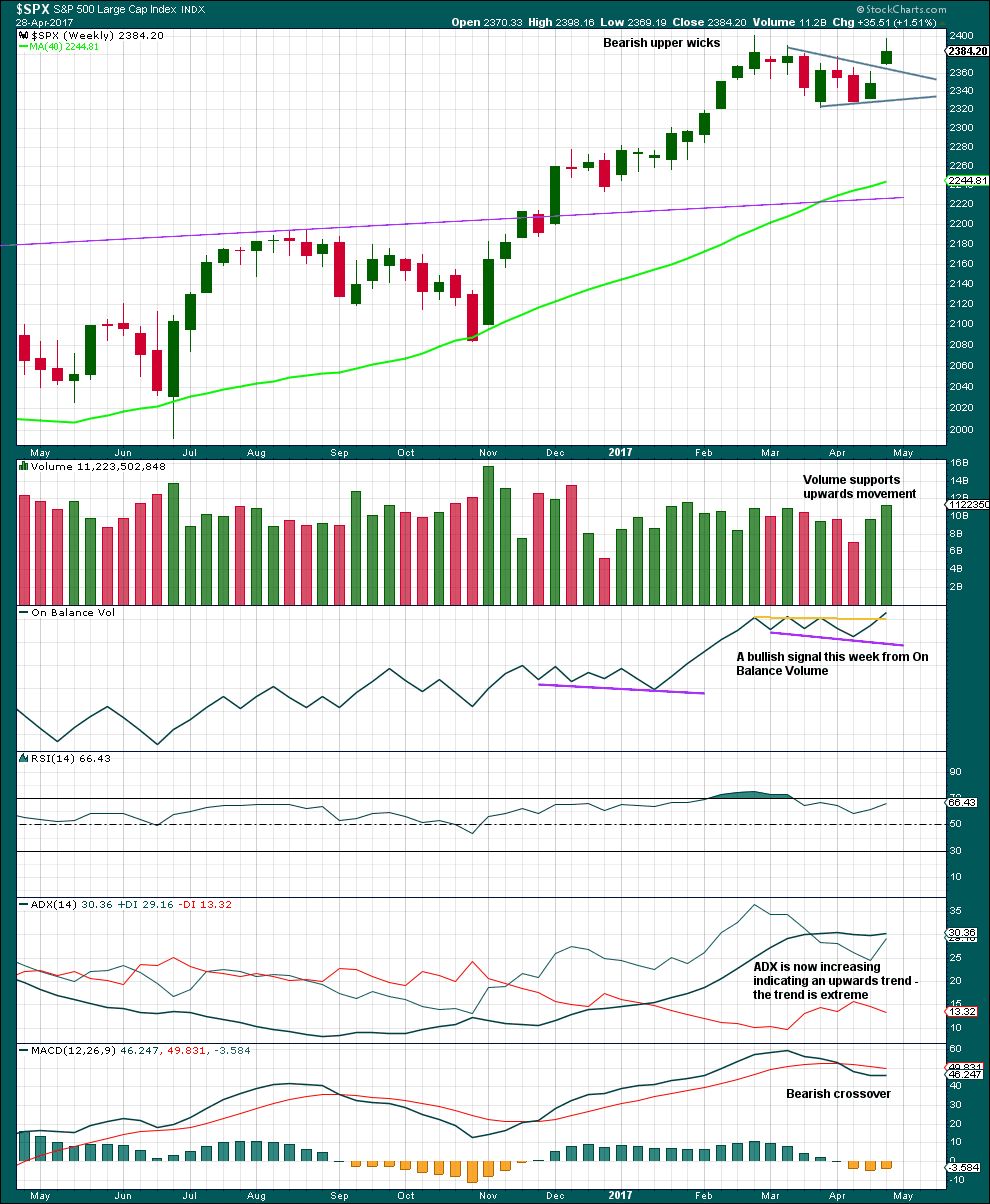
Click chart to enlarge. Chart courtesy of StockCharts.com.
This chart is bullish and strongly supports the main wave count. However, it is concerning that ADX is extreme. This does not mean price must turn down here; it only puts some doubt on how much further price can go up.
DAILY CHART
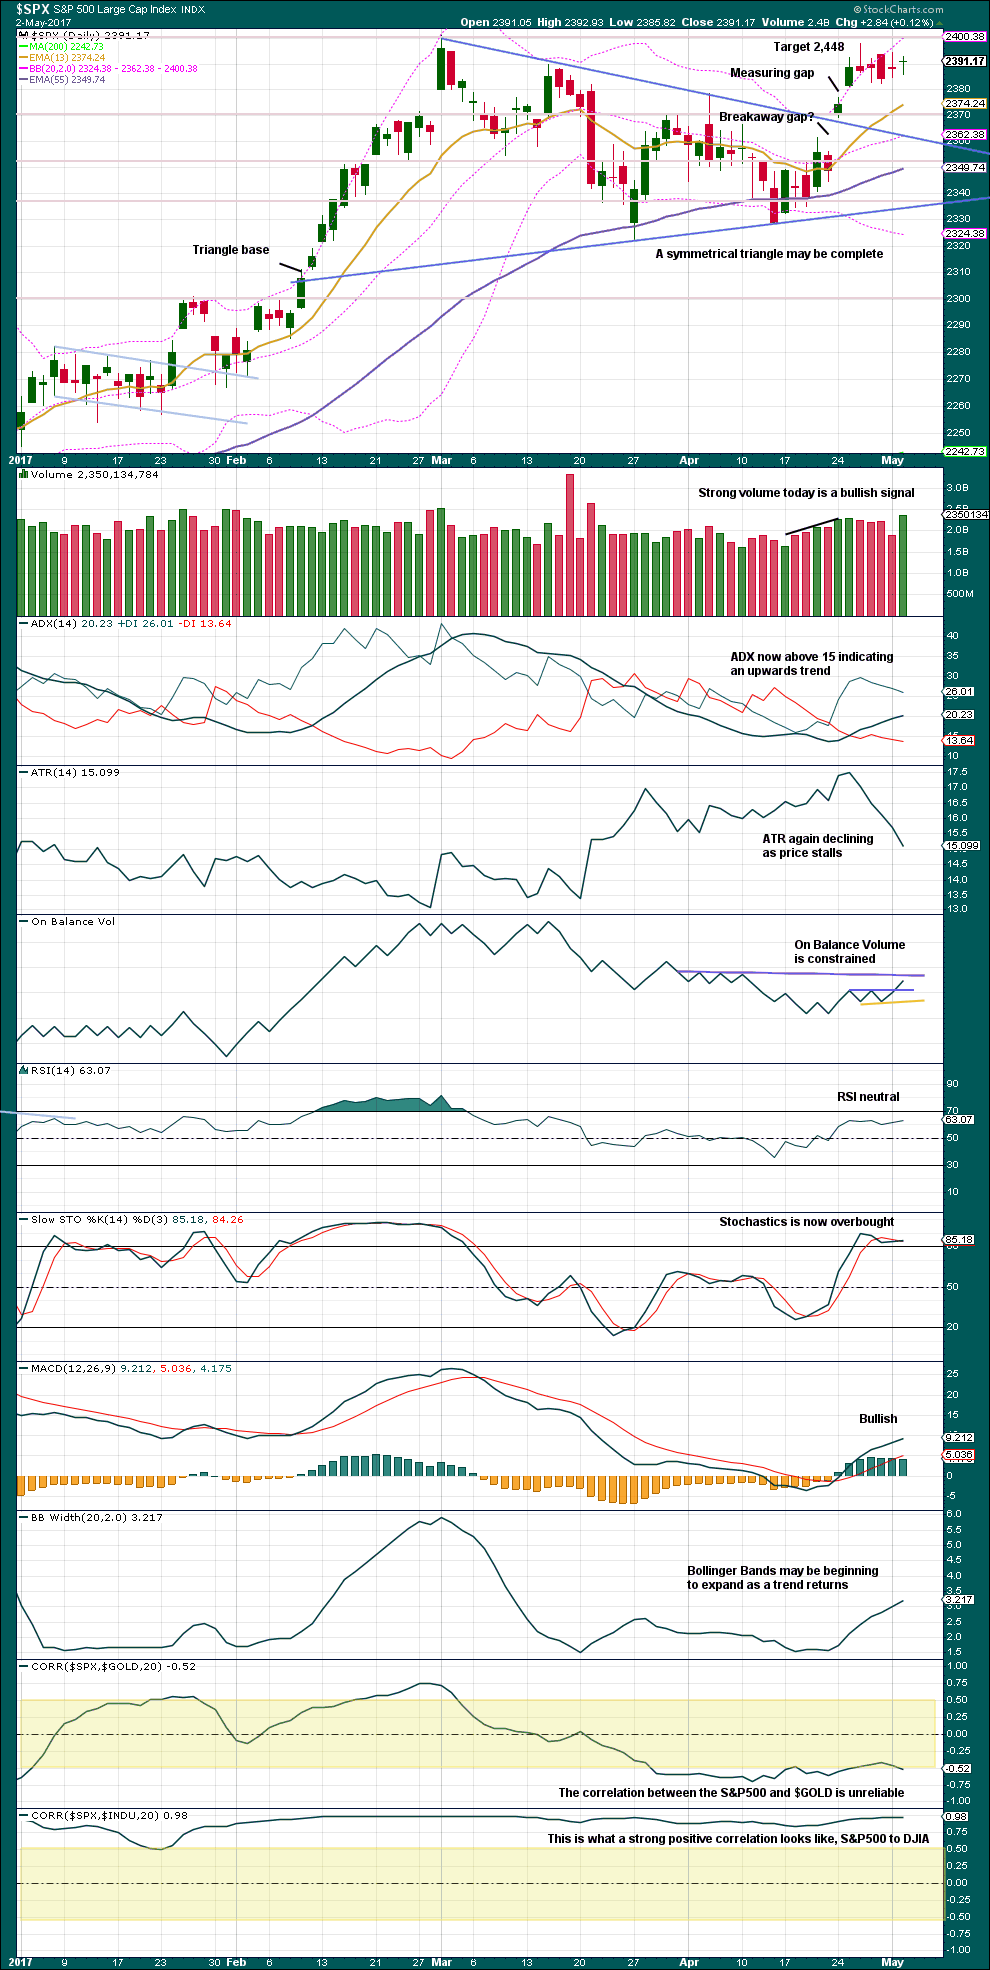
Click chart to enlarge. Chart courtesy of StockCharts.com.
So far the last gap labelled a measuring gap is holding support. Assume this gap is a measuring gap while it remains open, until proven otherwise.
The target remains the same.
This sideways movement looks very much indeed like a small consolidation within the upwards trend. Use it as an opportunity to join the trend.
Volume and On Balance Volume today offer more support for the main Elliott wave count than the alternate. Give On Balance Volume reasonable weight, it works well for this market. A weak bullish signal is given today with a break above the purple line.
VOLATILITY – INVERTED VIX CHART
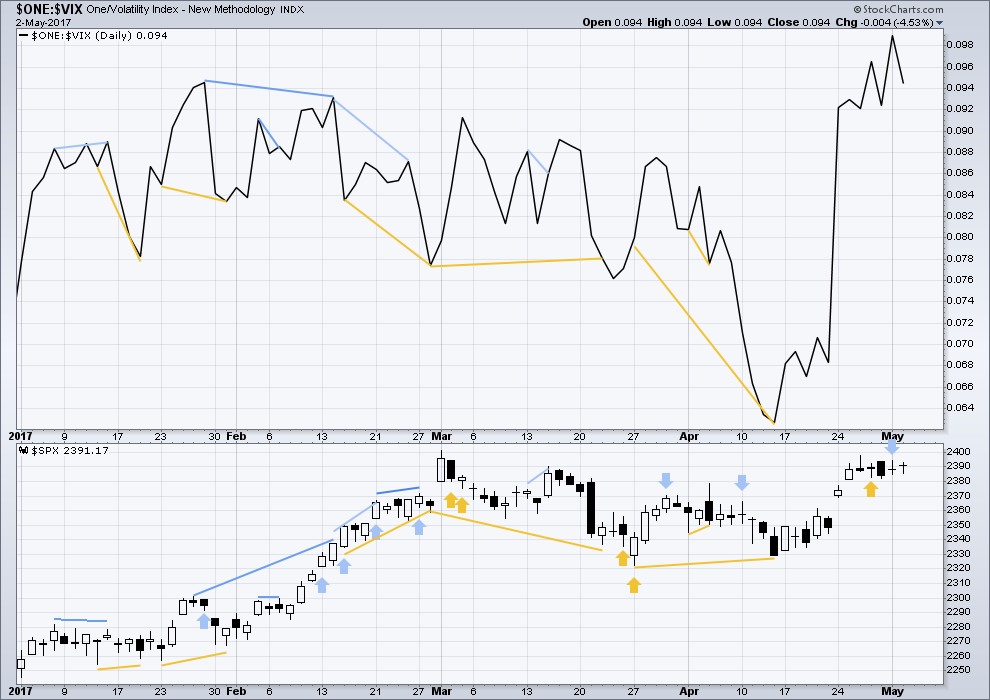
Click chart to enlarge. Chart courtesy of StockCharts.com.
Normally, volatility should decline as price moves higher and increase as price moves lower. This means that normally inverted VIX should move in the same direction as price.
It is noted that there are now six multi day instances of bullish divergence between price and inverted VIX, and all have been followed so far by at least one upwards day if not more. This signal seems to again be working more often than not. It will again be given some weight in analysis.
There is no new divergence between price and VIX today.
BREADTH – AD LINE
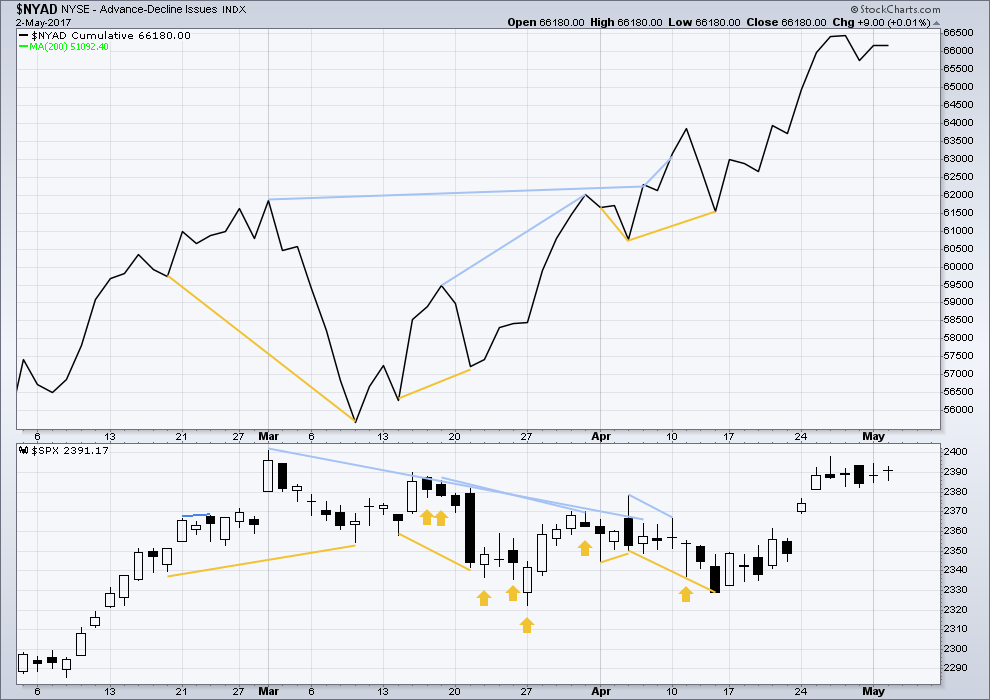
Click chart to enlarge. Chart courtesy of StockCharts.com.
The rise in price has support from a rise in market breadth. Lowry’s measures of market breadth do not at this stage warn of an impending end to this bull market. They show an internally healthy bull market that should continue for at least 4-6 months.
No new divergence is noted today between price and the AD line. There is still longer term bearish divergence, but this has not proven reliable lately, so it will not be considered.
DOW THEORY
The DJIA, DJT, S&P500 and Nasdaq continue to make new all time highs. This confirms a bull market continues.
The following lows need to be exceeded for Dow Theory to confirm the end of the bull market and a change to a bear market:
DJIA: 17,883.56.
DJT: 7,029.41.
S&P500: 2,083.79.
Nasdaq: 5,034.41.
Charts showing each prior major swing low used for Dow Theory are here.
This analysis is published @ 08:58 p.m. EST.
The triangle idea on the alternate is invalid.
Minor 2 fits now as a double combination. Zigzag – X – flat. It should be over now and minor 3 should be just beginning right now.
Support at the last gap has held. Price has tested it now three times, each test reinforces strength there.
Sure would be nice to get a break out of the meandering the last several sessions. A third up should promptly fill that gap from today’s open and buck the “Sell in May” theme. Let’s see of futures give a clue….
My the market makers are stingy. Despite the 4% pop in VIX today the bid on those 11.50 puts is only a nickel over what they sold for yresterday…0.90
If you have been taking advantage of Lara’s generous offer to check out her Trading Room I hope you took advantage of that incredible call on Oil. It is not too often you get to place the market makers in the cross hairs. Another interesting angle to the oil price is you have big players battling each other. Obviously the Saudis and other producers would like to see the price stay above the 50 dollar level as oil revenues are the life blood of their economy. I had to chuckle at the rumors that the Saudi oil minister was valuing Aramco at 10 Trillion. You heard me. That is trillion with a T. Can you believe that they are going to find a whole lot of suckers to jump on that IPO? Anyway, Iran and Iraq have been stealing market share from the Saudis by undercutting their price and this has had a downward pressure on prices. US shale operators are now so efficient they can make money at 45 per barrel. We may have a ways to fall yet.
I may have been a bit hasty unloading my VIX calls yesterday. Anybody taken a look at the chart recently? This is nuts for VIX to be treading at the bottom of the well like this!
Lara,
The main count hourly update looks very interesting. With more sideways movement some might say we have a bull flag forming. This count is strongly supported by last week’s rare weekly gap up on good volume as well as good volume today. I place a lot of weight on this support.
Thanks for the continuing excellent analysis.
Night all.
Bull flag was exactly what I was thinking too Rodney. A very nice continuation pattern.
Aha. First again.