
A new low was expected to begin the session. The upwards trend should have resumed.
Summary: In the short term either this sideways correction is incomplete (main wave count) or one last final high will be seen before a primary degree trend change (alternate wave count). When the upwards diagonal structure on both hourly charts is complete then how deep the following downwards wave goes should tell us which wave count is correct.
Click on charts to enlarge.
Main Bull Wave Count
I will favor neither the bull or bear wave count. Both are viable and both expect this current upwards impulse may again be close to complete.
To see a weekly chart with subdivisions and how to draw trend lines and channels click here.
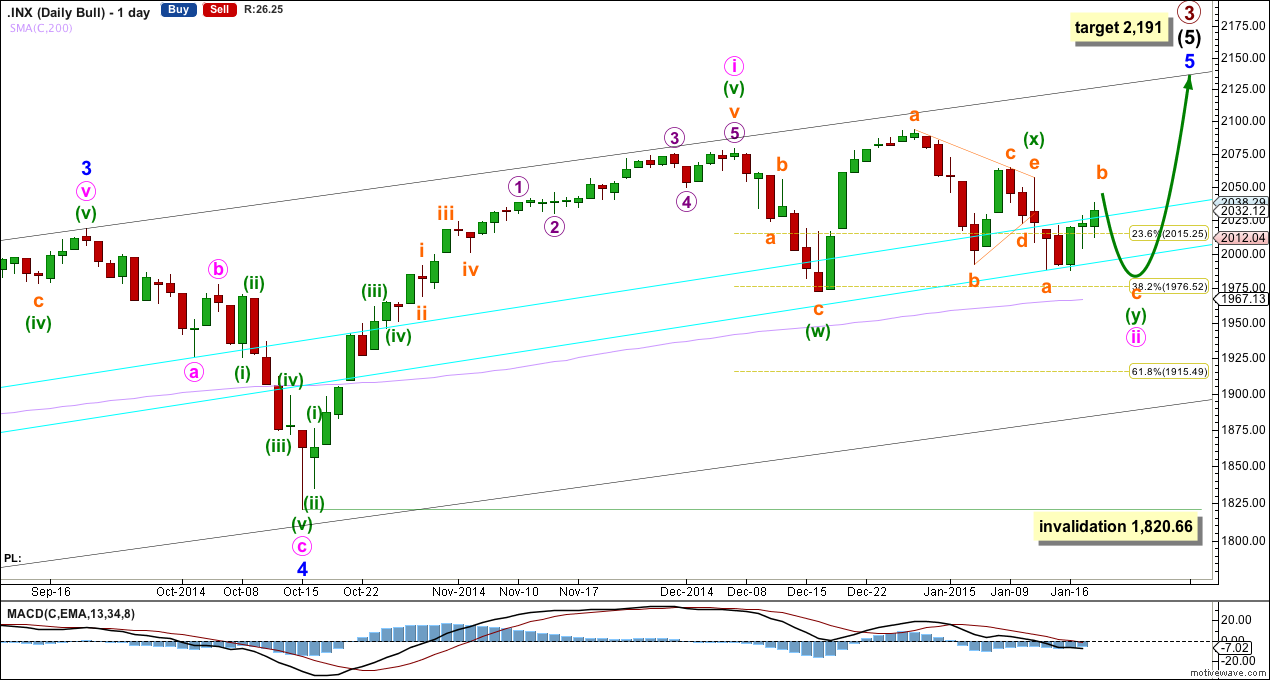
Upwards movement from the low at 666.79 subdivides as an incomplete 5-3-5. For the bull wave count this is seen as primary waves 1-2-3.
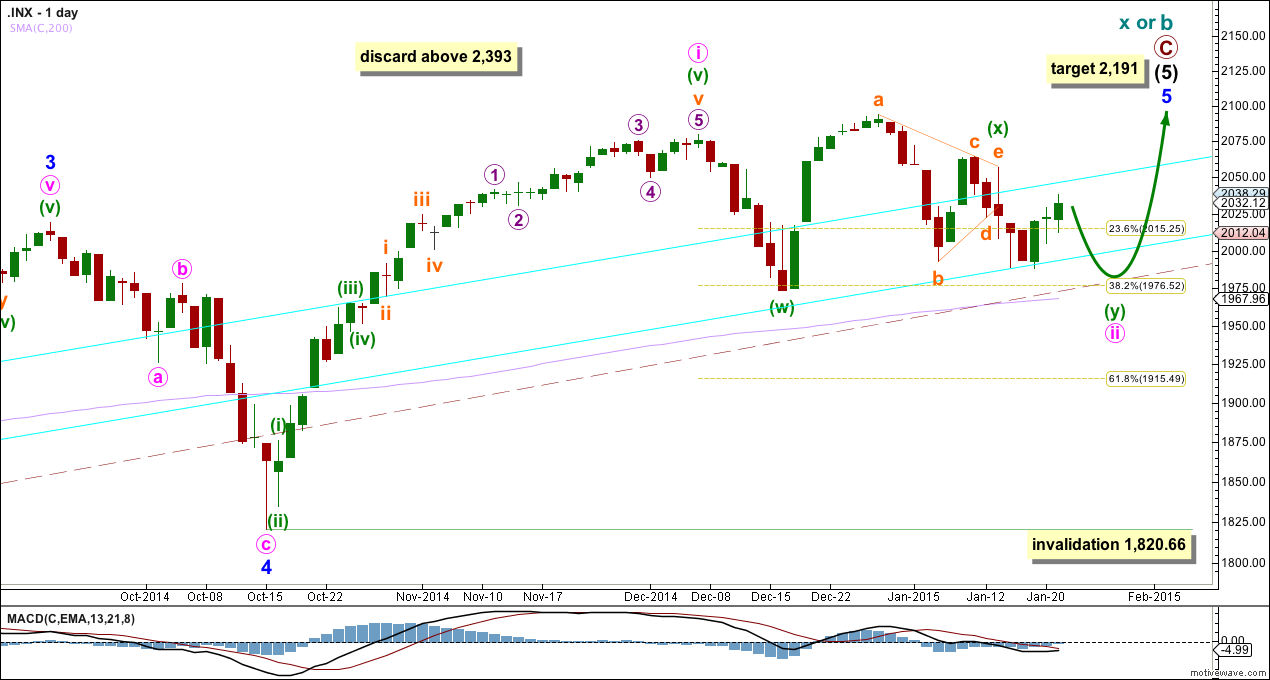
The aqua blue trend lines are traditional technical analysis trend lines. These lines are long held, repeatedly tested, and shallow enough to be highly technically significant. When the lower of these double trend lines is breached by a close of 3% or more of market value that should indicate a trend change. It does not indicate what degree the trend change should be though. It looks like the last two corrections may have ended just short of the lower aqua blue trend line, which gives the wave count a typical look.
I have pulled the upper trend line down a little to touch the low of minute wave a within minor wave 4. This may be a better position for recent movement.
There is still triple technical divergence between MACD and price at the weekly chart level.
Minute wave i lasted seven weeks, 36 days, which is two days longer than a Fibonacci 34. Minute wave ii has now lasted 30 days. It if ends in another four to six sessions it would be equal in duration or a Fibonacci 34 days.
At 2,191 primary wave 3 would reach 1.618 the length of primary wave 1. This would expect that within minor wave 5 minute wave iii will be shorter than minute wave i, and minute wave v will be shorter still. Or the target is wrong.
Looking at momentum within intermediate wave (5) it is concerning that minor wave 3 exhibits weakest momentum. It is for this reason I am seriously considering the alternate bullish wave count.
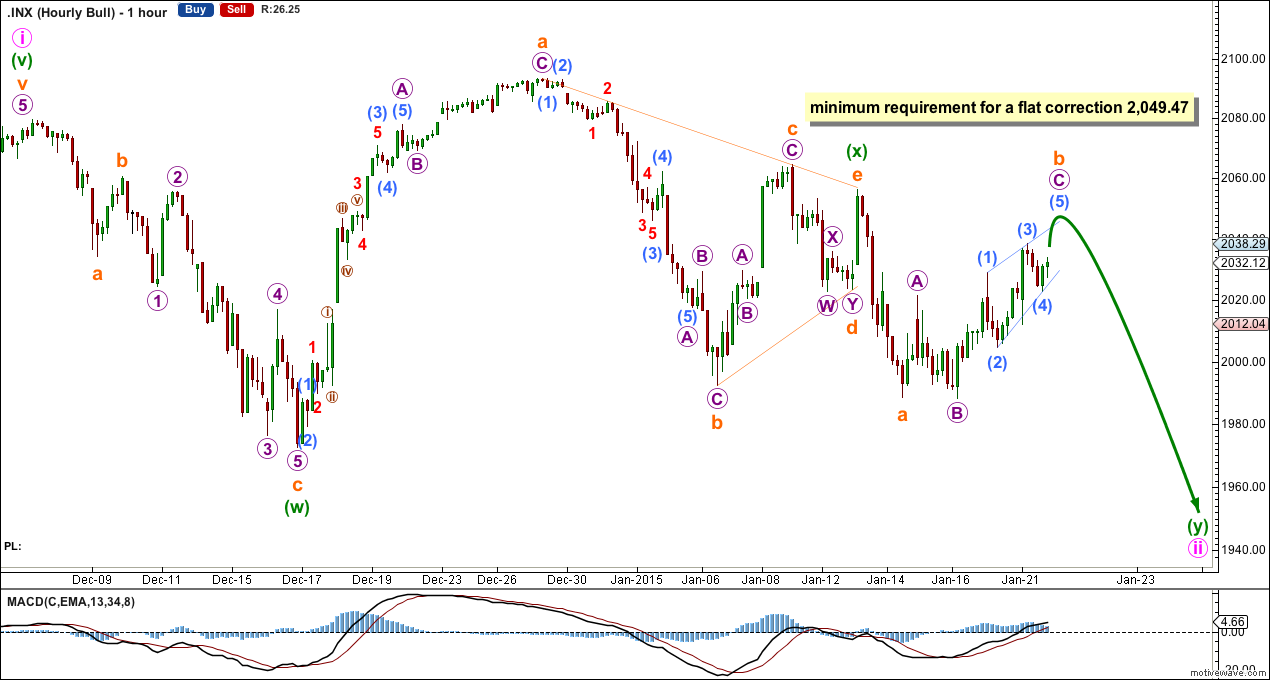
Minute wave ii looks like it is most likely unfolding sideways as a double combination: minuette wave (w) subdivides as a zigzag, minuette wave (x) is a completed “three” (triangles are classified as threes) in the opposite direction, and minuette wave (y) may be unfolding as a flat correction.
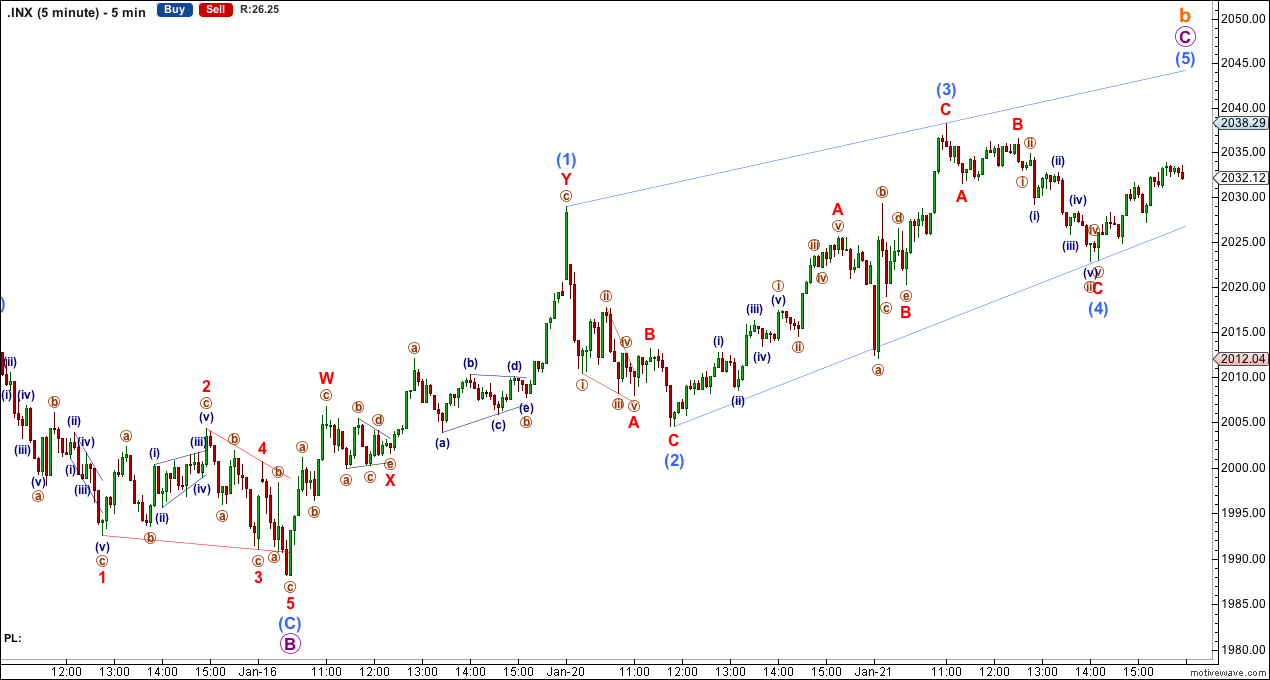
Within the flat of minuette wave (y) subminuette wave a is seen as a three wave structure. This downwards movement is ambiguous and can be seen on the five minute chart as either a three or a five.
If minuette wave (y) is to be a flat correction then within it subminuette wave b must reach a minimum 90% correction of subminuette wave a at 2,049.47. Subminuette wave b may make a new high above the start of subminuette wave a at 2,056.25. I am removing yesterday’s invalidation point because we must accept that subminuette wave a can be seen as either a three or a five, and so an invalidation point at its start is not certain to be held.
So far the structure of minute wave ii looks most likely to be a double combination because it is a sideways movement. The second structure in a double most commonly ends close to the same level as the first, and I would expect minuette wave (y) to end close to 1,972.56.
Alternate Bull Wave Count
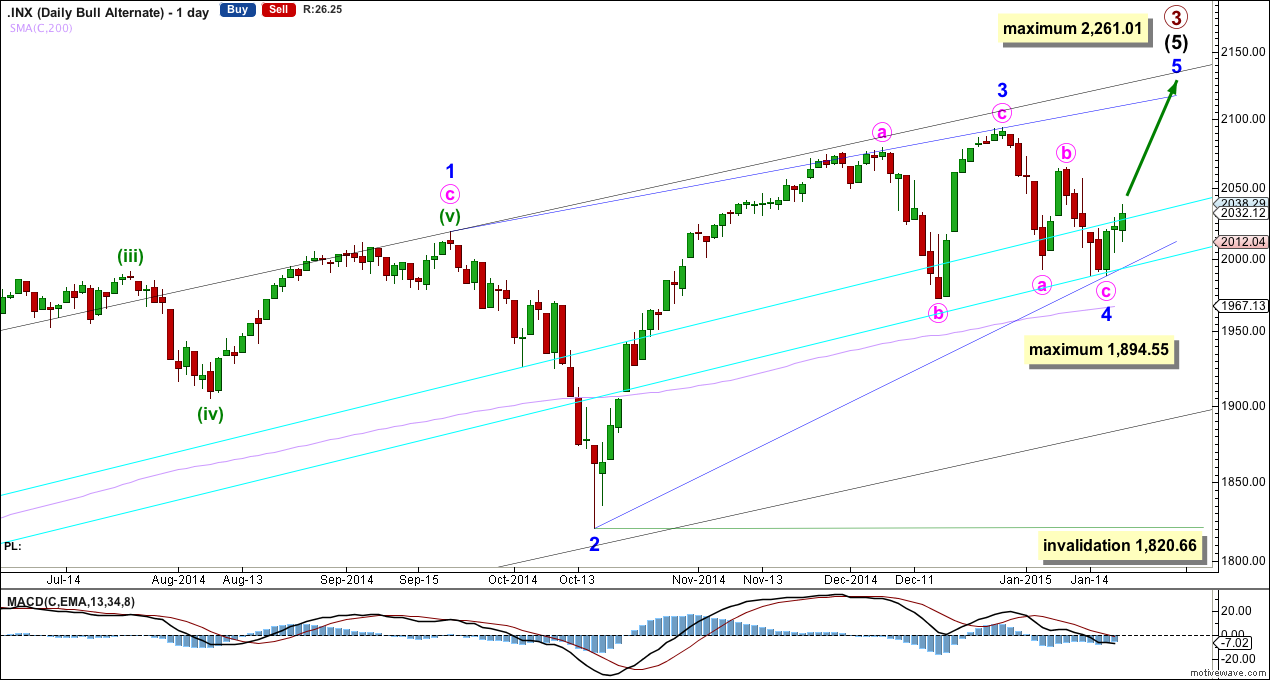
Looking at momentum for the whole of intermediate wave (5) I want to label minor wave 3 over at the high at 2,094 because this has the strongest upwards momentum. The only way this fits is if intermediate wave (5) is seen as an ending diagonal, because within an ending diagonal all the sub waves must be zigzags.
The diagonal is contracting: minor wave 3 is shorter than minor wave 1 and minor wave 4 is shorter than minor wave 2. If minor wave 4 were to extend any lower it may not be longer than equality in length with minor wave 2 below 1,894.55. Minor wave 4 must subdivide as a zigzag and must overlap back into minor wave 1 price territory. Minor wave 4 has met both of these conditions.
Minor wave 5 may not be longer than equality with minor wave 3, because the diagonal is contracting and a third wave may never be the shortest. This limit is at 2,261.01. However, I would expect minor wave 5 to come to an end well below this point, and should end with a slight overshoot of the 1-3 trend line as this is the most common place for fifth waves of contracting diagonals to end. This trend line is probably the best way to tell when this fifth wave should end.
Minor wave 1 lasted 228 days (5 short of a Fibonacci 233), minor wave 2 lasted 18 days, minor wave 3 lasted 51 days, and minor wave 4 lasted a Fibonacci 13 days. Minor wave 5 should be more brief than minor wave 3, and it may be about even in duration with minor wave 4. It may end in another 11 days time.
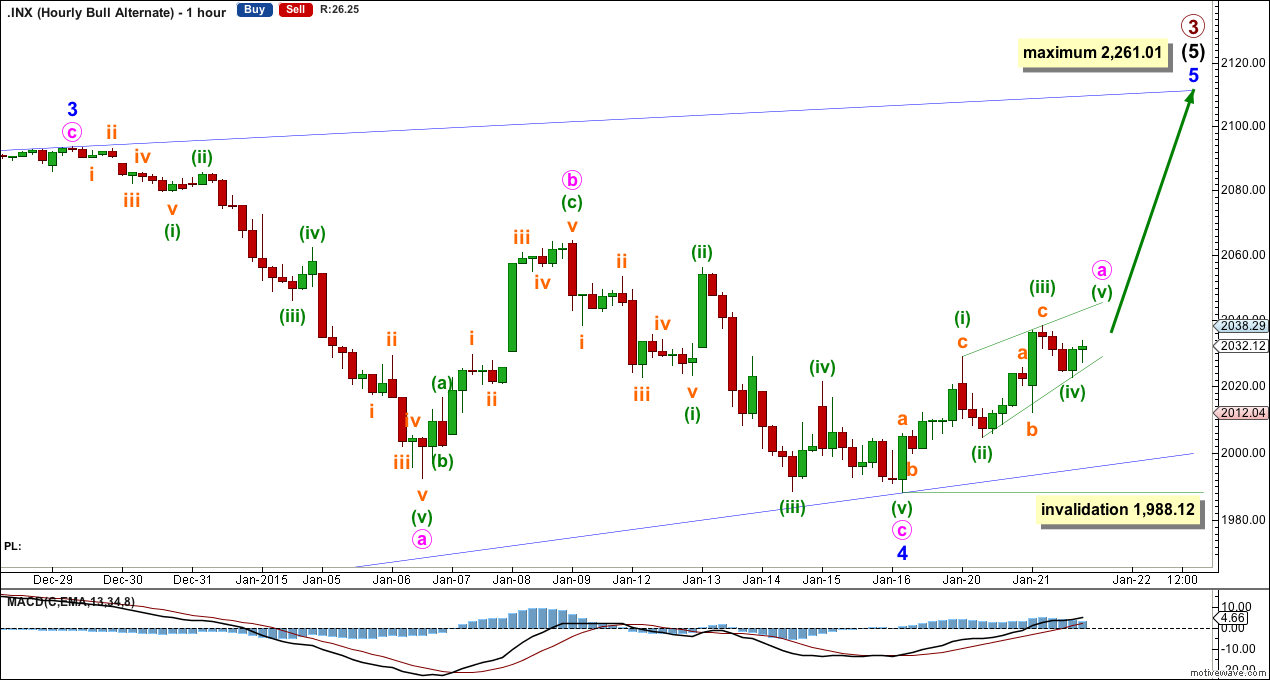
The subdivisions for this wave count fit perfectly on the hourly chart. Minor wave 5 may be beginning with a leading contracting diagonal for minute wave a. Minute wave b may not move below the start of minute wave a below 1,988.12. Downwards movement would be very likely to find strong support at the lower blue 2-4 trend line, which should not be overshot of this wave count is correct because diagonals normally adhere strongly to their trend lines.
Bear Wave Count
This bear wave count differs from the bull wave count at the monthly chart level and at super cycle wave degree. To see the historic picture go here.
The subdivisions within primary waves A-B-C are seen in absolutely exactly the same way as primary waves 1-2-3 for the bull wave count. The alternate bull wave count idea also works perfectly for this bear wave count.
At cycle degree wave b is over the maximum common length of 138% the length of cycle wave a, at 165% the length of cycle wave a. At 2,393 cycle wave b would be twice the length of cycle wave a and at that point this bear wave count should be discarded.
While we have no confirmation of this wave count we should assume the trend remains the same, upwards. This wave count requires confirmation before I have confidence in it.
This analysis is published about 10:49 p.m. EST.
I have a main and an alternate count.
I think I’m presenting these complicated ideas pretty clearly, but if its not working for you then perhaps Elliott wave is not something you want to use in your trading.
Money management, risk assessment and stop losses are essential for any / all traders. I have absolutely no control over the trades you place, but I will advise learning this boring but important aspect of trading.
I recommend the classic “Technical Analysis of Stock Trends” by Magee, especially chapters 27 “stop orders” and 42 “portfolio risk management”.
Obviously the analysis was wrong.
The next day updates it.
Because of the analysis i lost around 2k if the analysis fails then what is the working one???
Lara regarding hourly chart, Micro B made just an ever slight new low beyond Micro A. By definition isn’t this a regular flat where micro C should have terminated just beyond A?
Yes, subminuette wave b should be a regular flat.
Hi,
You advised it will go down to 1960 but it went back uptrend.
Any comments??