
Downwards movement was expected. Upwards movement remains below the invalidation point.
Summary: I expect downwards movement and a red candlestick for Tuesday’s session for a fifth wave which should be 93.23 points in length. If upwards movement breaches 1,926.03 the bullish wave count would increase in probability and the bearish wave count would decrease in probability.
Click on charts to enlarge.
Bearish Wave Count
All monthly, weekly and daily charts are on a semi-log scale.
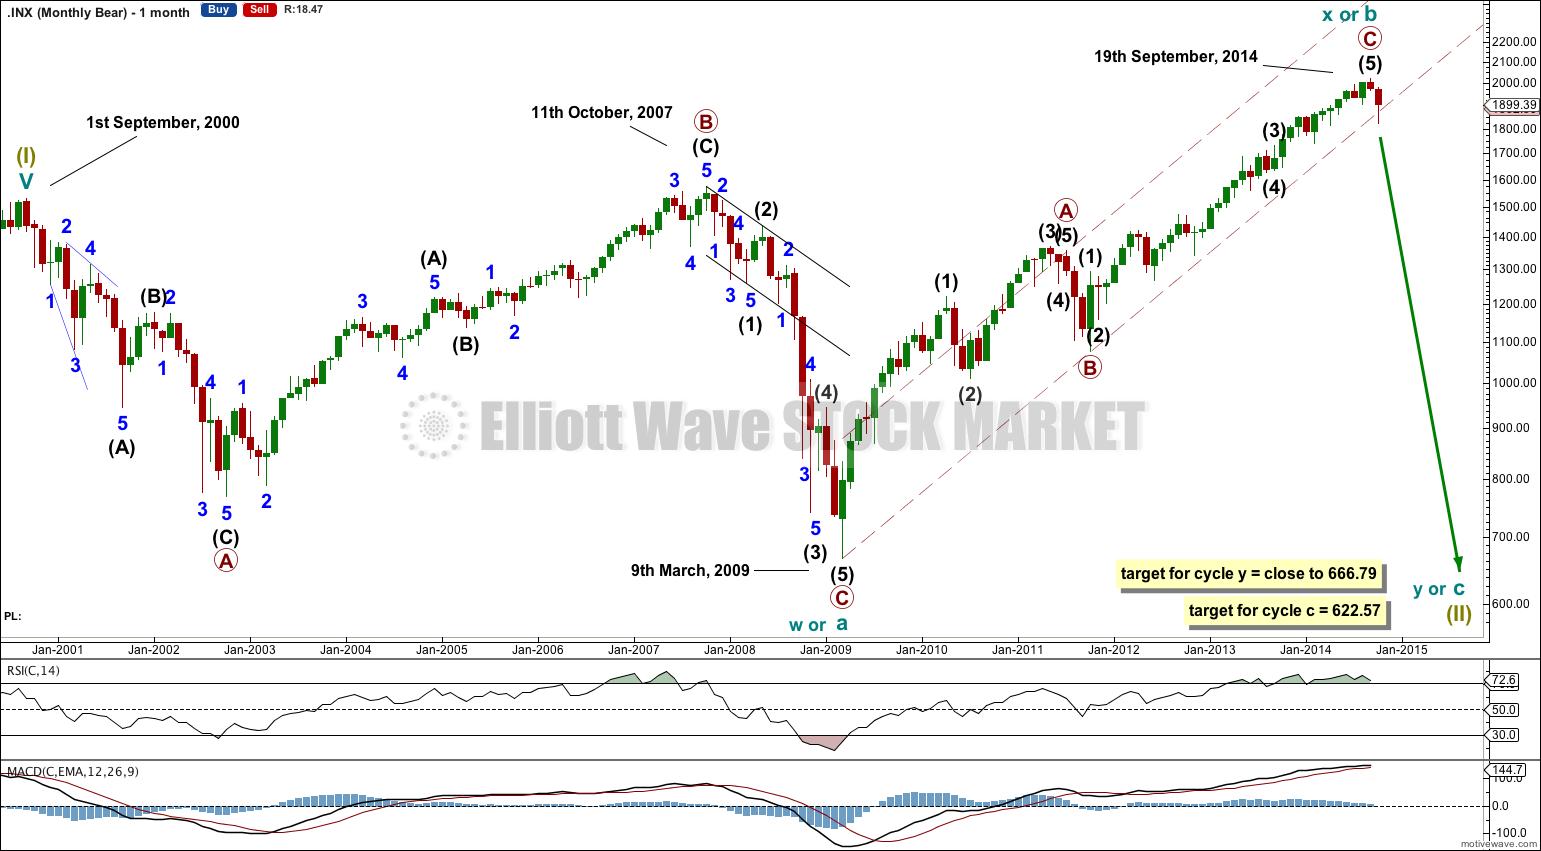
This bearish alternate wave count expects that the huge correction which began in 2000 is not over. The flat correction which ended at 666.79 was only cycle wave a (or w) of a larger super cycle second wave correction.
The structure and subdivisions within primary wave C for the bear wave count are the same as for intermediate wave (1) for the bull wave count because A-B-C and 1-2-3 subdivide in exactly the same way.
Cycle wave b (or x) is now longer than the maximum common length of 138% the length of cycle wave a for a B wave of a flat correction. It is 157% of cycle wave a. It is within the maximum length of 200% beyond which the wave count should be discarded.
The maroon – – – channel is now drawn differently for the bear and bull wave counts. For this bear wave count the maroon channel is a corrective channel about the upwards zigzag. Primary wave C remains within the corrective channel and sits in the lower half. This fits nicely for this bearish wave count. When this channel is breached by downwards movement that should provide trend channel confirmation that cycle wave b (or x) is over and cycle wave c (or y) has begun.
RSI has some divergence, continuing a pattern seen before the 2000 crash and 2007 crash.
Within cycle wave b (or x) the subdivisions within primary waves A, B and C are seen in exactly the same way as for the bull wave count. There is now a 5-3-5 zigzag upwards complete.
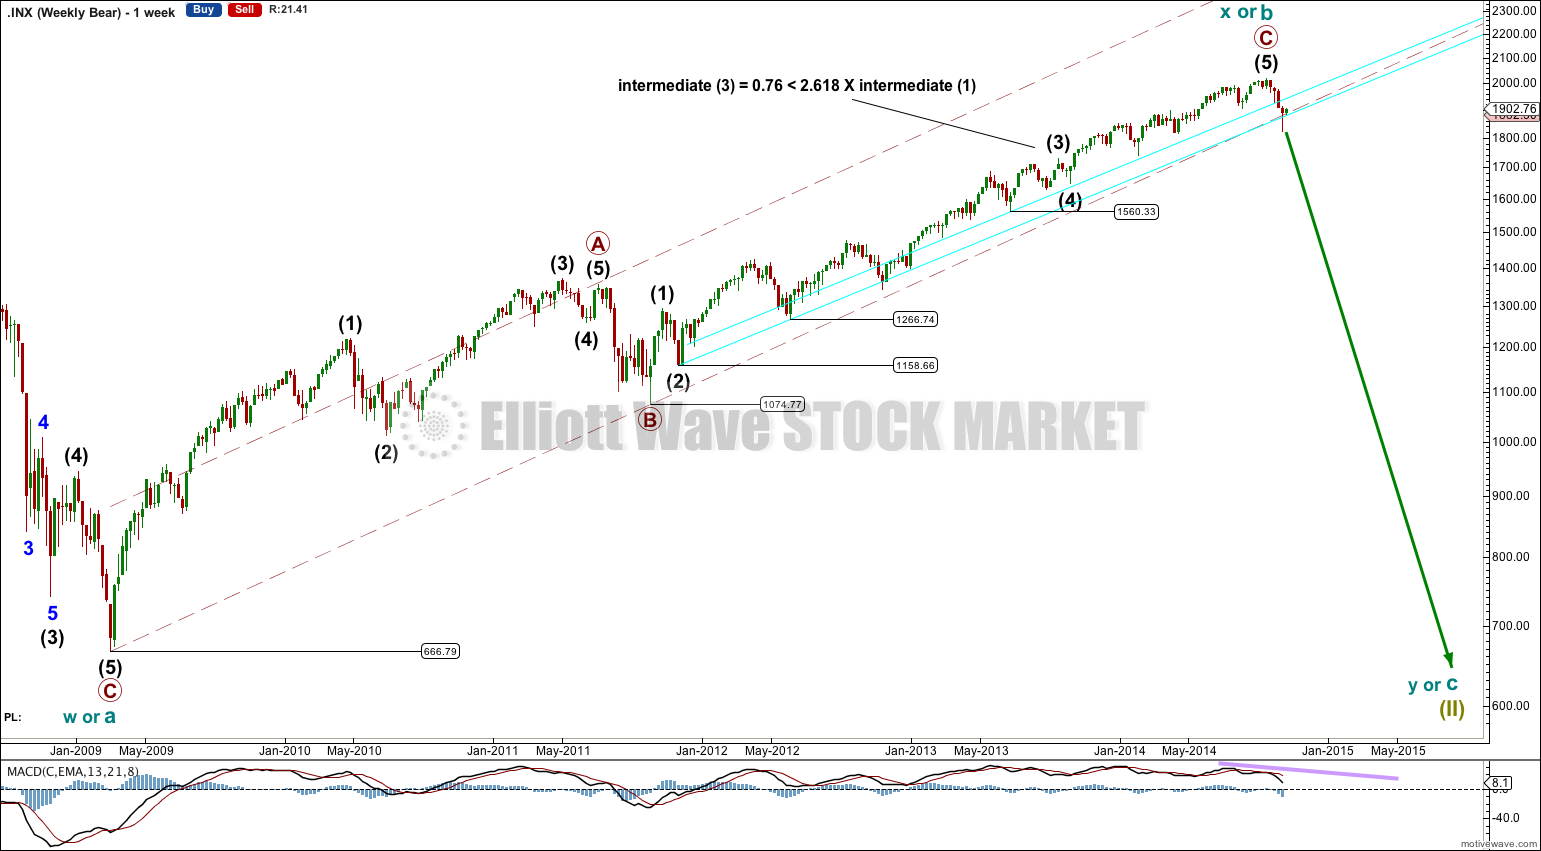
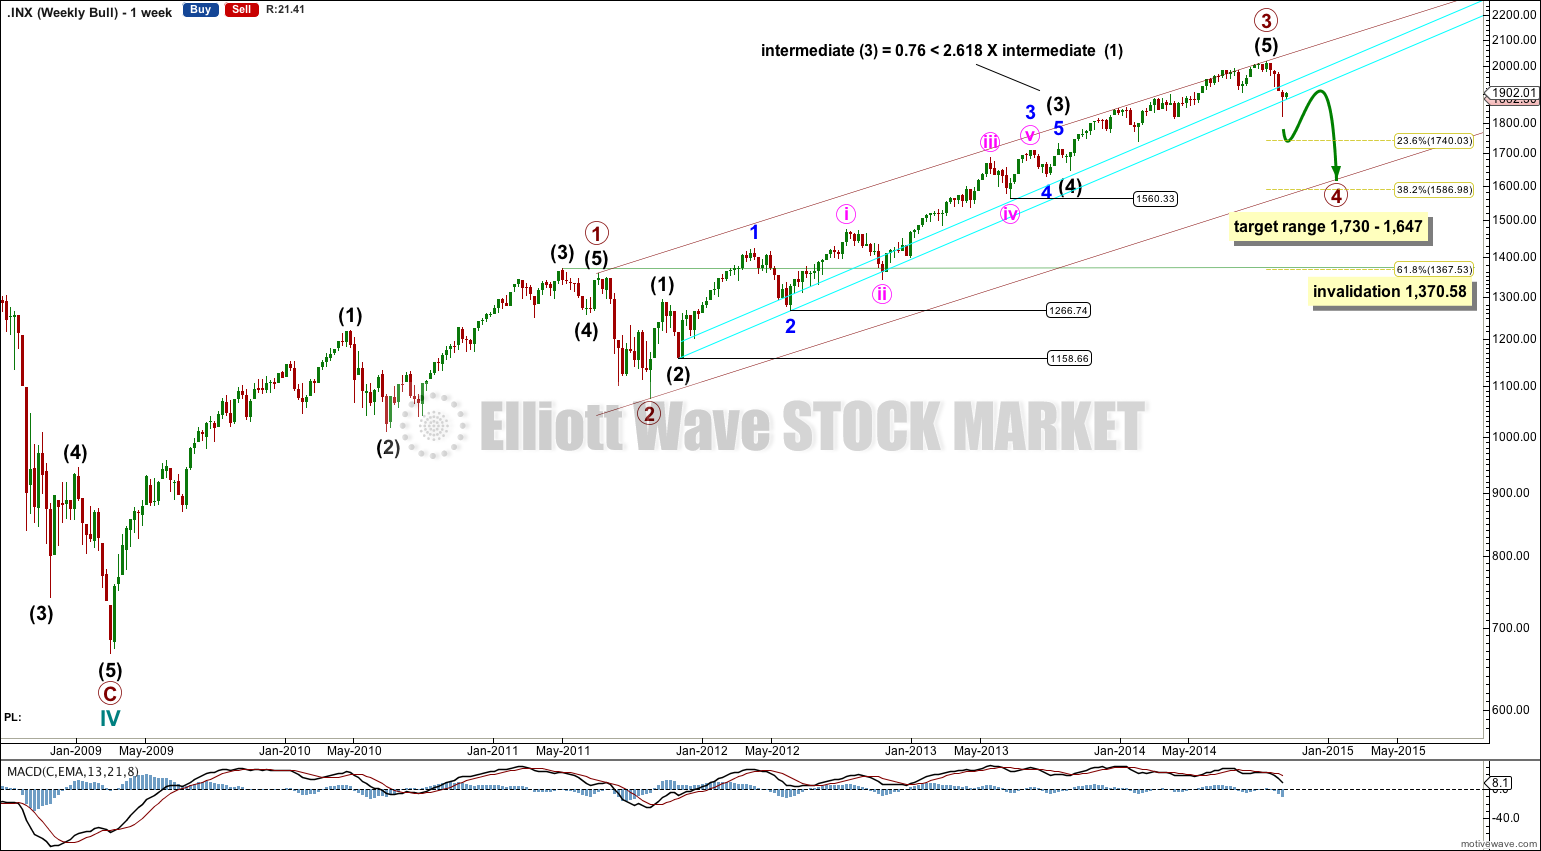
This weekly chart shows how to draw the double aqua blue trend lines. The lower trend line began back in 2011 has repeatedly been tested and is reasonably shallow which is highly technically significant. It has now been breached by more than 3% of market value indicating a trend change.
Draw the first trend line from the low of 1,158.66 on 25th November, 2011, to the next swing low at 1,266.74 on 4th June, 2012. Create a parallel copy and place it on the low at 1,560.33 on 24th June, 2013.
Because there is such a close Fibonacci ratio between intermediate waves (3) and (1) and intermediate wave (3) lasted 455 days, I am confident this labeling is correct. Intermediate wave (3) has the strongest upwards momentum within primary wave C.
There is technical divergence between price and MACD at the weekly and daily chart levels. This indicates a trend change.
For the first time in three years the lower edge of the maroon – – – channel about cycle wave b (or x) was breached. This is significant.
The bear wave count sees a huge super cycle wave (II) incomplete as either an expanded flat correction, a combination, or a double flat.
For the last 19 days as volume has increased it is down days which show higher volume. This may is some indication that the larger trend is downwards.
Minor wave 4 may not move into minor wave 1 price territory above 1,926.03.
To have full confidence in this bearish wave count, and to discard the bullish wave count, I want to see three things happen:
1. A clear five down on the daily chart, with completion of intermediate wave (1).
2. Confirmation from NASDAQ with a new swing low for that market below 3,414,11.
3. A new low below 1,370.58 (although using structure as a guide the bull wave count would probably be discarded before this point).
When we have those three things I will have full confidence in this wave count.
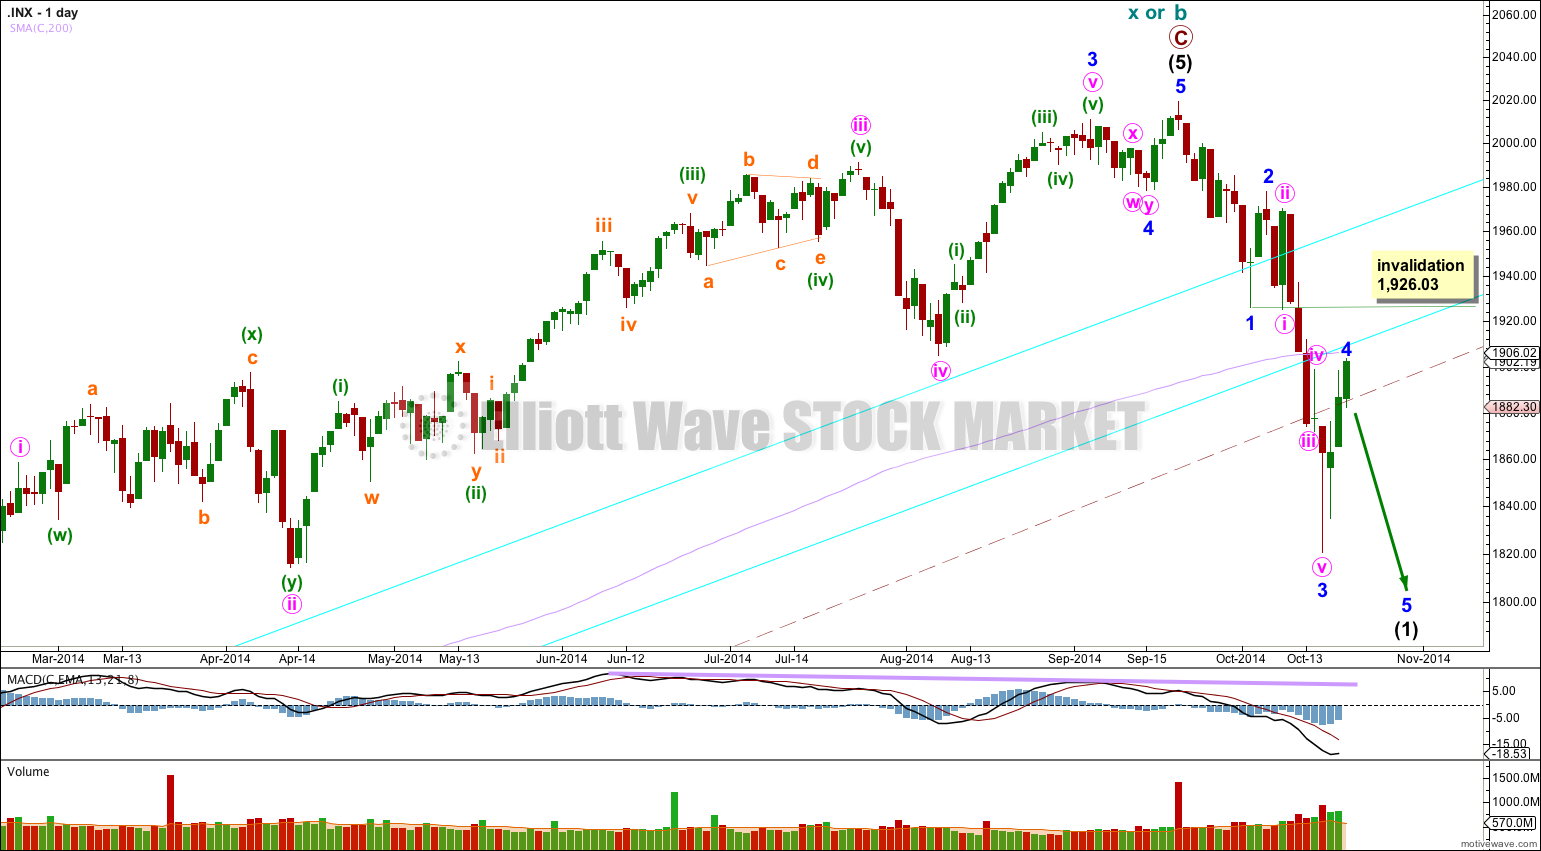
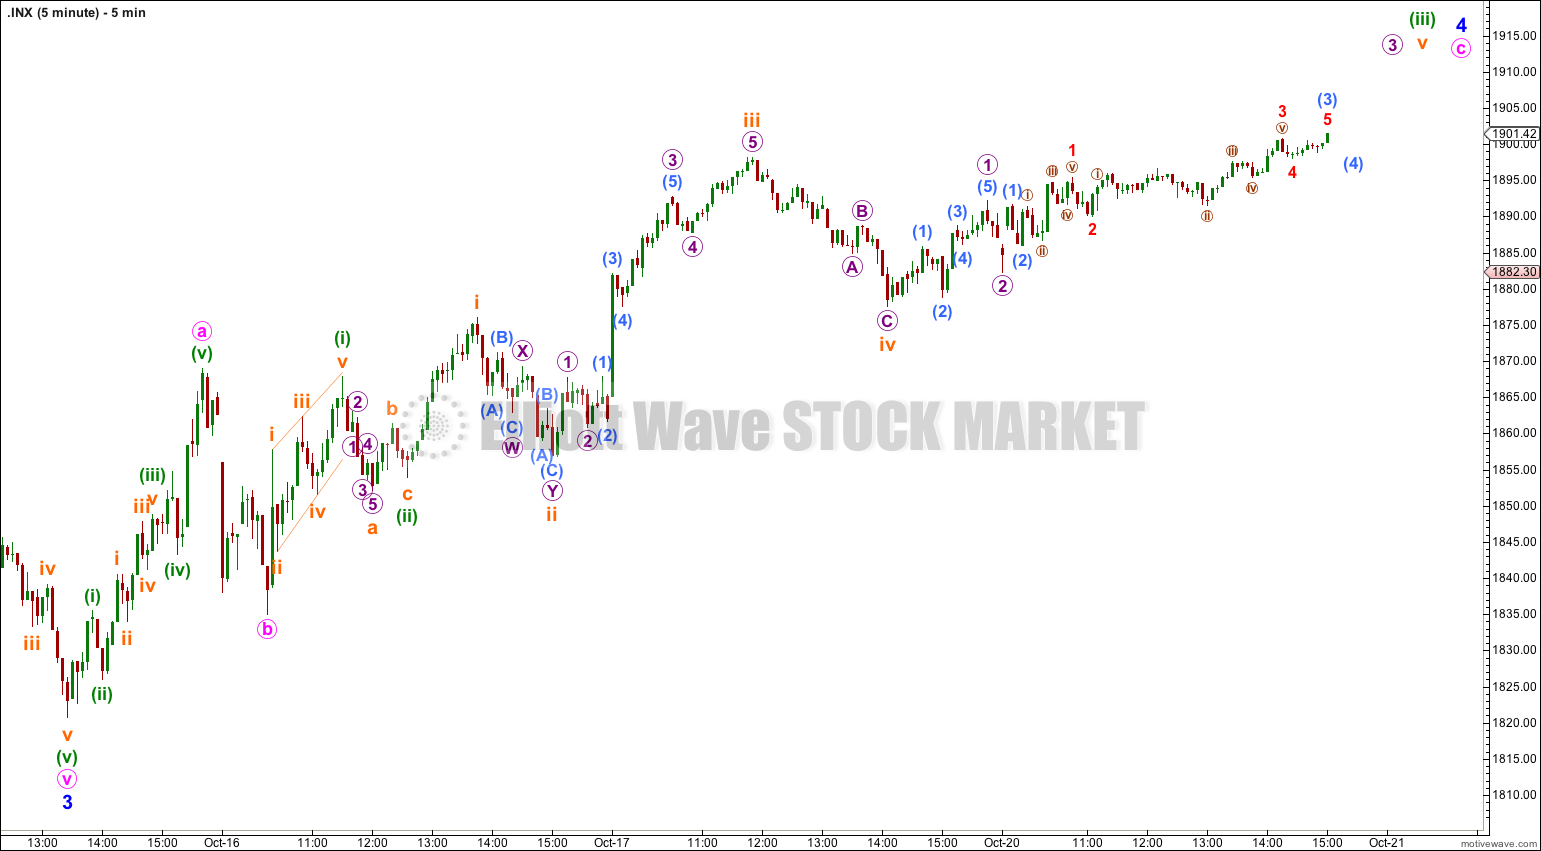
Minor wave 4 has continued higher. It is now above the price territory of the fourth wave of one lesser degree where it may have been reasonably expected to end. It may find resistance at the lower aqua blue trend line on the daily chart.
When minor wave 4 is a complete corrective structure then I would expect minor wave 5 downwards to most likely be 93.23 points in length to reach equality with minor wave 1. Minor wave 5 is extremely likely to make a new low below the end of minor wave 3 at 1,820.66 to avoid a truncation.
Minor wave 4 is no longer showing structural alternation with minor wave 2, which is a small cause for concern for this wave count today. Minor wave 2 was a 56% zigzag. Minor wave 4 is a zigzag closing in on the 0.618 ratio.
Minor wave 4 may not move into minor wave 1 price territory above 1,926.03.
When minor wave 4 is over the channel must be redrawn using Elliott’s second technique: draw the first trend line from the ends of minor waves 2 to 4 then place a parallel copy on the end of minor wave 3. Minor wave 5 may end about the lower edge of that channel.
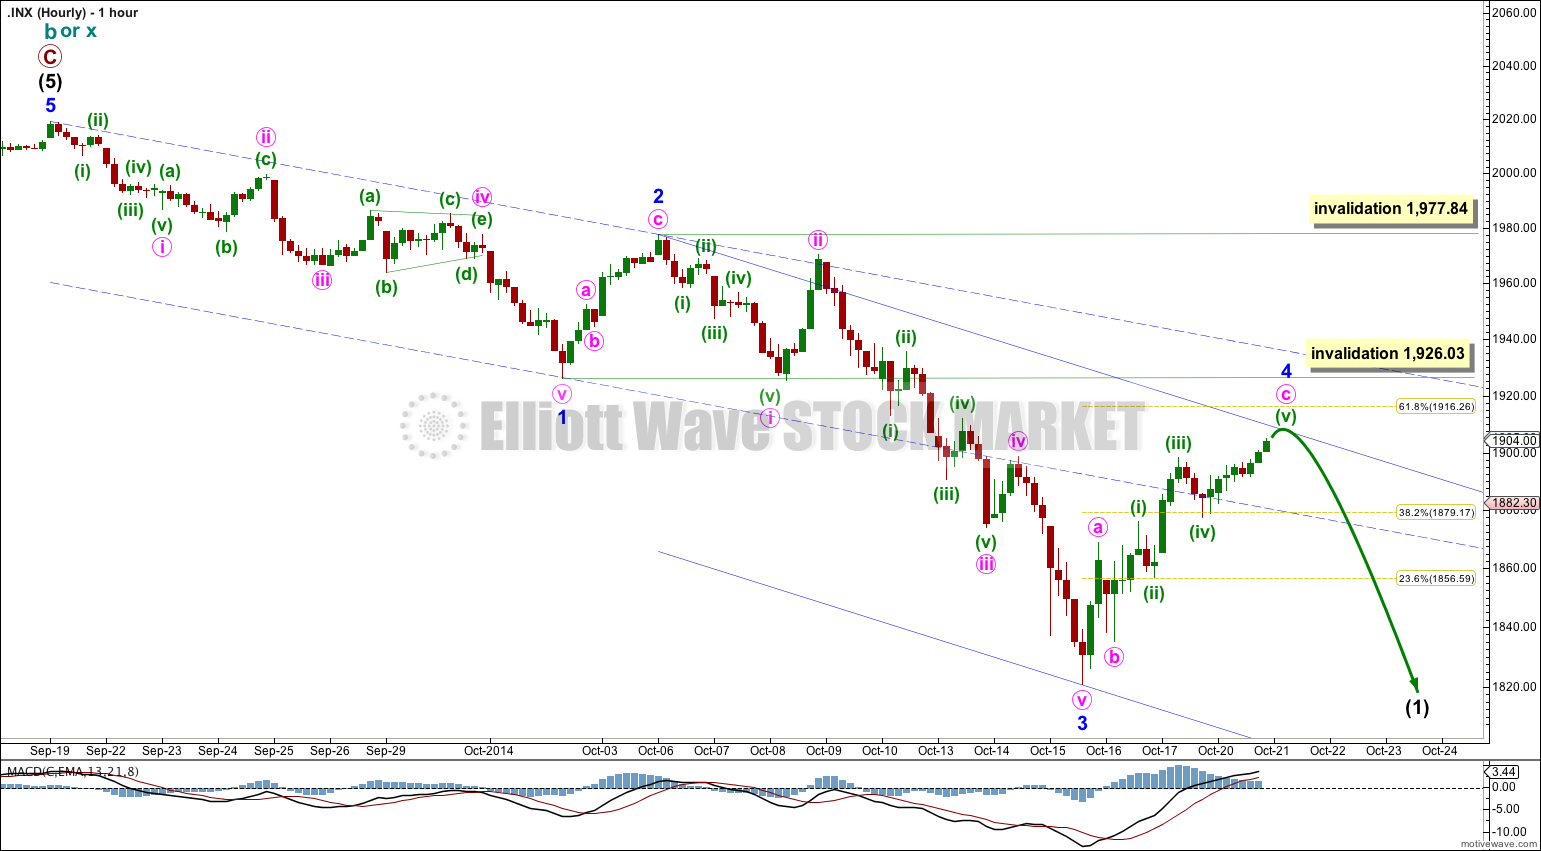
If price moves above 1,926.03 I would expect it to find resistance at the upper edge of the base channel about minor waves 1 and 2. Instead of considering an unlikely leading diagonal I would rather move the degree of labeling within minor wave 3 all down one degree, and see upwards movement as a minute degree second wave correction within an extending third wave for minor wave 3. The invalidation point for this idea is at 1,977.84. Minute wave ii should not breach a base channel (the blue — channel) drawn about minor waves 1 and 2.
Bullish Wave Count
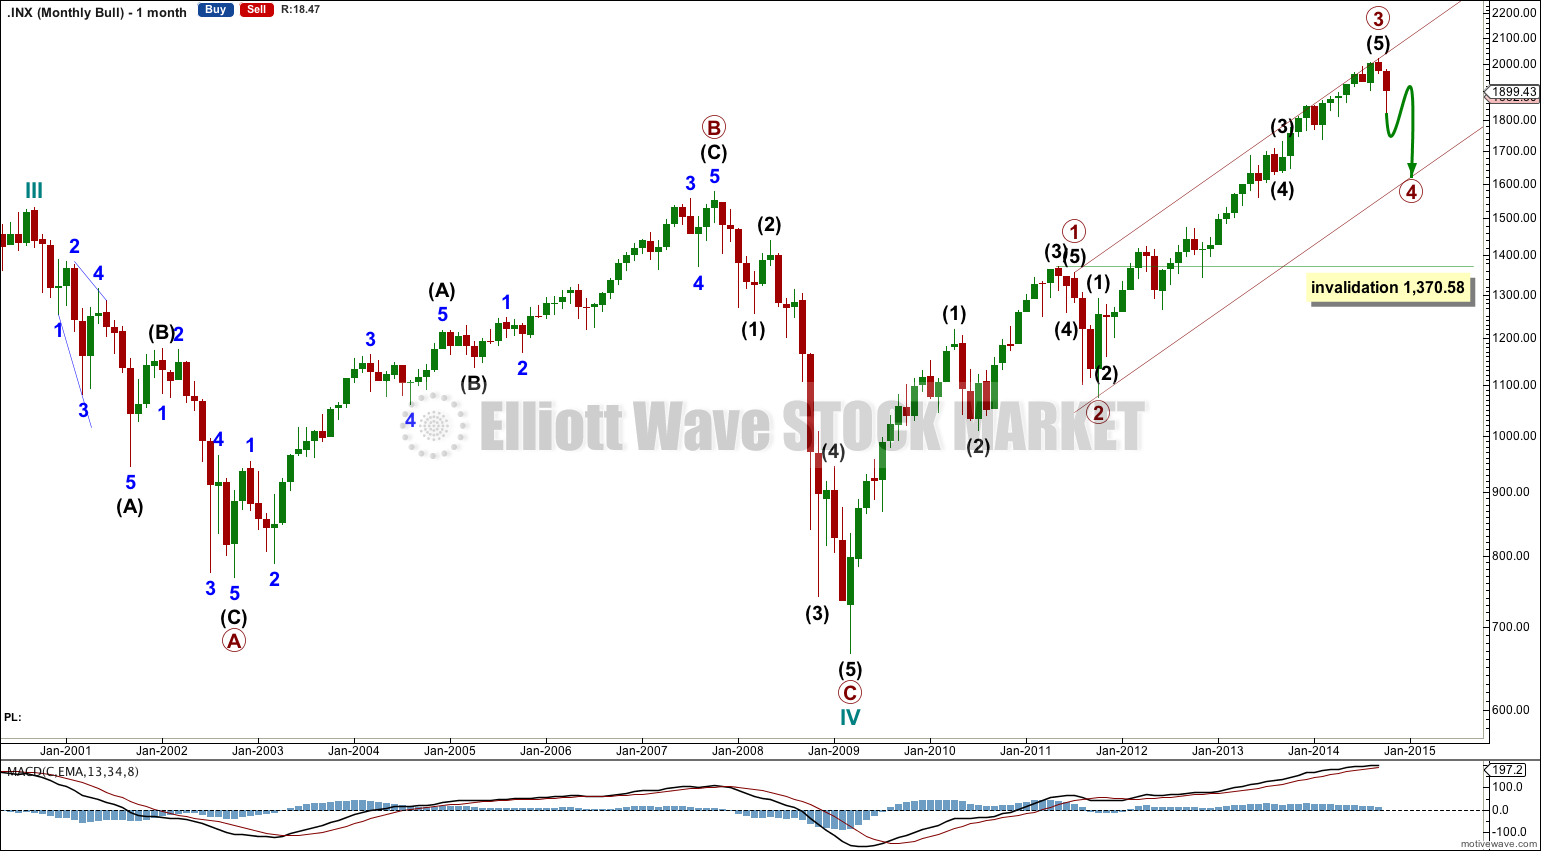
This monthly wave count expects that super cycle wave (I) is not over and the huge correction ending with the credit crunch was the end of cycle wave IV. Cycle wave V upwards is incomplete.
The maroon channel is here an Elliott channel about the upwards impulse of cycle wave V. The first trend line is drawn from the ends of primary waves 1 to 3, then a parallel copy is placed on the end of primary wave 2. Primary wave 4 may find support at the lower edge of this channel.
A base channel about primary waves 1 and 2 has not been breached to the upside by primary wave 3 as it should. However, looking back to 1974 a prior cycle degree wave there had a primary wave 3 which behaved in the same way. Base channels often work, but not always.
Primary wave 4 may end within the price territory of the fourth wave of one lesser degree. Intermediate wave (4) price territory is from 1,730 to 1,647.
Primary wave 2 was a 41% zigzag correction. I would expect primary wave 4 to show alternation in structure so most likely it will be a flat, combination or triangle. All of these structures may include a new price extreme beyond the start of intermediate wave (A), so they could see a new high. If that happens the bear wave count would be strongly invalidated with its current labeling.
Primary wave 2 lasted a Fibonacci 13 weeks. Zigzags tend to be more brief structures. I would expect primary wave 4 to last at least 13 weeks, and it may last up to a Fibonacci 21 weeks if it is a more time consuming structure like a combination or triangle.
It is too early to label primary wave 4 as over because it has lasted only 4 weeks and would be a zigzag so have no structural alternation with the zigzag of primary wave 2.
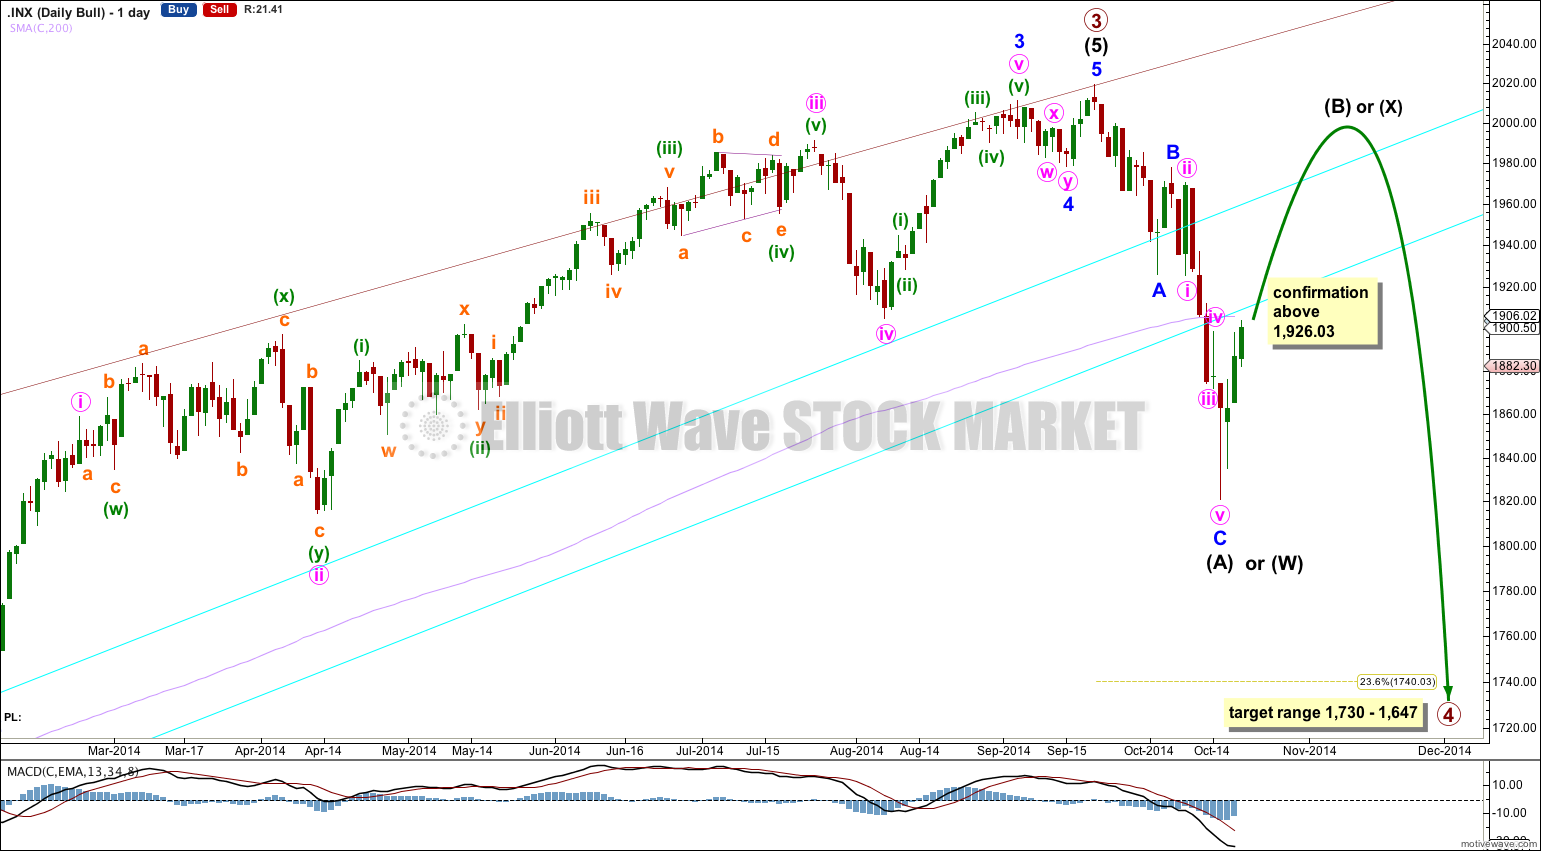
However, my degree of labeling for this downwards movement may be one degree too high. If we see a five down complete then I would move the degree of labeling for this bull wave count down one degree within primary wave 4, which could be only minor wave A of a zigzag for intermediate wave (A).
Because primary wave 4 is most likely to be a flat, triangle or combination, the first movement down is most likely to subdivide as a three wave structure.
If intermediate wave (A) is over then primary wave 4 may be a flat or triangle. Intermediate wave (B) may make a new high above the start of intermediate wave (A) at 2,019.26 as in an expanded flat or running triangle.
If primary wave 4 is a combination then the first structure in the double may be a completed zigzag for intermediate wave (W).
The subdivisions within downwards movement are the same for both wave counts because A-B-C and 1-2-3 subdivide the same way.
Movement above 1,926.03 would confirm this downwards wave as a completed three. At that stage a new high is possible.
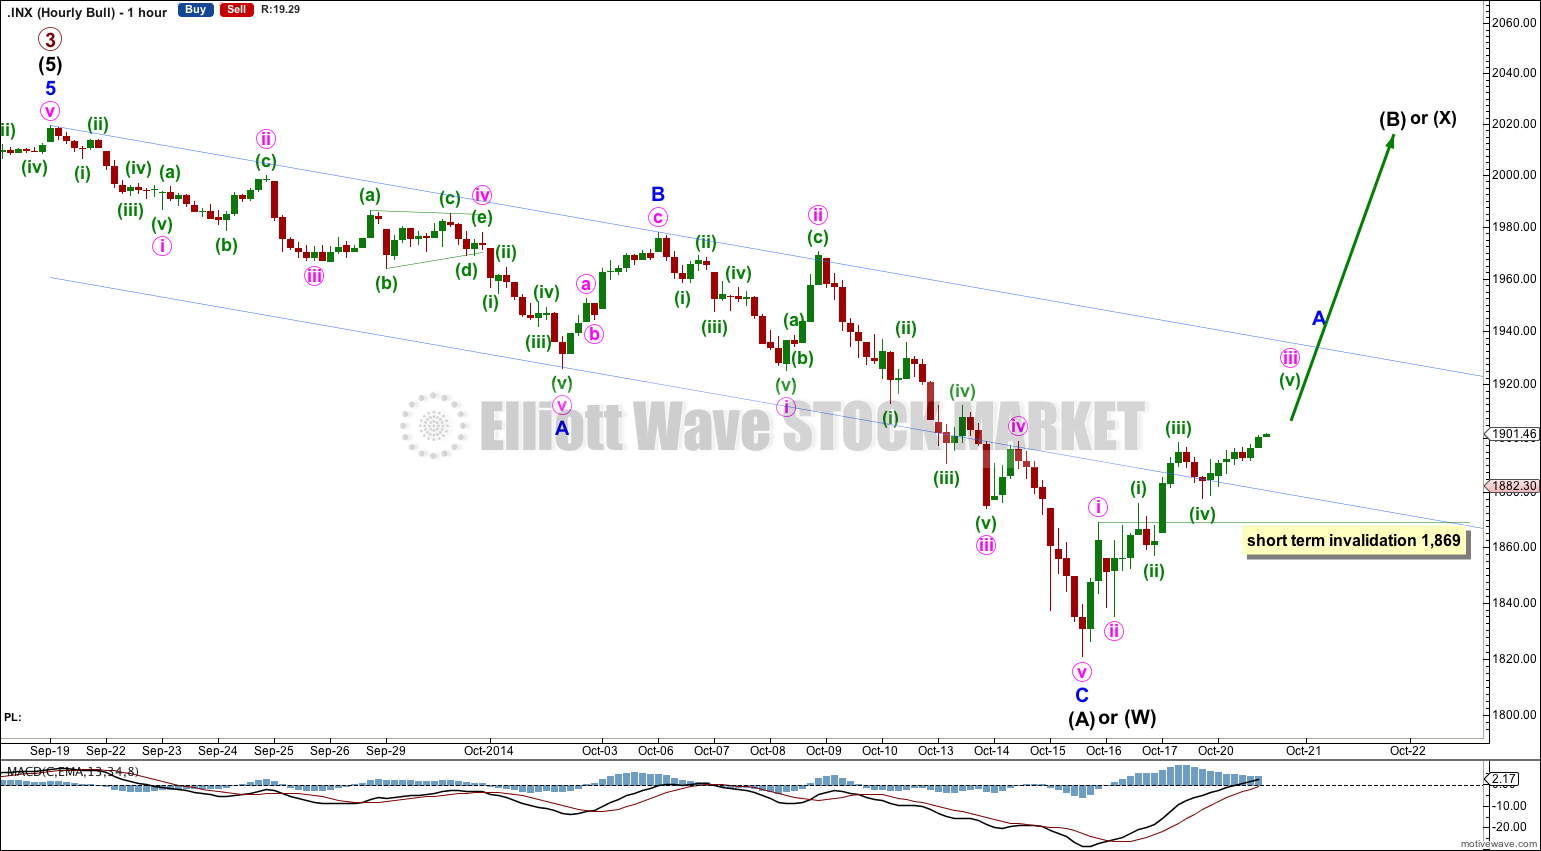
Within minor wave A upwards minute wave iv may not move into minute wave i price territory below 1,869.
This analysis is published about 04:27 p.m. EST.
Hello Lara,
Current upward movement does not appear as wave 4. I think it’s either 1st wave of bull cycle or second wave of bearish cycle and behavior between 1920-1940 ( 50-61.8%) retracment will clarify things. This movement looks too strong for wave4.
I think 5 down is completed .
Thanks
Aseem
I agree, and the market agrees with you today.
However, if you see a five down complete then a chart of how you see that working would be necessary for that idea to be taken seriously.
this is from few days ago, with Fibonacchi levels
I’m sorry Aseem, but your labels are extremely vague and there is no indication of how you see each wave subdividing. That’s actually very important if its to be considered seriously as an EW count.
Labels for each wave should be placed at the end of the wave, and it has to be clear that each wave subdivides correctly, particularly a third wave.
In this instance it doesn’t matter too much, I can see exactly how that downwards movement can subdivide as an impulse on the hourly chart. And the upwards correction we are expecting is exactly the same.
But for future reference clearer labeling would be required. Cheers.