
A little more upwards movement to 2,081 was expected before the market saw any downwards movement. This is not what happened.
Summary: It is possible again that Monday saw a trend change. However, we should always assume the trend remains the same until proven otherwise. While there is no confirmation of a trend change we should assume the trend remains up, and the target is at 2,087 – 2,089. If we see a new low below 2,049.57 in the short term the possibility of a trend change will increase.
Click on charts to enlarge.
Bull Wave Count
I will favour neither the bull or bear wave count. Both are viable and both expect this current upwards impulse may again be close to completion.
To see a weekly chart with subdivisions and how to draw trend lines and channels click here.
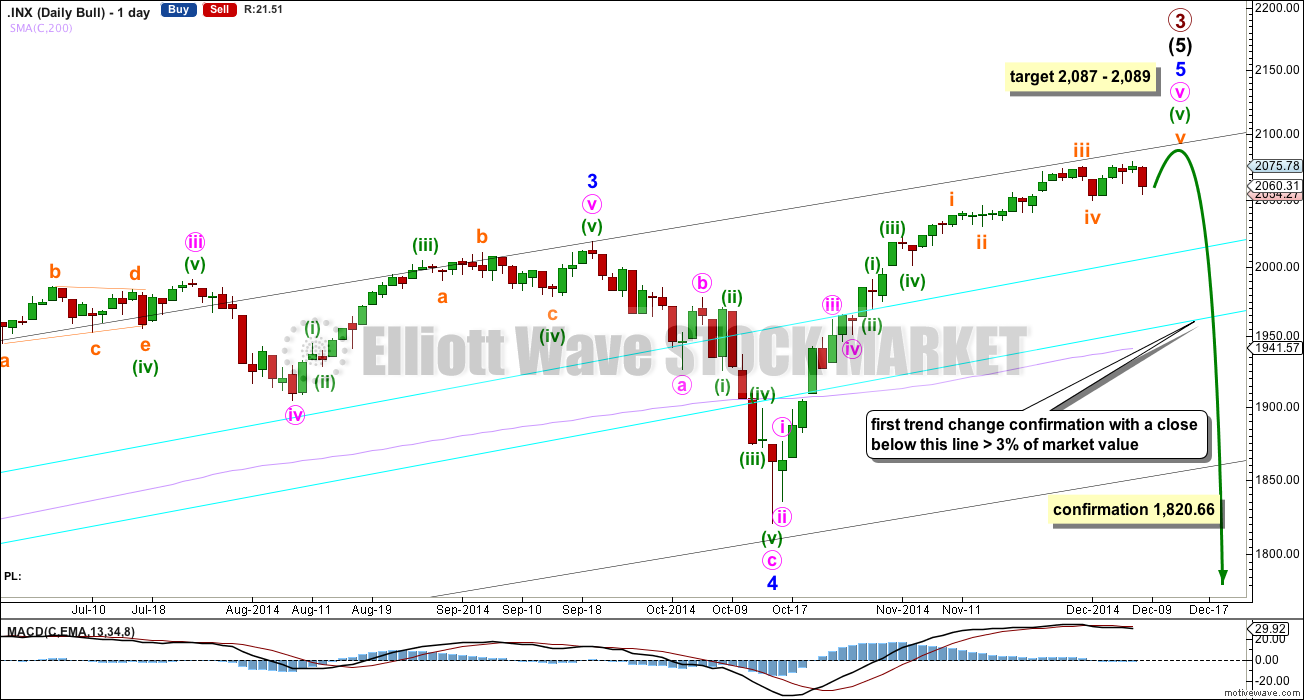
Upwards movement from the low at 666.79 subdivides as a complete 5-3-5. For the bull wave count this is seen as primary waves 1-2-3.
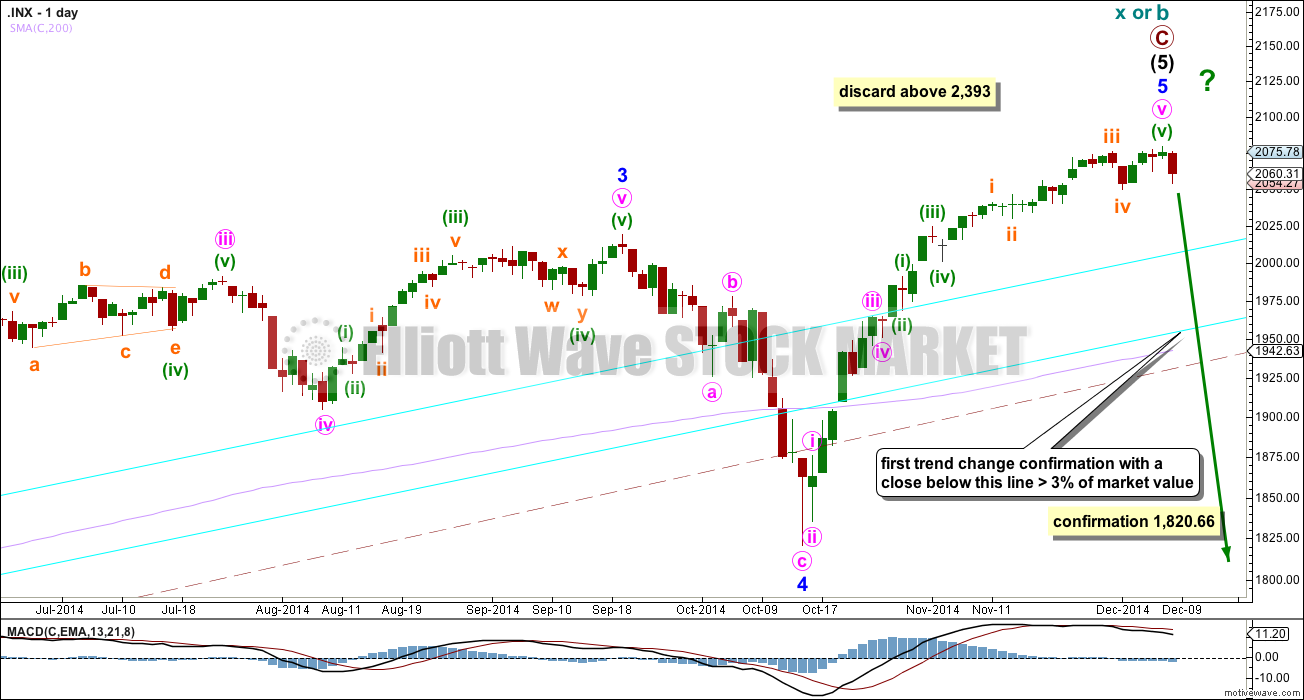
Within intermediate wave (5) minor wave 2 is an expanded flat and minor wave 4 is a zigzag. Minor wave 3 is 14.29 points longer than 1.618 the length of minor wave 1.
At intermediate degree there is also a very close relationship between intermediate waves (3) and (1): intermediate wave (3) is just 0.76 points less than 2.618 the length of intermediate wave (1).
The aqua blue trend lines are traditional technical analysis trend lines. These lines are long held, repeatedly tested, and shallow enough to be highly technically significant. When the lower of these double trend lines is breached by a close of 3% or more of market value that should indicate a trend change. It does not indicate what degree the trend change should be though.
There is still triple technical divergence between MACD and price at the weekly chart level.
I would expect the final top to form a slow curving structure, like a double head and shoulders or a rounding top. At the high volume should be low. Once the high is in place the new downwards trend may begin with slow movement, and deep second wave corrections. These would form two right hand shoulders, or the right hand side of a rounding top. When the neckline is formed, and eventually broken I would not expect to see an increase in volume, but I would expect to see an increase in momentum.
Movement below 1,820.66 could not be a second wave correction within minor wave 5, and so at that stage the final fifth wave would have to be over. A trend change at primary (bull count) or cycle degree (bear count) would be confirmed.
Main Hourly Wave Count
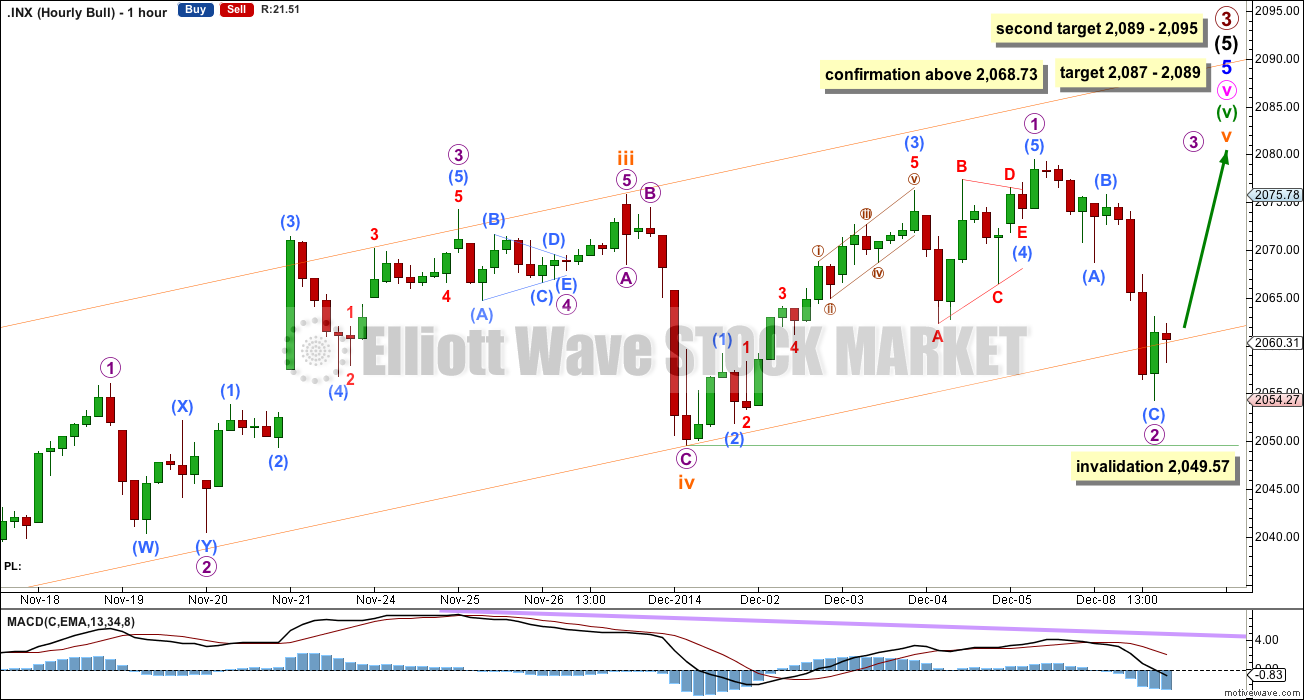
The last main hourly wave count was invalidated by downwards movement. Either subminuette wave v is over (as per the alternate below) or only micro wave 1 within it is over. Micro wave 2 may not move beyond the start of micro wave 1 below 2,049.57.
At 2,087 subminuette wave v would reach equality in length with subminuette wave i. At 2,089 minuette wave (v) would reach 2.618 the length of minuette wave (i). This target may be too low though, and expects a short third wave and an even shorter (maybe truncated?) fifth wave to complete subminuette wave v.
If price rises through the first target then the next likely target is at 2,089 to 2,095 where subminuette wave v would reach equality in length with subminuette wave iii.
Alternate Hourly Wave Count
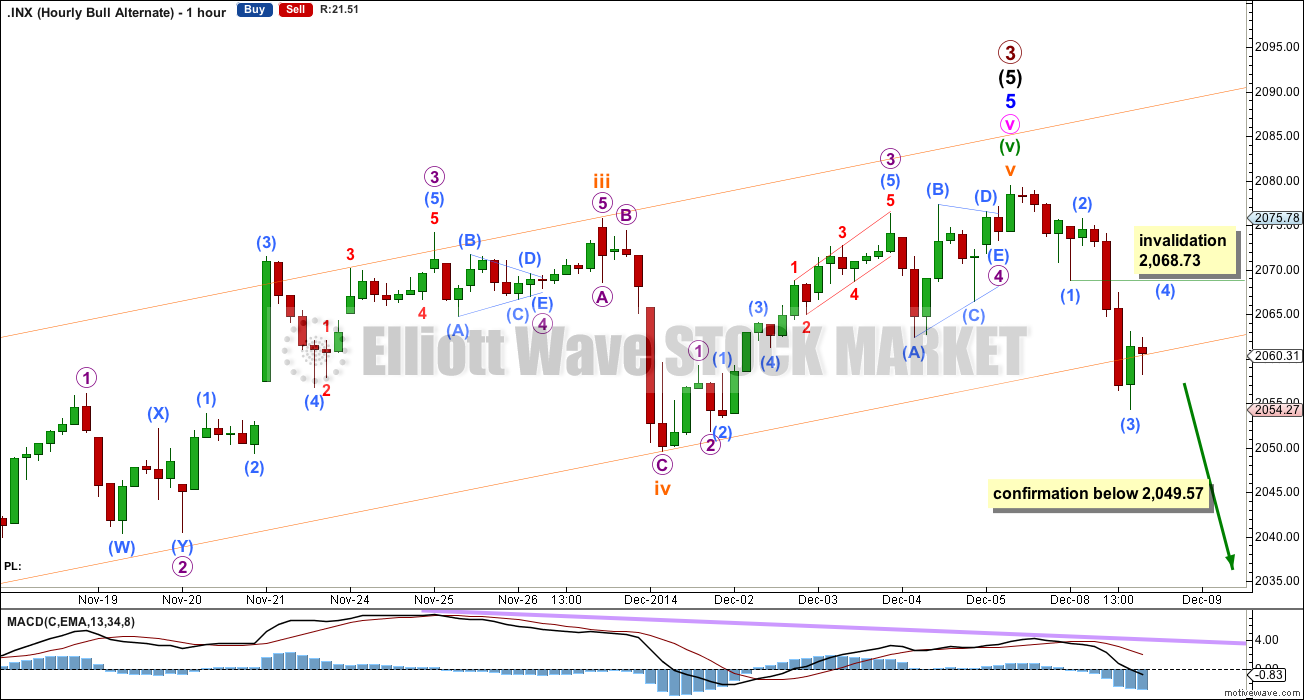
This alternate simply moves the degree of labelling within subminuette wave v all up one degree. It is entirely possible again that primary wave 3 is complete at all wave degrees. This trend change is unconfirmed. It will remain unconfirmed while the aqua blue trend lines are not breached, and while price remains above 1,820.66 on the daily chart.
If we have had a trend change then Fibonacci ratios within the completed structure are:
Within primary wave 3: intermediate wave (3) is just 0.76 points less than 2.618 the length of intermediate wave (1), and intermediate wave (5) has no Fibonacci ratio to either of intermediate waves (1) or (3).
Within intermediate wave (5): minor wave 3 is 14.29 points longer than 1.618 the length of minor wave 1, and minor wave 5 is just 1.62 points short of 1.618 the length of minor wave 1.
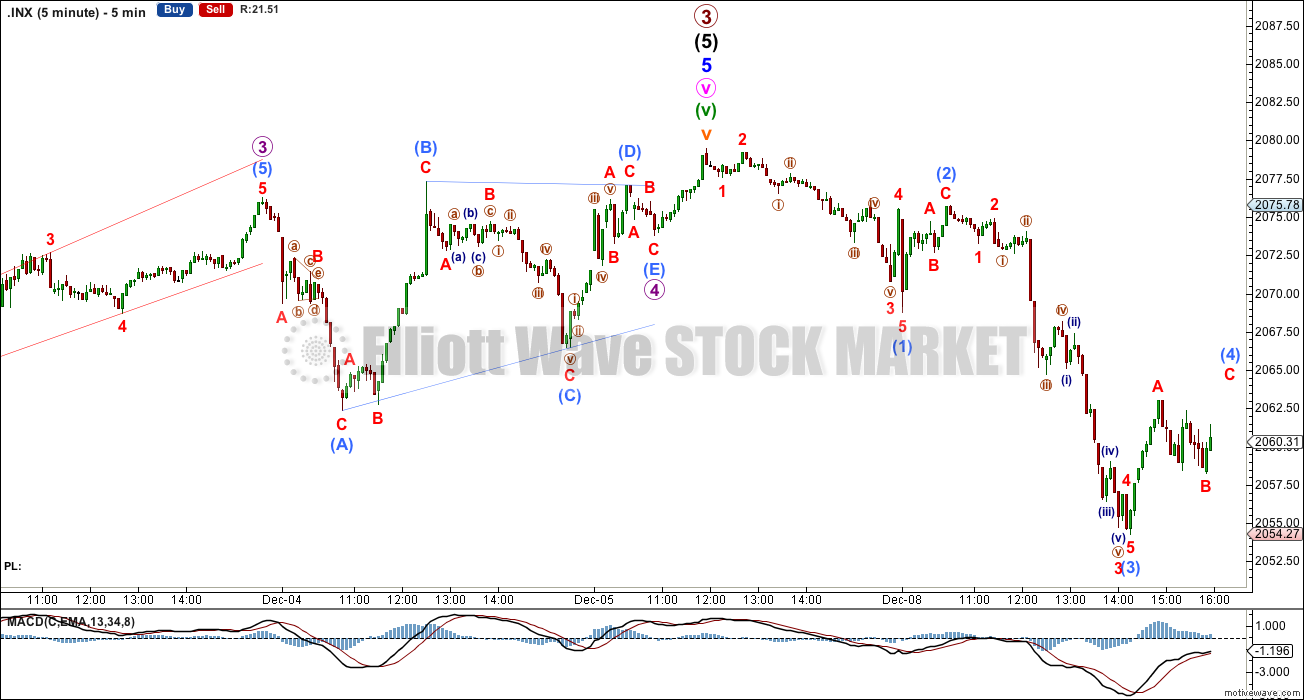
Within minor wave 5: minute wave iii is just 0.38 points longer than 2.618 the length of minute wave i, and minute wave v is 5.25 points short of equality in length with minute wave iii.
Within minute wave v: there is no Fibonacci ratio between minuette waves (ii) and (i), and minuette wave (v) is just 0.13 points longer than 1.618 the length of minuette wave (iii).
Within minuette wave (v): there is no Fibonacci ratio between subminuette waves iii and i, and subminuette wave v is 1.89 points longer than 0.618 the length of subminuette wave iii.
A new low below 2,049.47 would indicate a trend change, but it does not indicate what degree the trend change may be. If that happens this week then this alternate wave count would remain an alternate. My main wave count would move everything within minor wave 5 down one degree and expect that downwards movement is a second wave correction within minor wave 5. We should always assume the trend remains the same, until proven otherwise. The trend is your friend.
In the short term if there has been a trend change (of any degree) then a clear five down should be seen first on the hourly chart, then on the daily chart. In the short term within this first five down the fourth wave correction may not move into first wave price territory above 2,068.73.
To have confidence in a trend change at primary degree (or for the bear count at cycle degree) I want to see the following things (probably in this order):
1. A clear five down on the hourly chart.
2. A new low below 2,049.57.
3. A clear five down on the daily chart.
4. A breach of the lower aqua blue trend line by a close of more than 3% of market value.
5. A new low below 1,820.66.
Following that it should be the structure which shows which wave count is correct: bull or bear.
Bear Wave Count
This bear wave count differs from the bull wave count at the monthly chart level and at super cycle wave degree. To see the historic picture go here.
The subdivisions within primary waves A-B-C are seen in absolutely exactly the same way as primary waves 1-2-3 for the bull wave count.
At cycle degree wave b is over the maximum common length of 138% the length of cycle wave a, at 161% the length of cycle wave a. At 2,393 cycle wave b would be twice the length of cycle wave a and at that point this bear wave count should be discarded.
This analysis is published about 07:54 p.m. EST.
Hi Lara, can you please tell me where you get your INX data from because I am using the SPX 500 from FXCM and often it looks quite different from your data?
I’m using a Google / Yahoo data feed to this.
I also have it on my FXCM data feed and I notice the difference too.
I don’t know why it is different.
The Google / Yahoo feed should be the cash data.