
Another green candlestick was expected for Wednesday up to the target at 2,049. This is not what happened.
Summary: Again, upwards movement could be over with a complete structure. I expect downwards movement from here for at least one week. The depth and structure will indicate the degree of the new down wave.
Click on charts to enlarge.
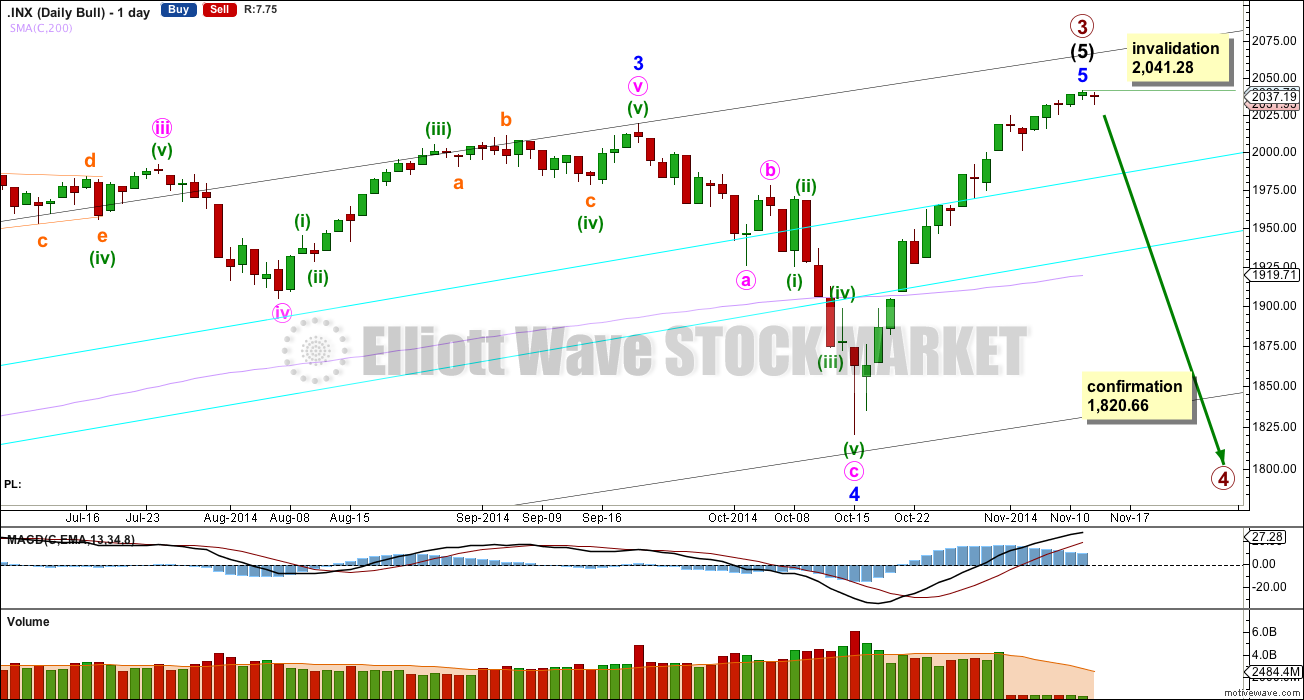
Bull Wave Count
I will favour neither the bull or bear wave count. Both are viable and both expect this current upwards impulse may again be over.
To see a weekly chart with subdivisions and how to draw trend lines and channels click here.
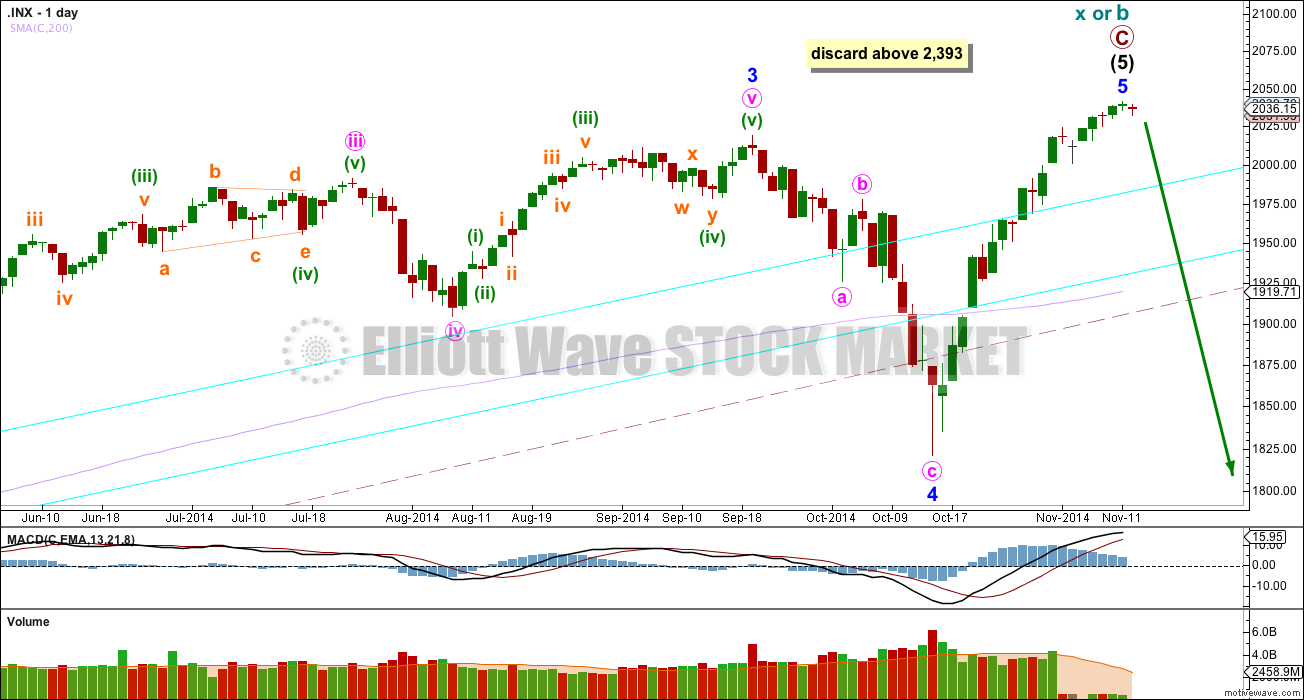
Upwards movement from the low at 666.79 subdivides as a complete 5-3-5. For the bull wave count this is seen as primary waves 1-2-3.
Within intermediate wave (5) minor wave 2 is an expanded flat and minor wave 4 is a zigzag. Minor wave 3 is 14.29 points longer than 1.618 the length of minor wave 1.
At intermediate degree there is also a very close relationship between intermediate waves (3) and (1): intermediate wave (3) is just 0.76 points less than 2.618 the length of intermediate wave (1).
The aqua blue trend lines are traditional technical analysis trend lines. These lines are long held, repeatedly tested, and shallow enough to be highly technically significant. When the lower of these double trend lines is breached by a close of 3% or more of market value that should indicate a trend change. It does not indicate what degree the trend change should be though.
There is still double technical divergence between MACD and price at the weekly chart level.
There is now no longer technical divergence between price and MACD at the daily chart level.
I would expect the final top to form a slow curving structure, like a double head and shoulders or a rounding top. At the high volume should be low. If the data from Google/Yahoo data feed is correct then for the last seven days volume has been quite low. This may be indicative of a high forming. Once the high is in place the new downwards trend may begin with slow movement, and deep second wave corrections. These would form two right hand shoulders, or the right hand side of a rounding top. When the neckline is formed, and eventually broken, I would not expect to see an increase in volume and an increase in momentum.
Movement below 1,820.66 could not be a second wave correction within minor wave 5, and so at that stage the final fifth wave would have to be over. A trend change at primary (bull count) or cycle degree (bear count) would be confirmed.
Main Bull Hourly Wave Count
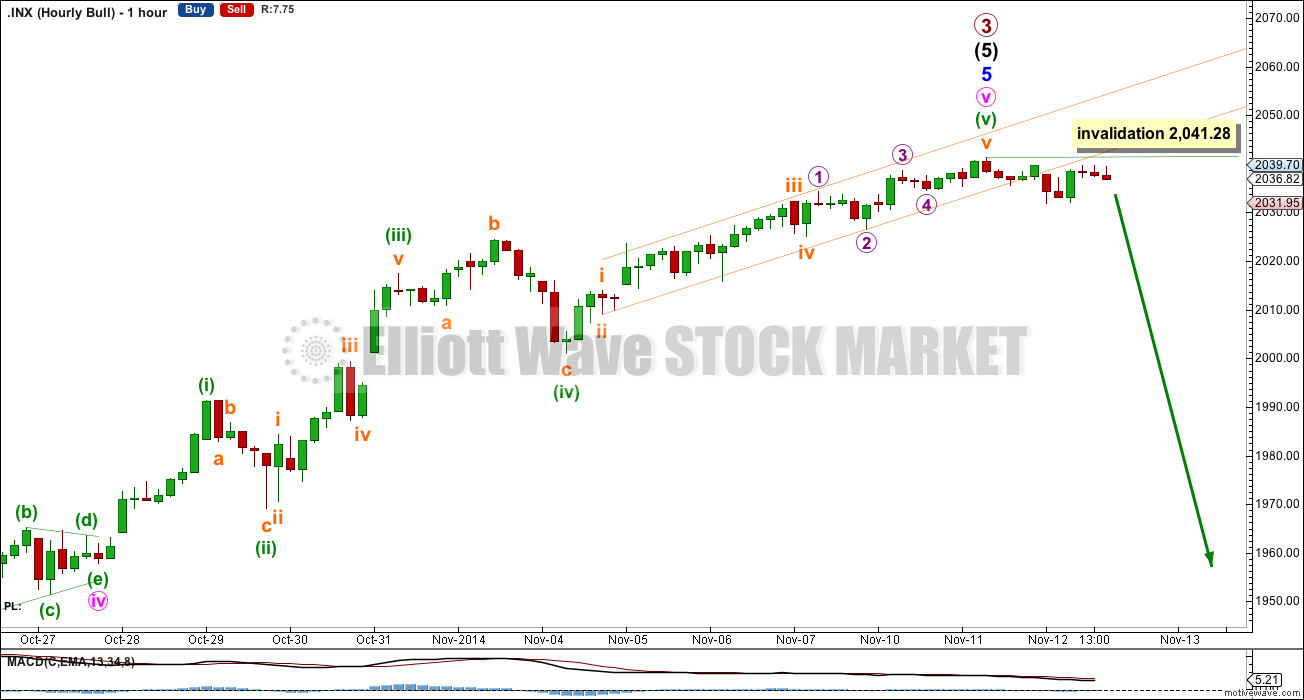
Within primary wave 3 there are good Fibonacci ratios between two of the three actionary waves at intermediate, minor, minute, subminuette and micro degrees.
The target was not met, and there are no adequate Fibonacci ratios between minuette waves (i), (iii) or (v). This is only slightly unusual for the S&P.
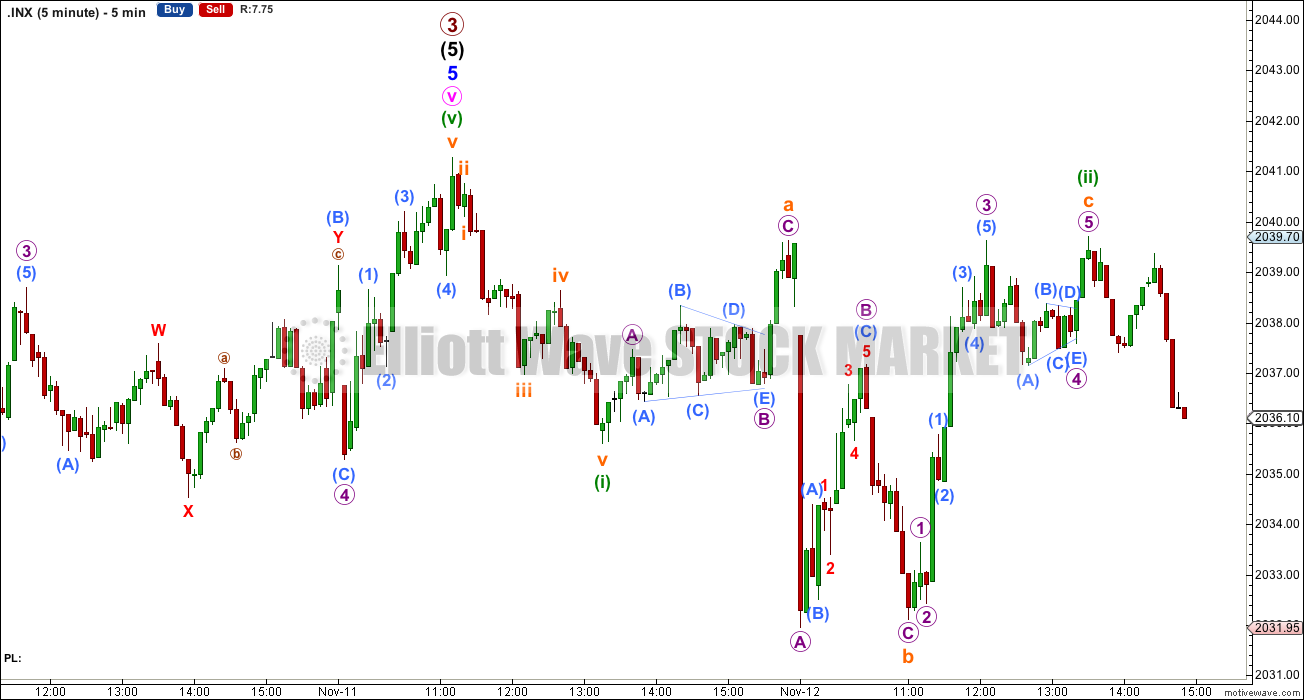
The best fit channel is breached by movement, but it is only sideways movement and not clear downwards movement. The subdivisions for this on the five minute chart are not a perfect fit for a new downwards wave because there is a truncation and a C wave which looks like a three not a five. However, the fit is okay.
I want to see a clear red candlestick for Thursday’s session before I have any confidence in this trend change.
Within the new downwards trend no second wave correction may move beyond the start above 2,041.28.
Alternate Bull Hourly Wave Count
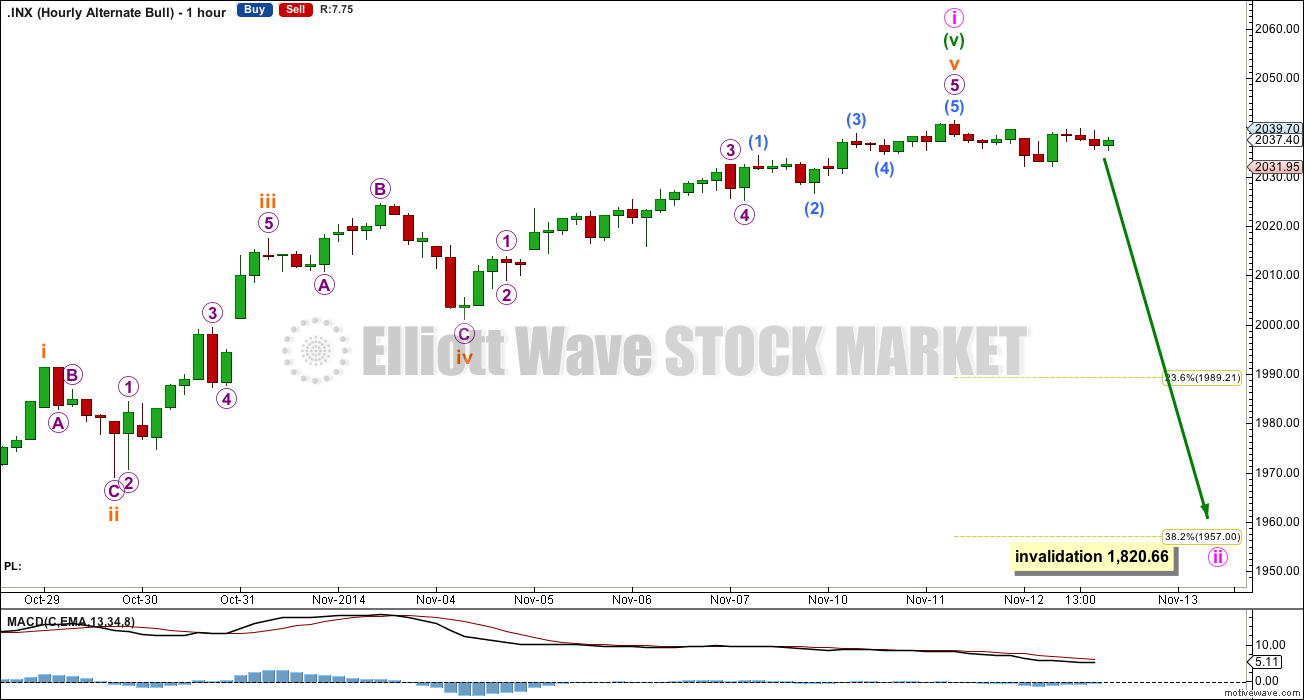
This wave count has identical subdivisions to the main wave count, and the only difference is the degree of labelling within minor wave 5 has been moved all down one degree. Minute wave i may only have just completed and minute wave ii downwards may have just begun.
Minute wave i lasted 18 days. Minute wave ii may last about 5 to 13 days to be in proportion. It may not move beyond the start of minute wave i below 1,820.66.
If minute wave ii is an expanded flat or combination then it may include a new high beyond its start above 2,041.28. There is no upper invalidation point for this reason.
Bear Wave Count
This bear wave count differs from the bull wave count at the monthly chart level and at super cycle wave degree. To see the historic picture go here.
The subdivisions within primary waves A-B-C are seen in absolutely exactly the same way as primary waves 1-2-3 for the bull wave count.
For both wave counts now that minor wave 5 may be a complete structure on the hourly and five minute charts, I have an alternate wave count which moves the degree of labelling within it all down one degree. A completion of a five wave impulse up within minor wave 5 may be either minor wave 5 in its entirety, or it may only be minute wave i within minor wave 5.
At cycle degree wave b is over the maximum common length of 138% the length of cycle wave a, at 159% the length of cycle wave a. At 2,393 cycle wave b would be twice the length of cycle wave a and at that point this bear wave count should be discarded.
This analysis is published about 03:47 p.m. EST.
Lara, love the earlier postings from a selfish UK point of view!
It’s daylight savings. I’m now an hour… earlier? Yeah. So it’s easier to get the analysis out earlier.
I’m living on NZ time, working in NY time… I’m permanently confused 🙂