
Price moved lower exactly as expected for Tuesday’s session.
Summary: The fourth wave correction looks like it is more likely a flat and may end tomorrow. The target for downwards movement is at 1,968. Alternatively, the correction could still be a triangle and may move sideways for another week or so before it is done.
Click on charts to enlarge.
Bullish Wave Count
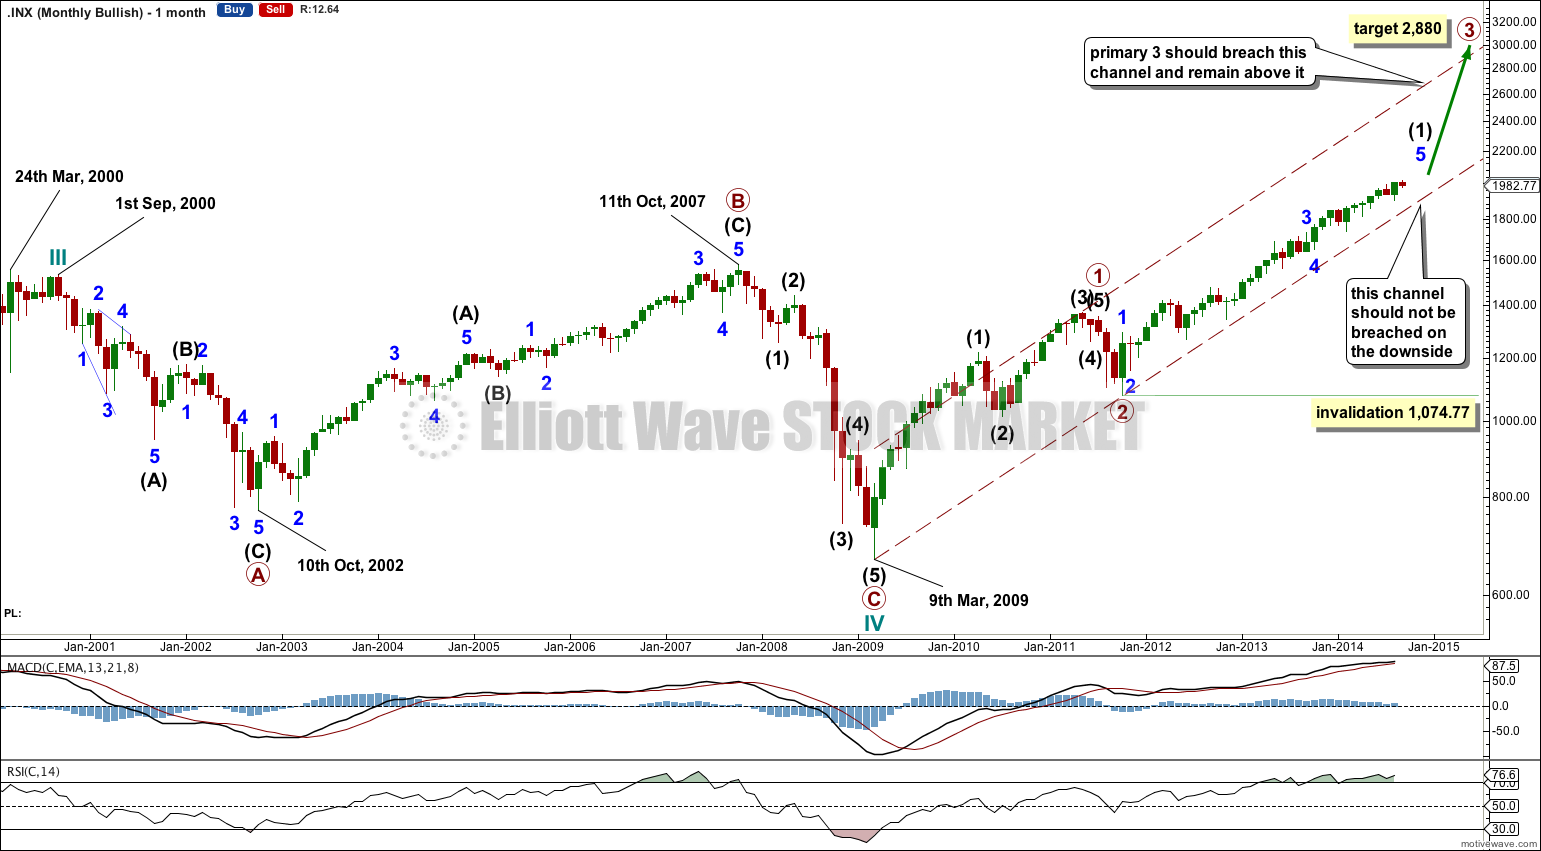
The bull wave count expects a cycle wave IV was over at the end of the credit crunch and a new bull market for cycle wave V began there.
The maroon channel is a base channel about primary waves 1 and 2. That primary wave 3 began two years and eight months ago and still has not broken above this channel, as it should, gives some cause for concern with this wave count. That is why I still follow the bearish wave count idea.
At 2,880 primary wave 3 would reach 2.618 the length of primary wave 1. It must break above the upper edge of the base channel for this wave count to have the right look.
I have noticed an interesting relationship with RSI and big trend changes over the last few years for the S&P. Prior to each major high RSI had moved above 70. Prior to each major low RSI had moved below 30. At each major high RSI moved above 70 more than a year before the high was reached, and it showed divergence with price.
RSI moved above 70 back in February 2013, more than a year ago, but RSI has not yet shown divergence, and has not made a last final failure swing. If it follows that these two things happen then I would consider that strong indication that the bear wave count may be correct.
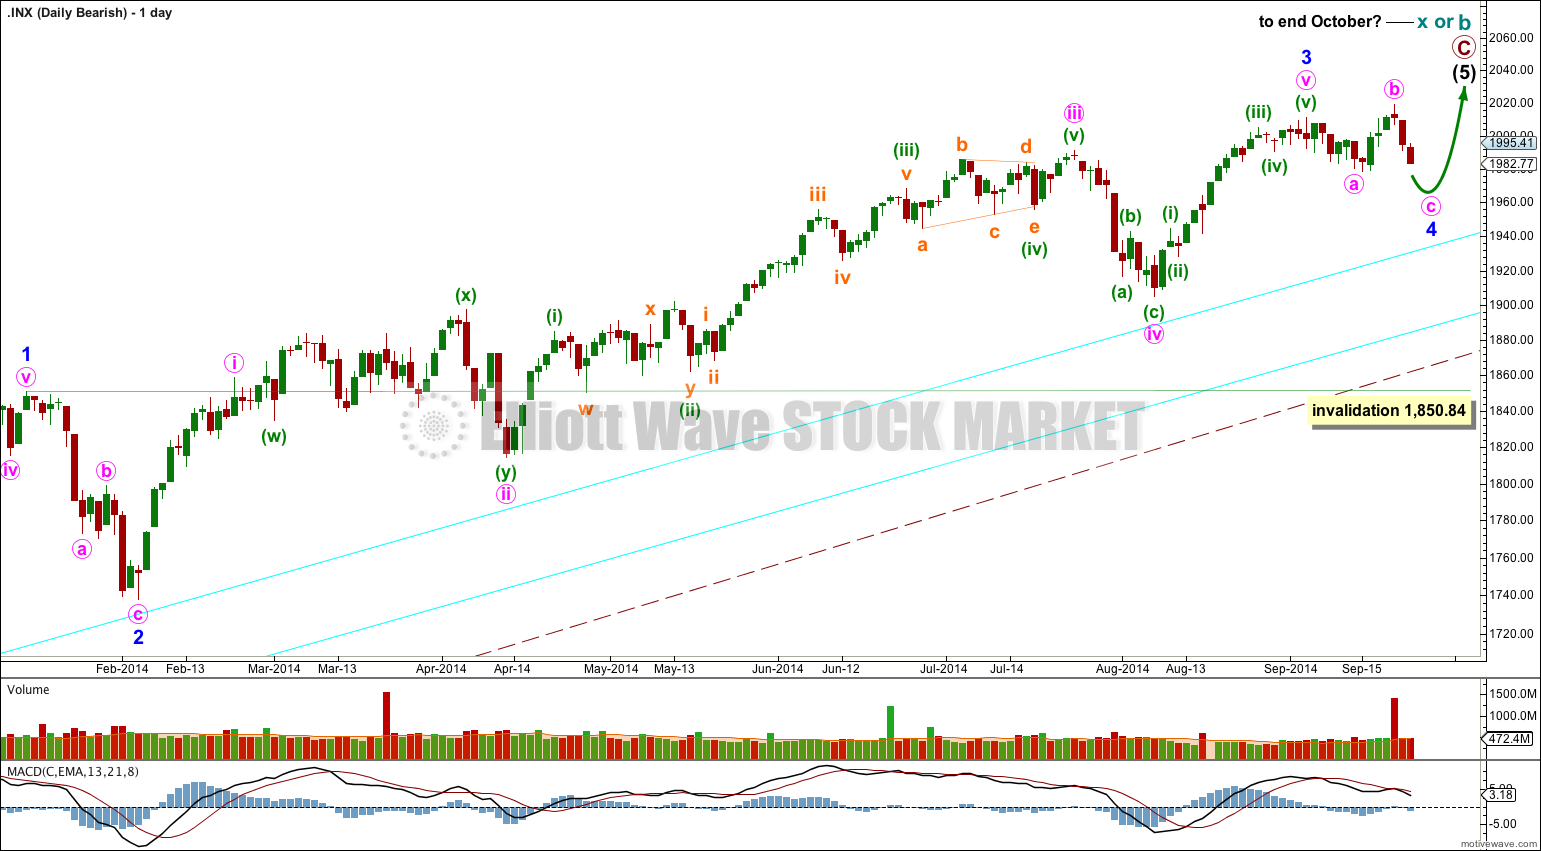
October and March seem to be common months for major turning points in the S&P over the last several years. I will look to this October as a possible high. It may be that intermediate wave (1) ends there.
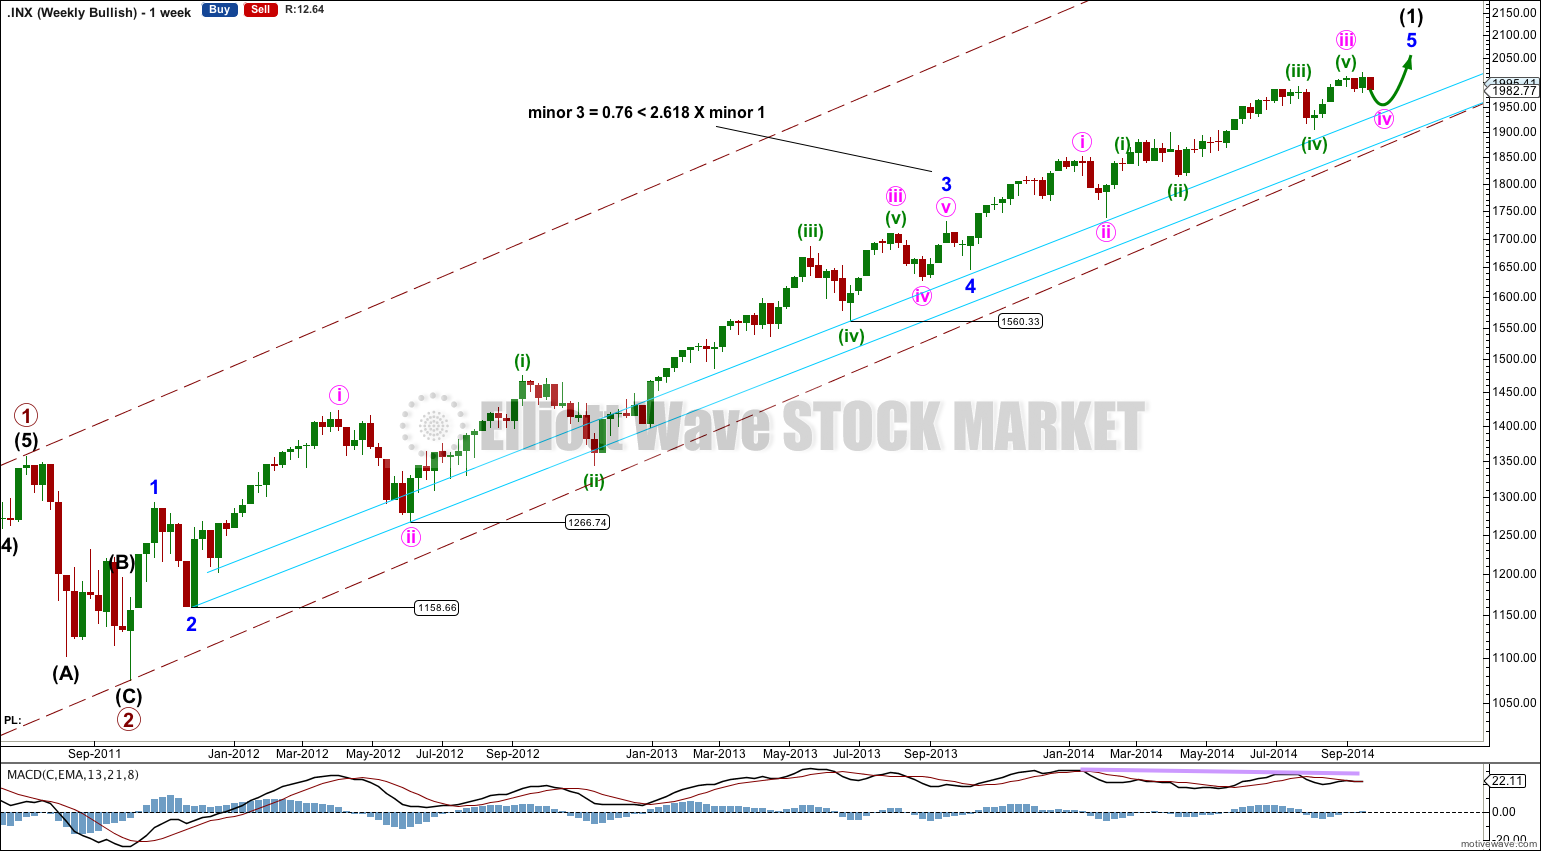
The aqua blue trend lines are critical. Draw the first trend line from the low of 1,158.66 on 25th November, 2011, to the next swing low at 1,266.74 on 4th June, 2012. Create a parallel copy and place it on the low at 1,560.33 on 24th June, 2013. While price remains above the lower of these two aqua blue trend lines we must assume the trend remains upwards. This is the main reason for the bullish wave count being my main wave count.
There are a couple of things about this wave count of which I am confident. I see minor wave 3 within intermediate wave (1) as over at 1,729.86 (19th September, 2013). It has the strongest upwards momentum and is just 0.76 longer than 2.618 the length of minor wave 1. At 455 days duration this is a remarkably close Fibonacci ratio. The subdivisions within it are perfect. If this is correct then minor wave 4 ends at 1,646.47 and this is where minor wave 5 begins.
Because there is already a very close Fibonacci ratio between minor waves 1 and 3, I would not actually expect to see a Fibonacci ratio between minor wave 5 to either of 1 or 3. This means that the target for intermediate wave (1) to end would best be calculated at minute wave degree, within minor wave 5. I will not be able to do that until minute wave iv has ended.
Minor wave 5 is unfolding as an impulse. If minor wave 5 has passed its middle then I would expect to see more divergence between price and MACD develop over coming weeks.
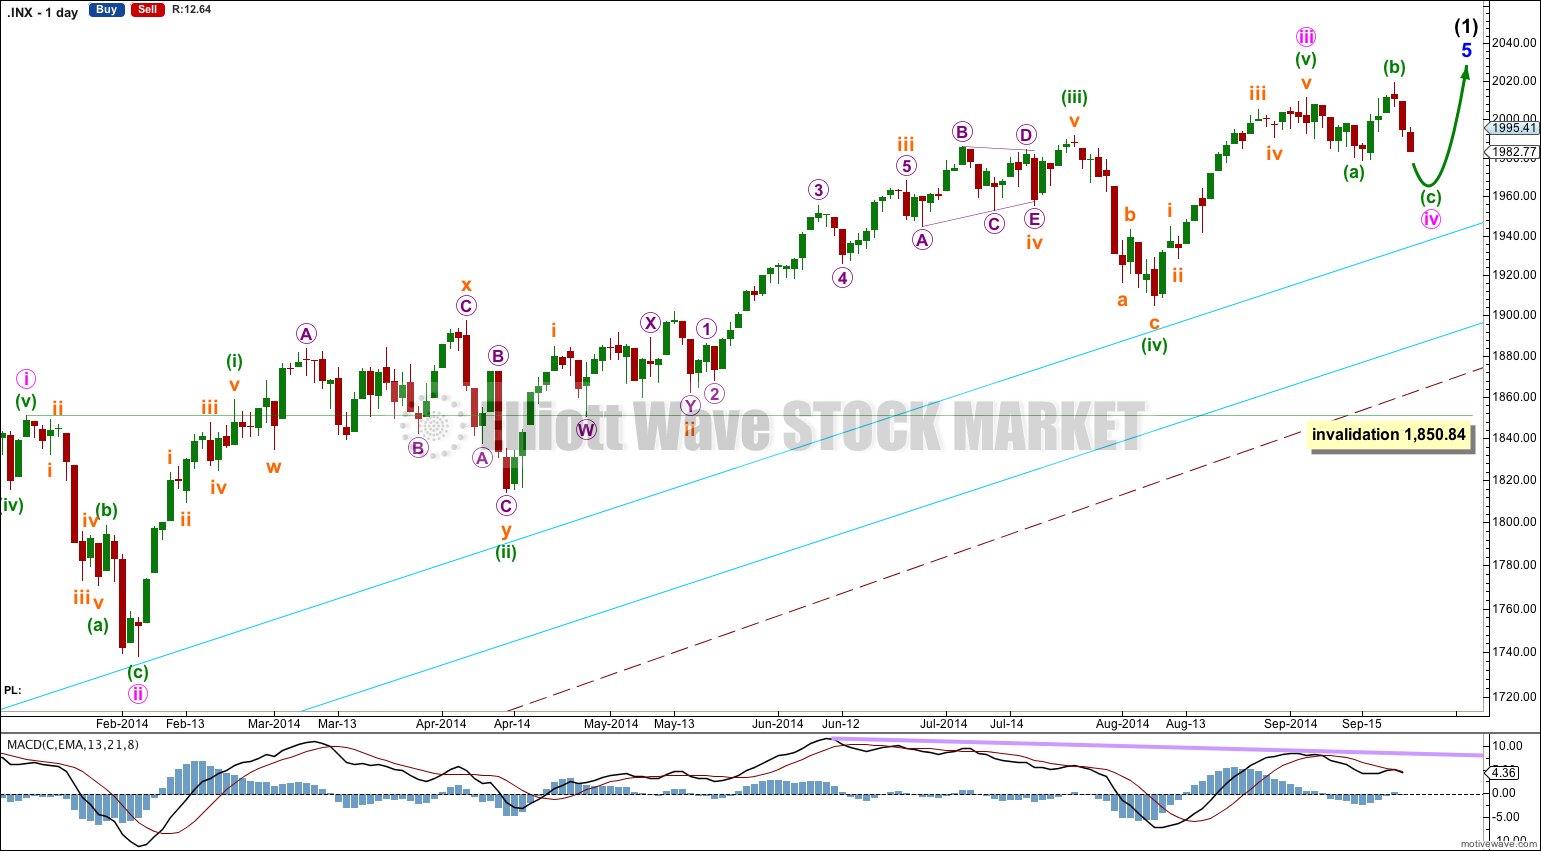
There is no Fibonacci ratio between minute waves iii and i. This makes it more likely we shall see a Fibonacci ratio between minute wave v and either of iii or i, so when minute wave iv is complete I should be able to calculate a target with a reasonably good probability.
Minute wave ii lasted 14 sessions and was a relatively deep 55% zigzag correction. Given the guideline of alternation I would expect minute wave iv to be a more shallow sideways correction, most likely to be a flat, double flat, combination or triangle. At this stage, minute wave iv looks most likely to be a flat which may end in one more day.
Combinations, expanded flat corrections and running triangles may all include new price extremes beyond their starts. The new high above 2,011.17 fits with this wave count. Minute wave iv should be very choppy and overlapping, and will be difficult to analyse (alternate wave counts will be necessary). While it is unfolding the wave count will change. There are still at least four different structures it may take at this stage.
I would expect minute wave iv to end short of the upper aqua blue trend line, continuing a pattern the S&P has shown now for over a year.
The large maroon – – – channel is copied over from the weekly chart. It is drawn in exactly the same way on bull and bear wave counts. For the bull wave count this channel is termed a base channel about primary waves 1 and 2. A lower degree second wave should not breach the lower edge of a base channel drawn about a first and second wave one or more degrees higher. The lower maroon – – – trend line differentiates the bull and bear wave counts at cycle degree and monthly chart level.
Main Hourly Wave Count
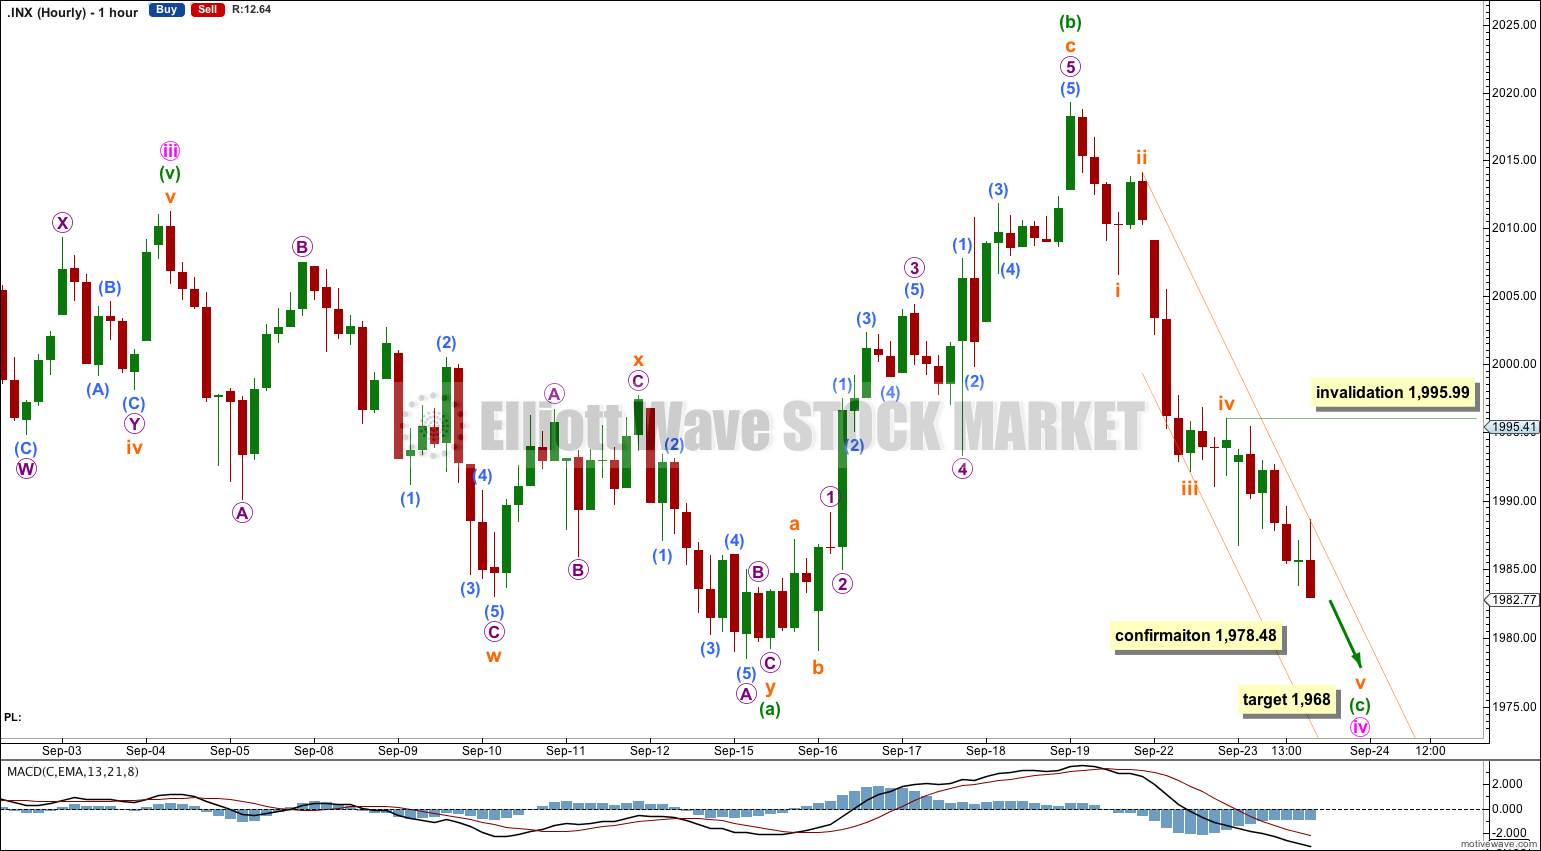
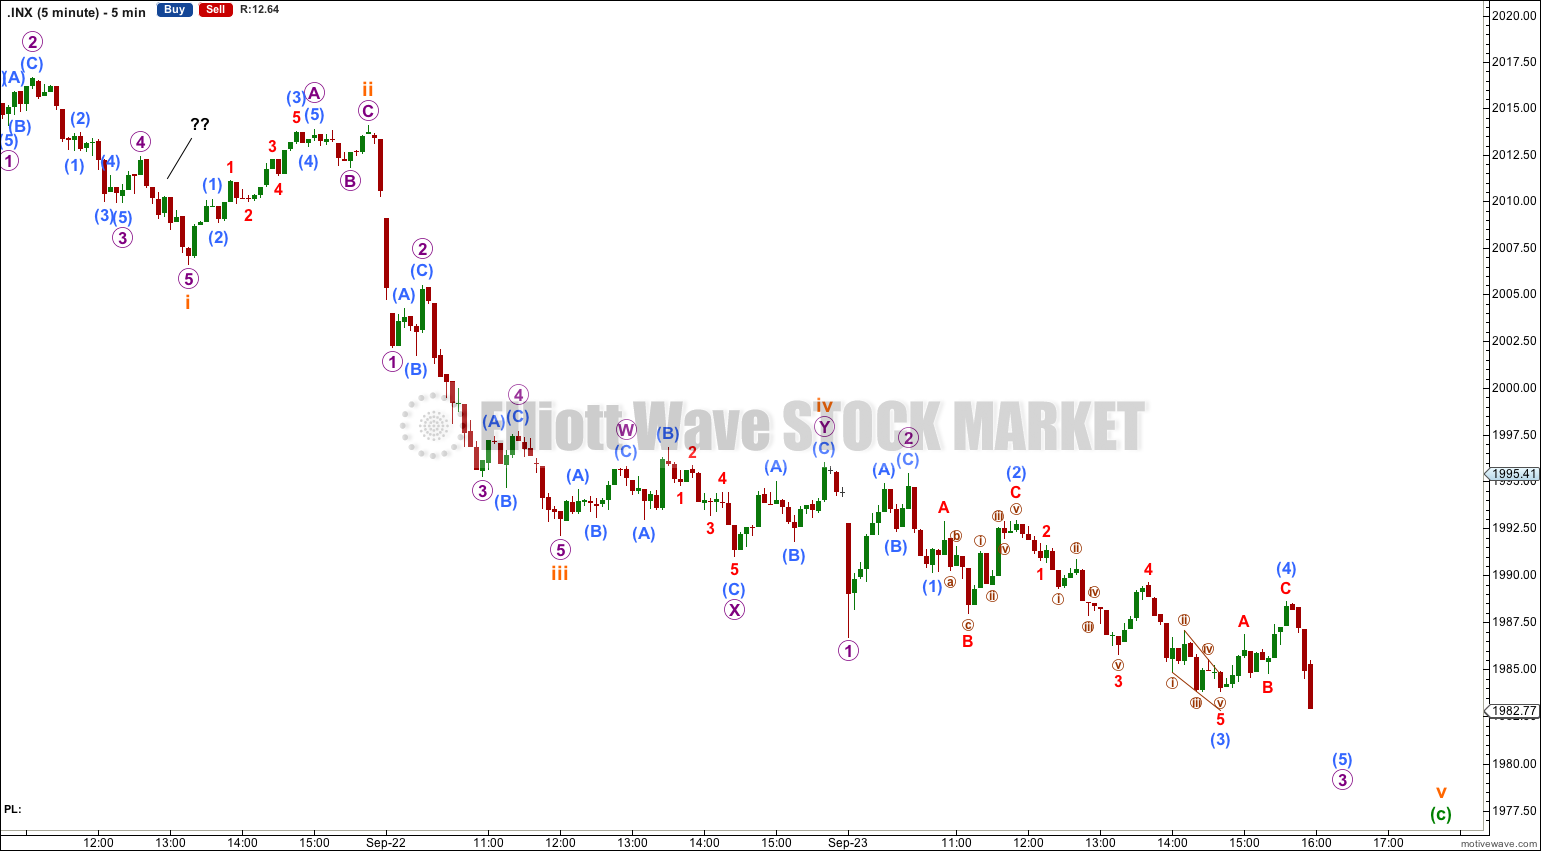
If minute wave iv is unfolding as a flat correction then within it minuette wave (b) is now a 125% correction of minuette wave (a). This is within the normal range of 100% to 138%, and indicates the flat is the most common expanded type.
Expanded flat corrections most commonly have C waves which are 1.618 the length of their A waves. At 1,968 minuette wave (c) would reach 1.618 the length of minuette wave (a). Movement below 1,978.48 would invalidate the triangle wave count below and confirm minute wave iv as a flat correction.
Minuette wave (c) must subdivide as a five wave structure. It looks like it is unfolding as a simple impulse. Subminuette wave iii is 1.47 points longer than 1.618 the length of subminuette wave i. There is no target calculation at subminuette wave degree which is close to 1,968, and so I will leave the target calculated at minuette wave degree only.
Within subminuette wave v no second wave correction may move beyond its start above 1,995.99.
The channel about minuette wave (c) is a best fit. It may show where price finds resistance along the way down. Subminuette wave v may end midway within the channel.
When this flat correction is complete then I will consider another alternate, that of a double flat or double combination. This alternate idea would move the degree of labeling within minute wave iv all down one degree. This first flat unfolding could be only the first of two structures in a double flat or double combination. Depending on how much time this first flat structure takes (is it in proportion to minute wave ii?) the double must be considered.
Alternate Hourly Wave Count
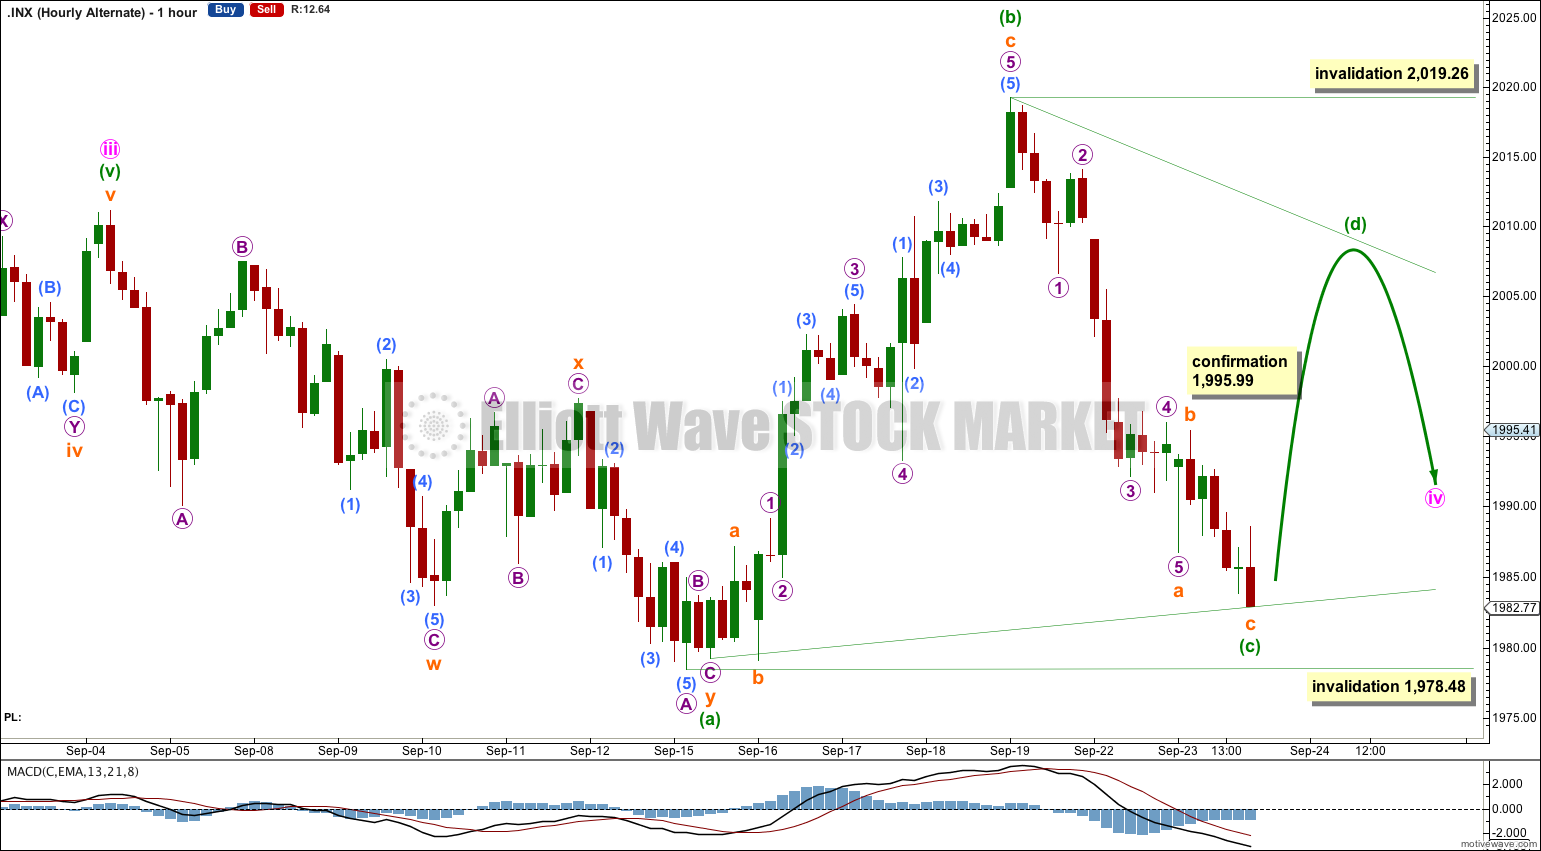
If minute wave iv is unfolding as a triangle then it may be either a running contracting triangle or a running barrier triangle.
Within both contracting and barrier triangles minuette wave (c) may not move beyond the end of minuette wave (a). I will leave this invalidation point at the price low of 1,978.48 to allow for the possibility of an error in my analysis around the end of minuette wave (a).
If minute wave iv is a triangle then minuette wave (c) may now be a complete zigzag. The A-C trend line still has a reasonable slope, this alternate wave count today has a better fit and overall looks entirely viable. If price moves above 1,995.99 tomorrow this is the alternate wave count I would use.
Triangles tend to be more time consuming structures than expanded flats and only a little less common. If minute wave iv is a triangle it may take another one to two weeks to complete.
Bearish Alternate Wave Count
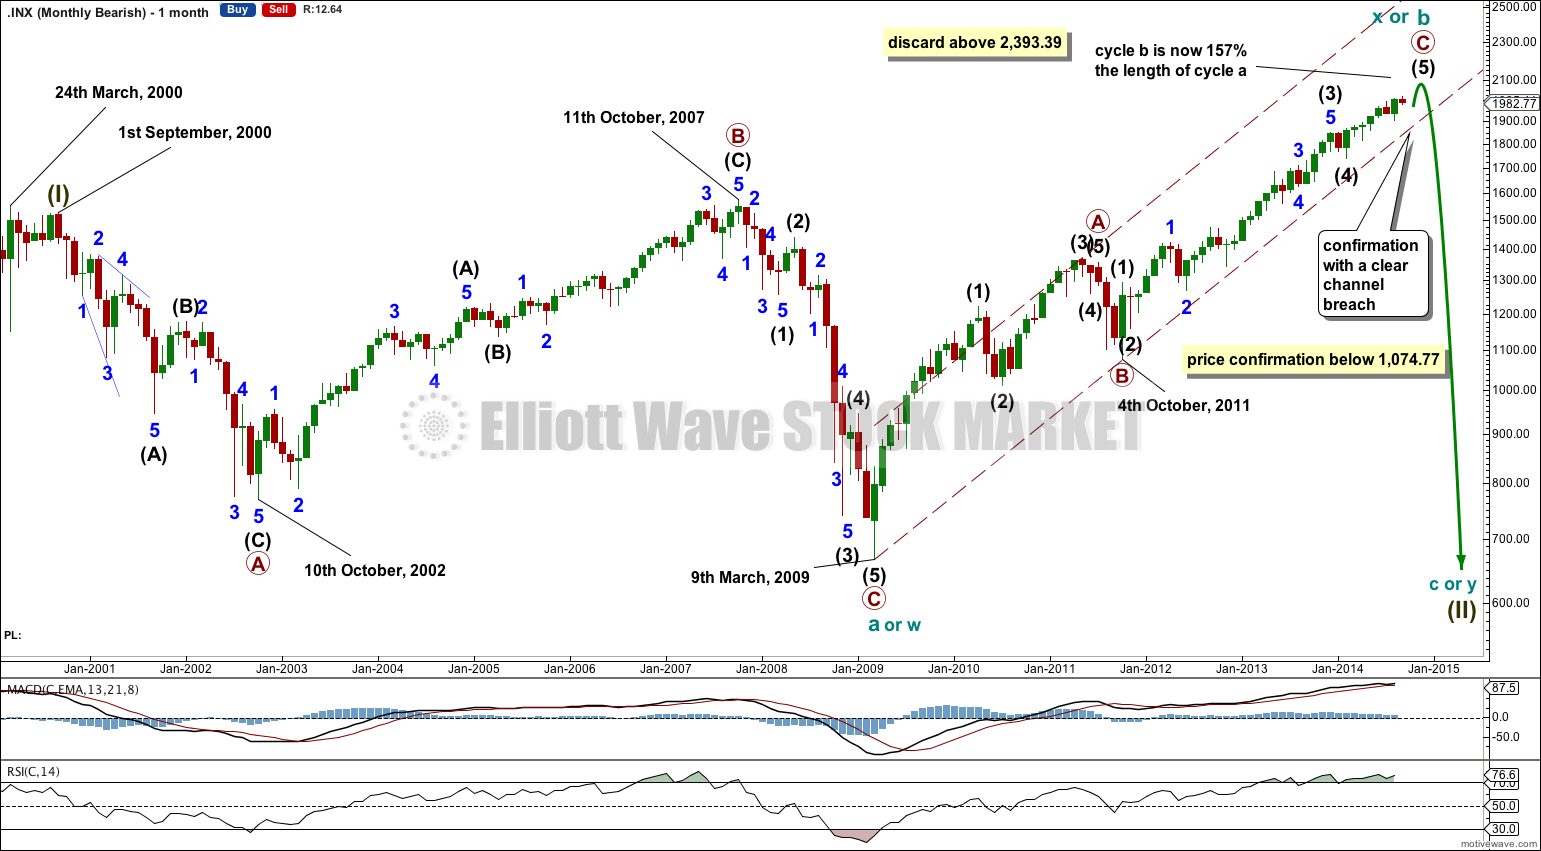
This bearish alternate wave count expects that the correction is not over. The flat correction which ended at 666.79 was only cycle wave a (or w) of a larger super cycle second wave correction.
The structure and subdivisions within primary wave C for the bear wave count are the same as for intermediate wave (1) for the bull wave count. Thus the short to mid term outlook is identical.
Cycle wave b (or x) is now longer than the maximum common length of 138% the length of cycle wave a. This reduces the probability of this wave count to an alternate. However, that is the only problem I can see at all with this wave count.
Within the zigzag upwards of cycle wave b (or x) primary wave C remains within the corrective channel and sits in the lower half. This fits nicely for this bearish wave count.
At 2,393.39 cycle wave b (or x) would be twice the length of cycle wave a (or w) and the probability of this wave count would then be so low it should be discarded.
The maroon channel is here a corrective channel about the upwards zigzag. When this channel is breached by downwards movement that would provide trend channel confirmation that cycle wave b (or x) is over and cycle wave c (or y) has begun.
If RSI begins to show divergence and then makes a failure swing in October this wave count could see a trend change in that month.
The differentiation between the bull and bear wave count is the maroon – – – channel. The bull wave count should see price remain above the lower maroon – – – trend line. The bear wave count requires a clear breach of this trend line. If this trend line is breached by a full weekly candlestick below it and not touching it then this bear wave count would be my main wave count and I would then calculate downwards targets.
We should always assume the trend remains the same until proven otherwise; the trend is your friend. While price remains above the lower maroon – – – trend line I will assume that the S&P 500 remains within a bull market.
This analysis is published about 07:29 p.m. EST.
hello Lara,
Is it possible wave 1 of C is over which was 5 wave structure and wave 2 is in progress? If wave 4 has ended that too shallow for an this level of 4th wave.
No, its not too shallow.
Anyway, with movement back into wave 1 price territory the only possibility for minuette wave (c) to continue now is as an ending diagonal. I’ll be looking into that today.
Lara,
Well done. I like seeing the monthly, weekly and daily together. Visually and verbally clear and concise. Hourly chart maybe be good for fine-tuning an entry or exit point but unless one is a day-trader an exact entry and exit point is seldom required. Daily chart within context of weekly and monthly gives a clear picture of the situation and is most valuable. Good for me to stay out of the weeds (or seaweeds) of hourly chart and focus on catching a bigger wave. Hope to see more analysis in this format.