
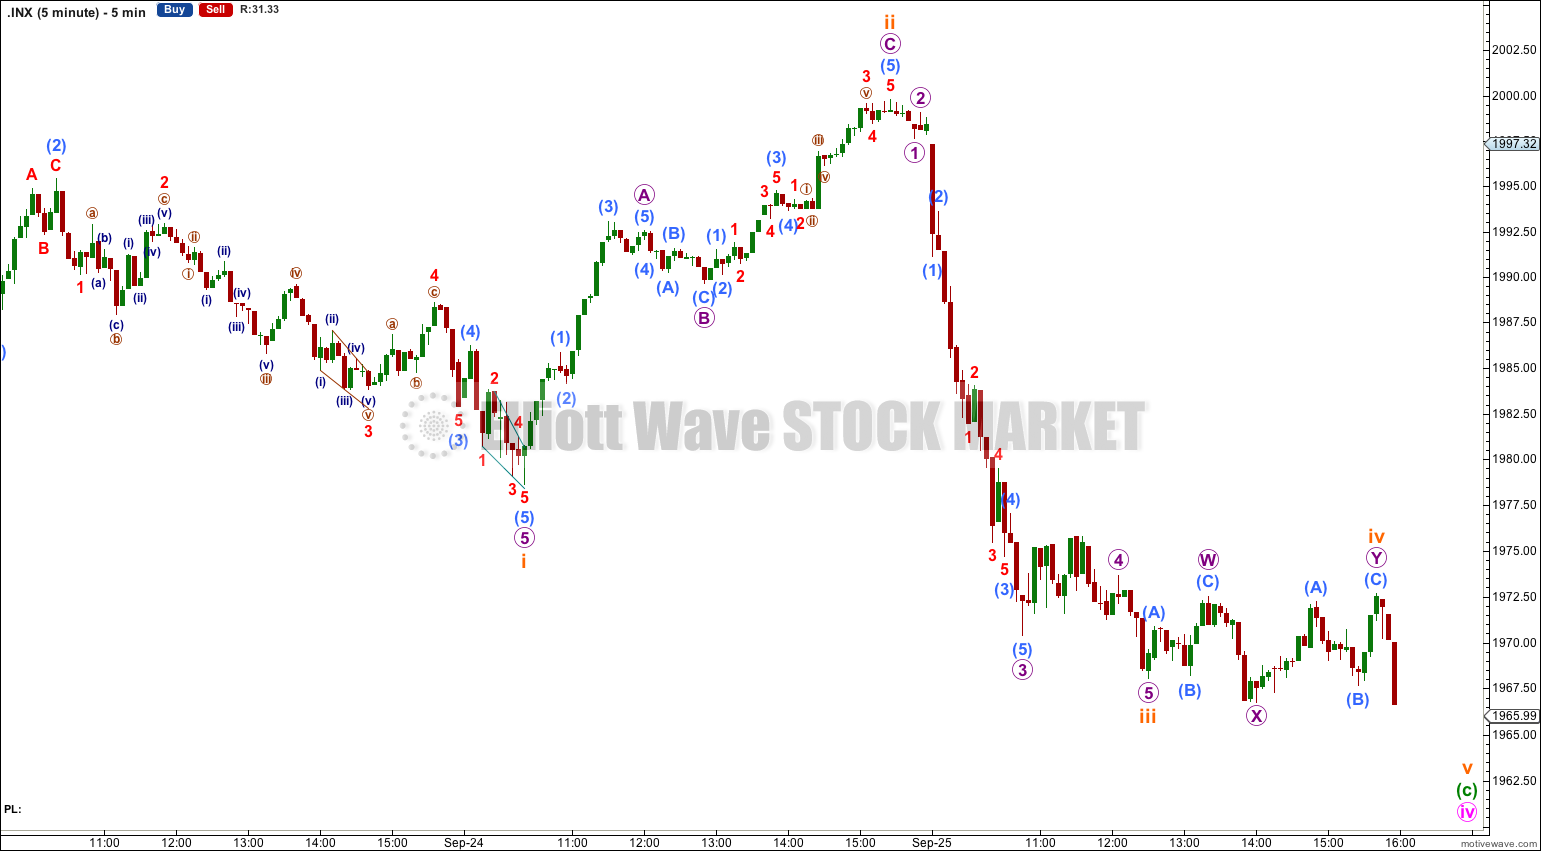
Movement below 1,978.63 invalidated the main hourly wave count and confirmed the first alternate. The target then was at 1,968. Price reached down to 1,966.56.
Summary: The structure is incomplete. I expect more downwards movement to a target at 1,953. Price should not touch the upper of the two aqua blue trend lines on the daily chart.
Click on charts to enlarge.
Bullish Wave Count
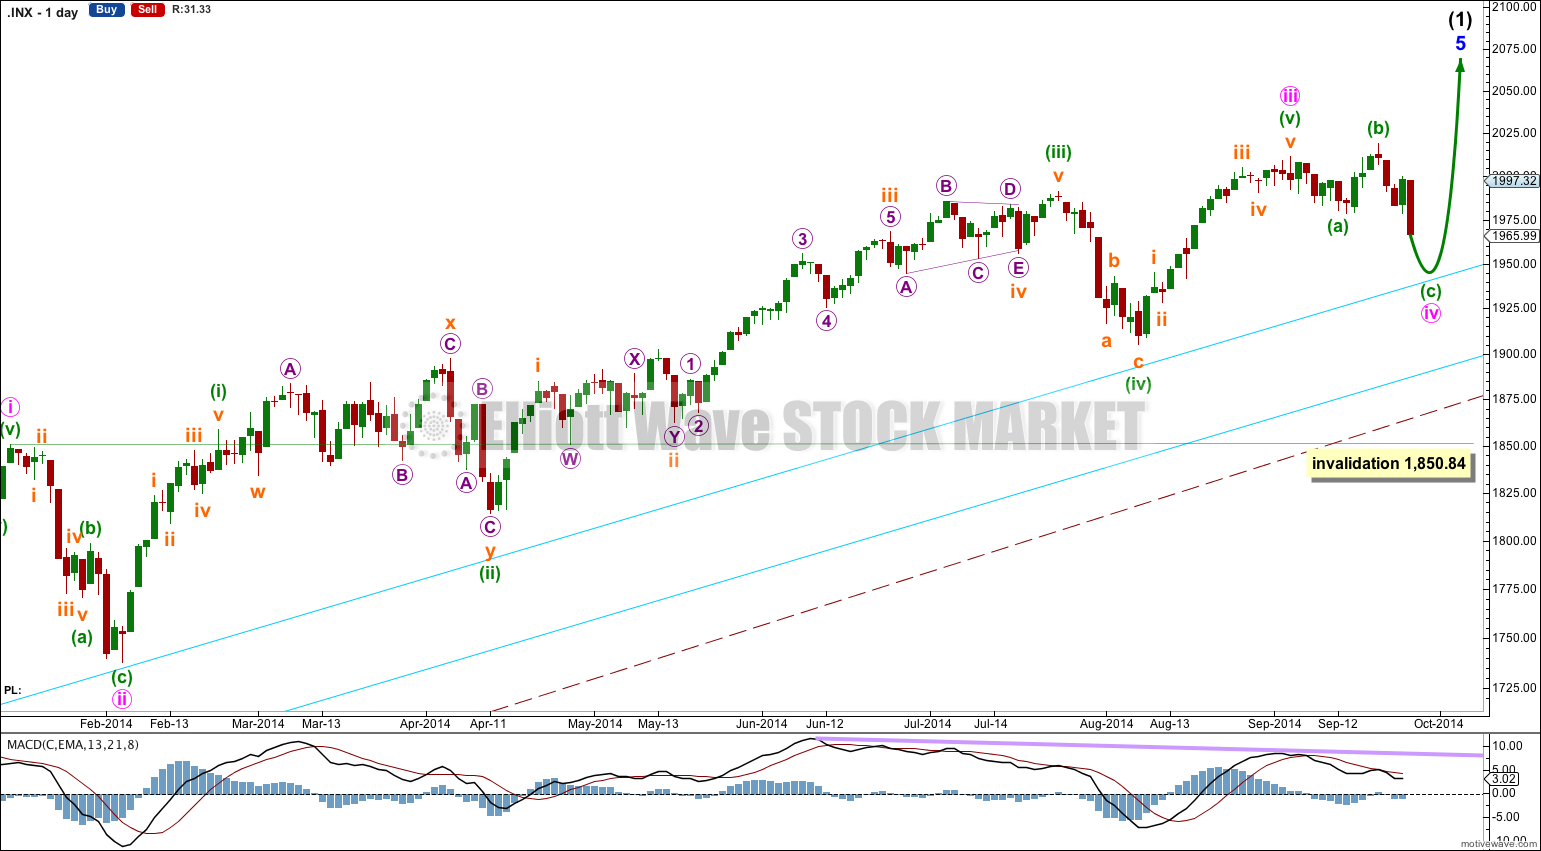
The aqua blue trend lines are critical. Draw the first trend line from the low of 1,158.66 on 25th November, 2011, to the next swing low at 1,266.74 on 4th June, 2012. Create a parallel copy and place it on the low at 1,560.33 on 24th June, 2013. While price remains above the lower of these two aqua blue trend lines we must assume the trend remains upwards. This is the main reason for the bullish wave count being my main wave count.
There are a couple of things about this wave count of which I am confident. I see minor wave 3 within intermediate wave (1) as over at 1,729.86 (19th September, 2013). It has the strongest upwards momentum and is just 0.76 longer than 2.618 the length of minor wave 1. At 455 days duration this is a remarkably close Fibonacci ratio. The subdivisions within it are perfect. If this is correct then minor wave 4 ends at 1,646.47 and this is where minor wave 5 begins.
Within minor wave 5 there is no Fibonacci ratio between minute wave i and iii. This makes it more likely that minute wave v will exhibit a Fibonacci ratio to either of i or iii. When minute wave iv is over I will calculate targets upwards for minute wave v to end. The target would be for intermediate wave (1) to complete at all wave degrees.
Minor wave 5 is unfolding as an impulse. If minor wave 5 has passed its middle then I would expect to see more divergence between price and MACD develop over coming weeks.
Minute wave ii lasted 14 sessions and was a relatively deep 55% zigzag correction. Minute wave iv is showing alternation as a shallow flat correction.
The large maroon – – – channel is copied over from the weekly chart. It is drawn in exactly the same way on bull and bear wave counts. For the bull wave count this channel is termed a base channel about primary waves 1 and 2. A lower degree second wave should not breach the lower edge of a base channel drawn about a first and second wave one or more degrees higher. The lower maroon – – – trend line differentiates the bull and bear wave counts at cycle degree and monthly chart level.
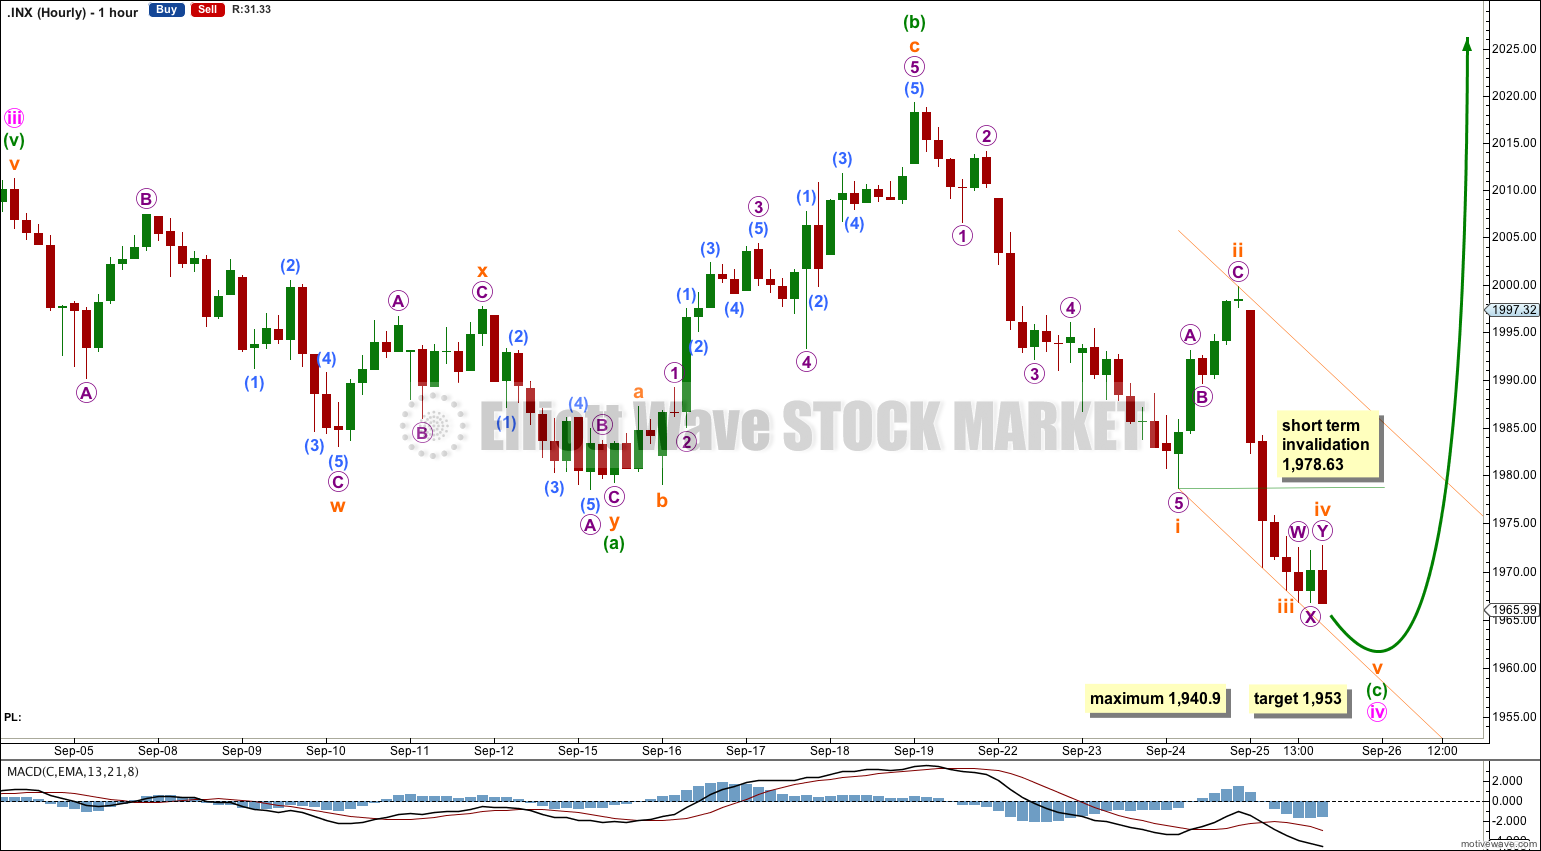
Minute wave iv is an expanded flat correction. So far minuette wave (b) is a 125% correction of minuette wave (a). Minuette wave (c) has passed 1.618 the length of minuette wave (a) and the structure is incomplete. I do not think minuette wave (c) will reach 2.618 the length of minuette wave (a) because this would see the upper aqua blue trend line breached.
The target is best calculated at subminuette wave degree.
There is no Fibonacci ratio between subminuette waves iii and i. This makes it more likely we shall see a Fibonacci ratio for subminuette wave v. At 1,953 subminuette wave v would reach 0.618 the length of subminuette wave iii.
Subminuette wave iii is shorter than subminuette wave i. Because a third wave may never be the shortest wave this limits subminuette wave v to no longer than equality with subminuette wave iii at 1,940.90.
Draw a parallel channel about minuette wave (c) using Elliott’s first technique: draw the first trend line from the lows labeled subminuette waves i to iii, then place a parallel copy on the high labeled subminuette wave ii. Subminuette wave v should end at the lower trend line.
When this channel is clearly breached by upwards movement that shall be first indication that minute wave iv is over and minute wave v has begun. Subsequent movement above 1,978.63 would provide price confirmation at that stage as upwards movement could not be a fourth wave correction within minuette wave (c), so minuette wave (c) would have to be over.
While minuette wave (c) is incomplete subminuette wave iv may not move into subminuette wave i price territory above 1,978.63.
Bearish Alternate Wave Count
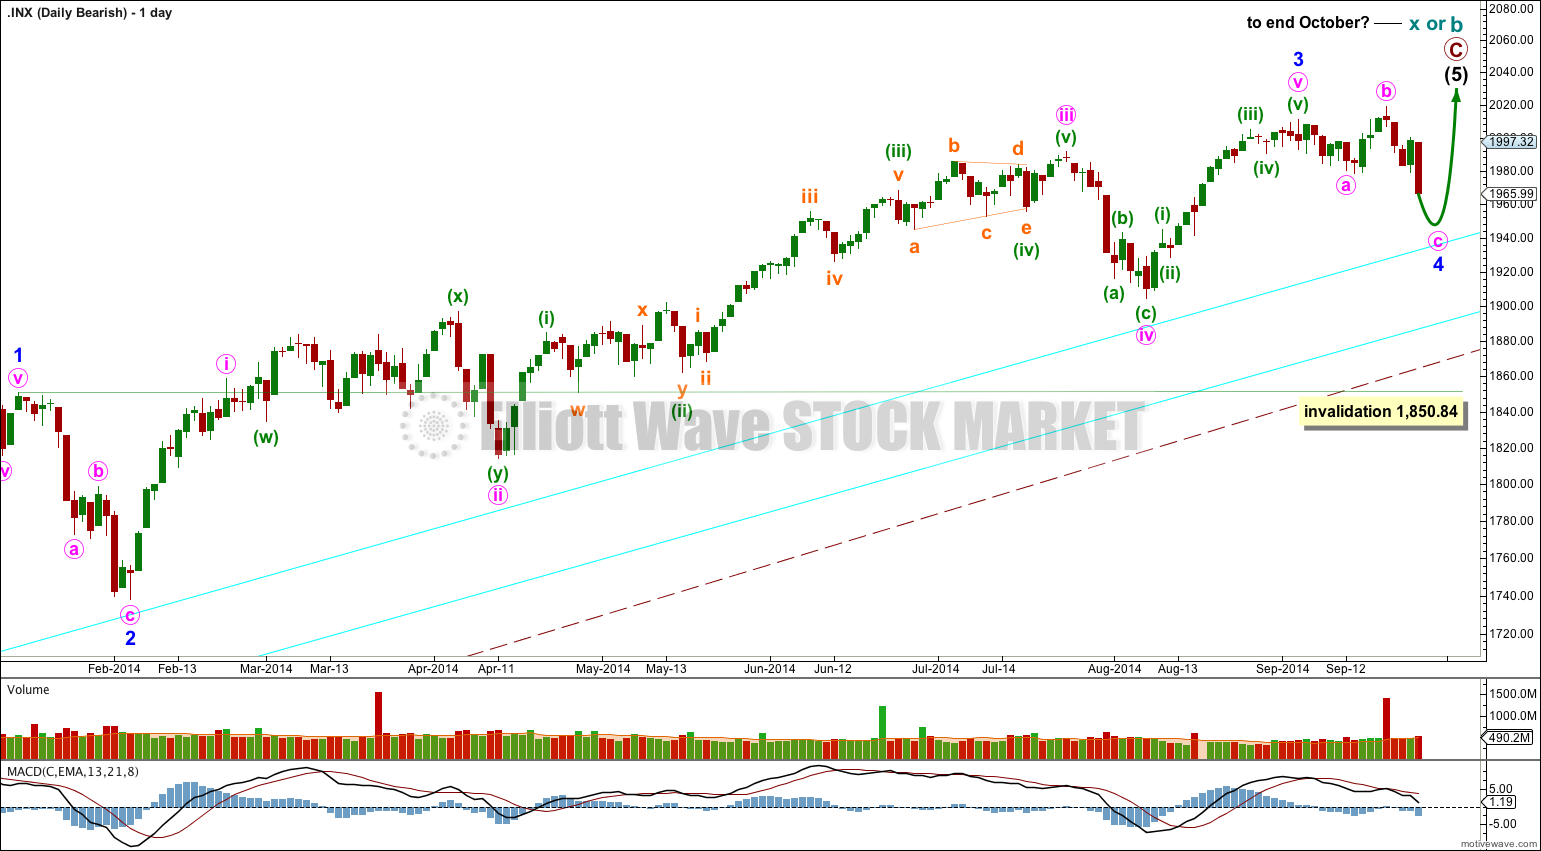
To see the difference between bull and bear wave counts they must be viewed on monthly charts here and video here.
The differentiation between the bull and bear wave count is the maroon – – – channel. The bull wave count should see price remain above the lower maroon – – – trend line. The bear wave count requires a clear breach of this trend line. If this trend line is breached by a full weekly candlestick below it and not touching it then this bear wave count would be my main wave count and I would then calculate downwards targets.
We should always assume the trend remains the same until proven otherwise; the trend is your friend. While price remains above the lower maroon – – – trend line I will assume that the S&P 500 remains within a bull market.
This analysis is published about 09:07 p.m. EST.