It’s make or break time for my wave Elliott wave count with AAPL. Any movement above 100.72 would invalidate the wave count and indicate AAPL is in a new upwards trend.
I expect to see downwards movement from AAPL from this point. The long term target is 53.53 which may be seven months away.
Click on charts to enlarge.
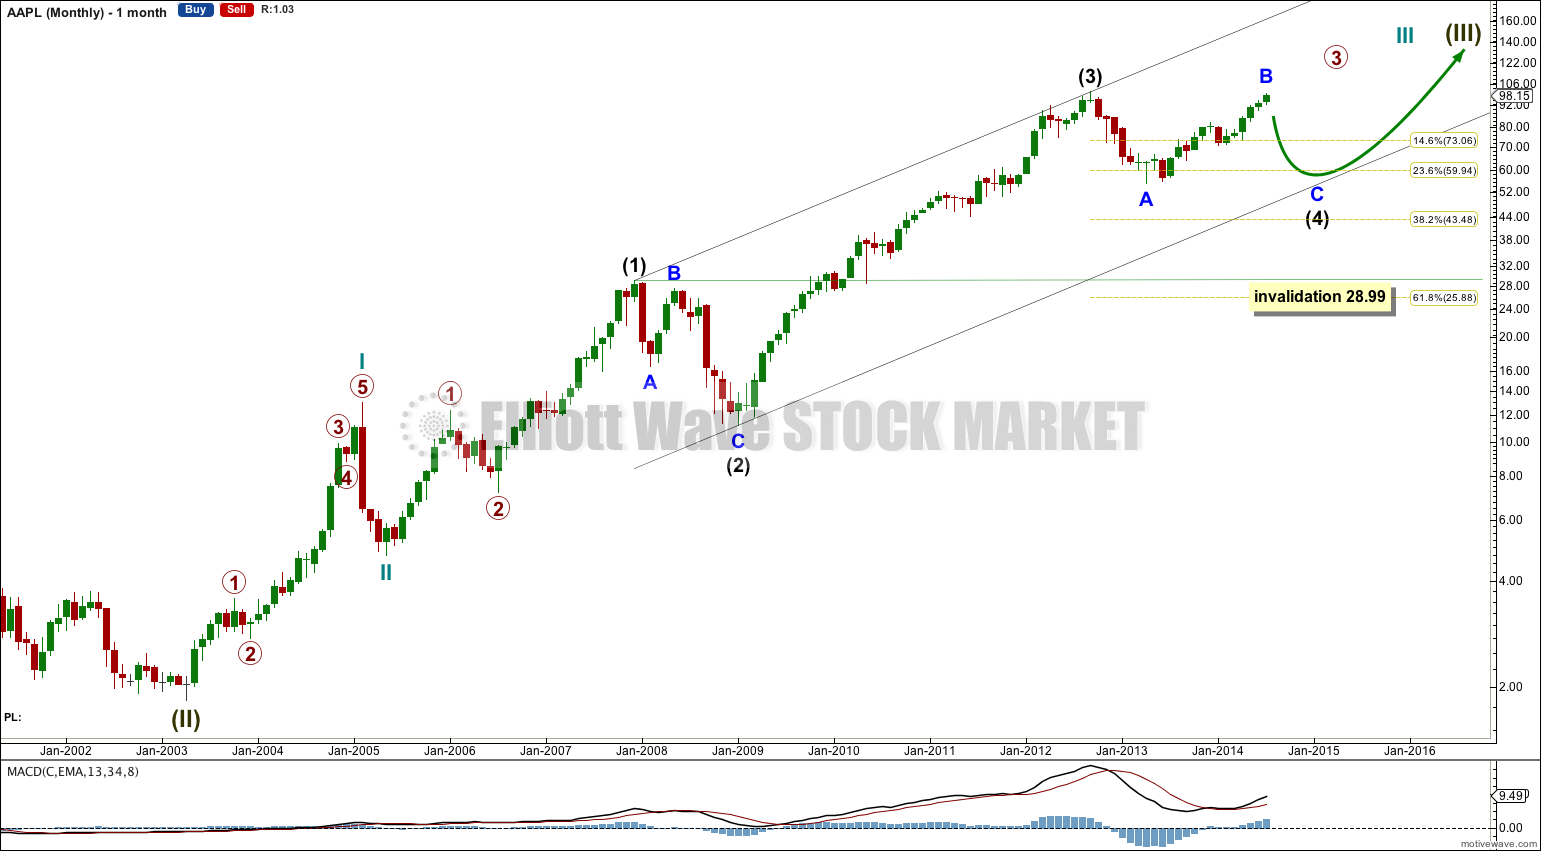
I expect that AAPL is within a correction for intermediate wave (4) which is unfolding as a zigzag. Intermediate wave (4) may find support, and may end, at the lower edge of the Elliott channel drawn here.
Intermediate wave (3) is just 2.88 longer than 4.236 the length of intermediate wave (1).
Intermediate wave (2) is a zigzag, with no Fibonacci ratio between minor waves A and C within it. Minor wave C is clearly longer than minor wave A.
I would have expected intermediate wave (4) to most likely exhibit better alternation with intermediate wave (2) and not be a zigzag, but so far minor wave A within intermediate wave (4) looks like a clear five wave impulse. We may see alternation between these structures in the length of their A and C waves. I have seen this happen before, albeit rarely.
Within intermediate wave (4) minor wave C may be close to equality in length with minor wave A.
Intermediate wave (2) was a deep 82% correction. At this stage intermediate wave (4) is showing alternation in depth of correction by being very shallow, and should continue to be. The lowest I would expect it to go may be the 0.382 Fibonacci ratio of intermediate wave (3) at 43.48, but because of its shallowness it looks like it may not reach that low.
Intermediate wave (4) may not move into intermediate wave (1) price territory below 28.99.
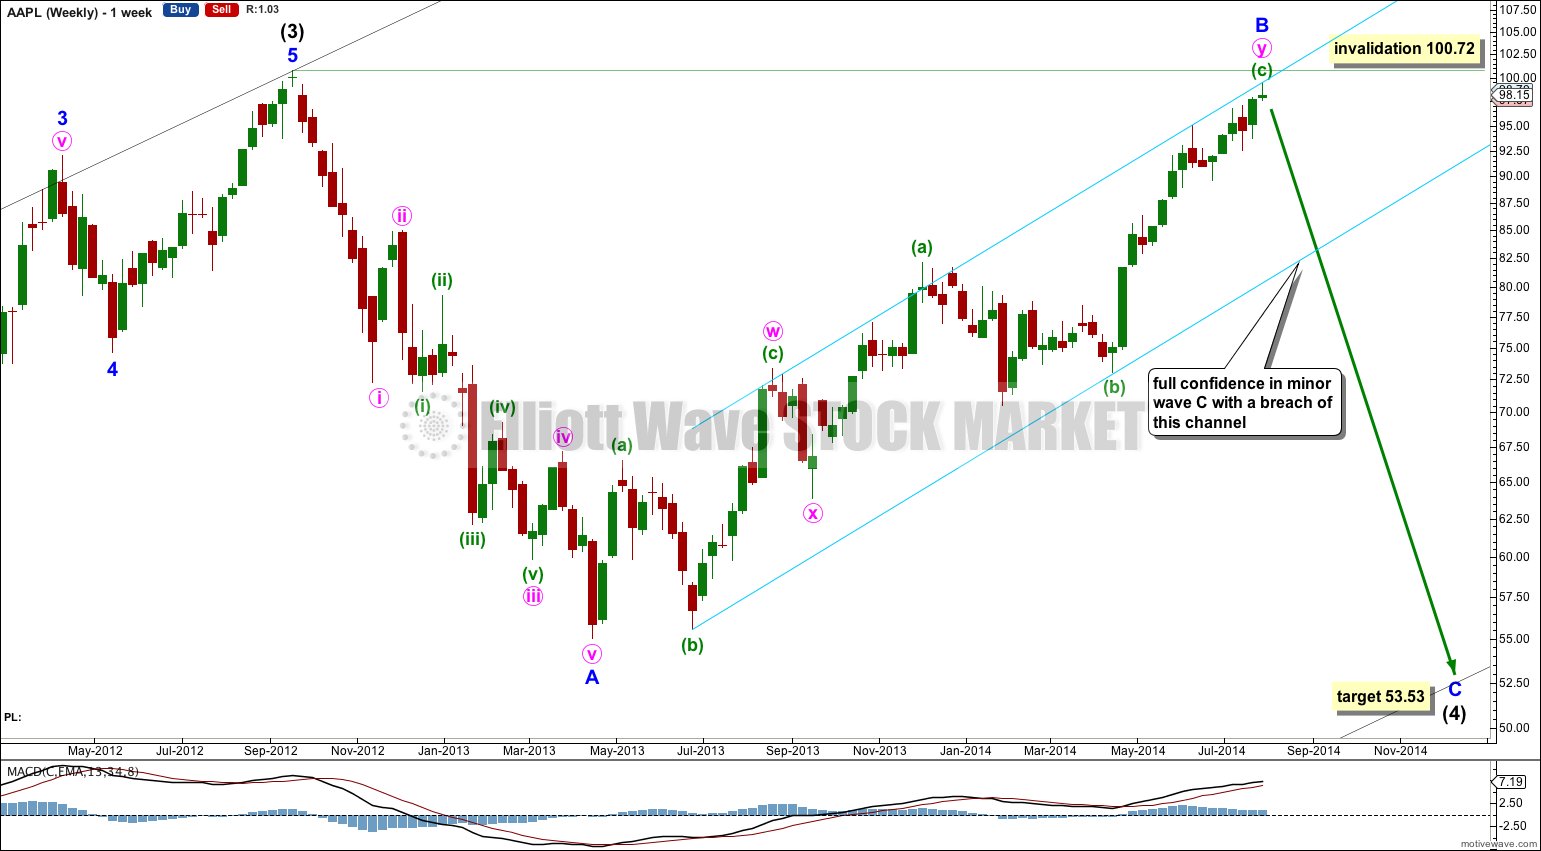
Minor wave B has almost no room left for movement. It may not move beyond the start of minor wave A above 100.72.
This wave count relies upon my analysis of minor wave A downwards as a five wave impulse.
Within minor wave A there are no adequate Fibonacci ratios between minute waves i, iii and v. Minute wave iii is shorter than minute wave i, and minute wave v is the shortest.
Within minute wave iii there are no adequate Fibonacci ratios between minuette waves (i), (iii) and (v). This is not actually unusual for AAPL; I have found it to only rarely exhibit nice Fibonacci ratios which does make target calculation more difficult.
Minor wave B is seen as a double zigzag. The second zigzag is now complete.
The aqua blue trend channel is a best fit. When this channel is clearly breached by downwards movement then I shall have full confidence in the target at 53.53, or at least that the direction is down and extremely likely to make a new low below 55.01. Minor wave C is extremely likely to make at least a slight new low below minor wave A to avoid a truncation.
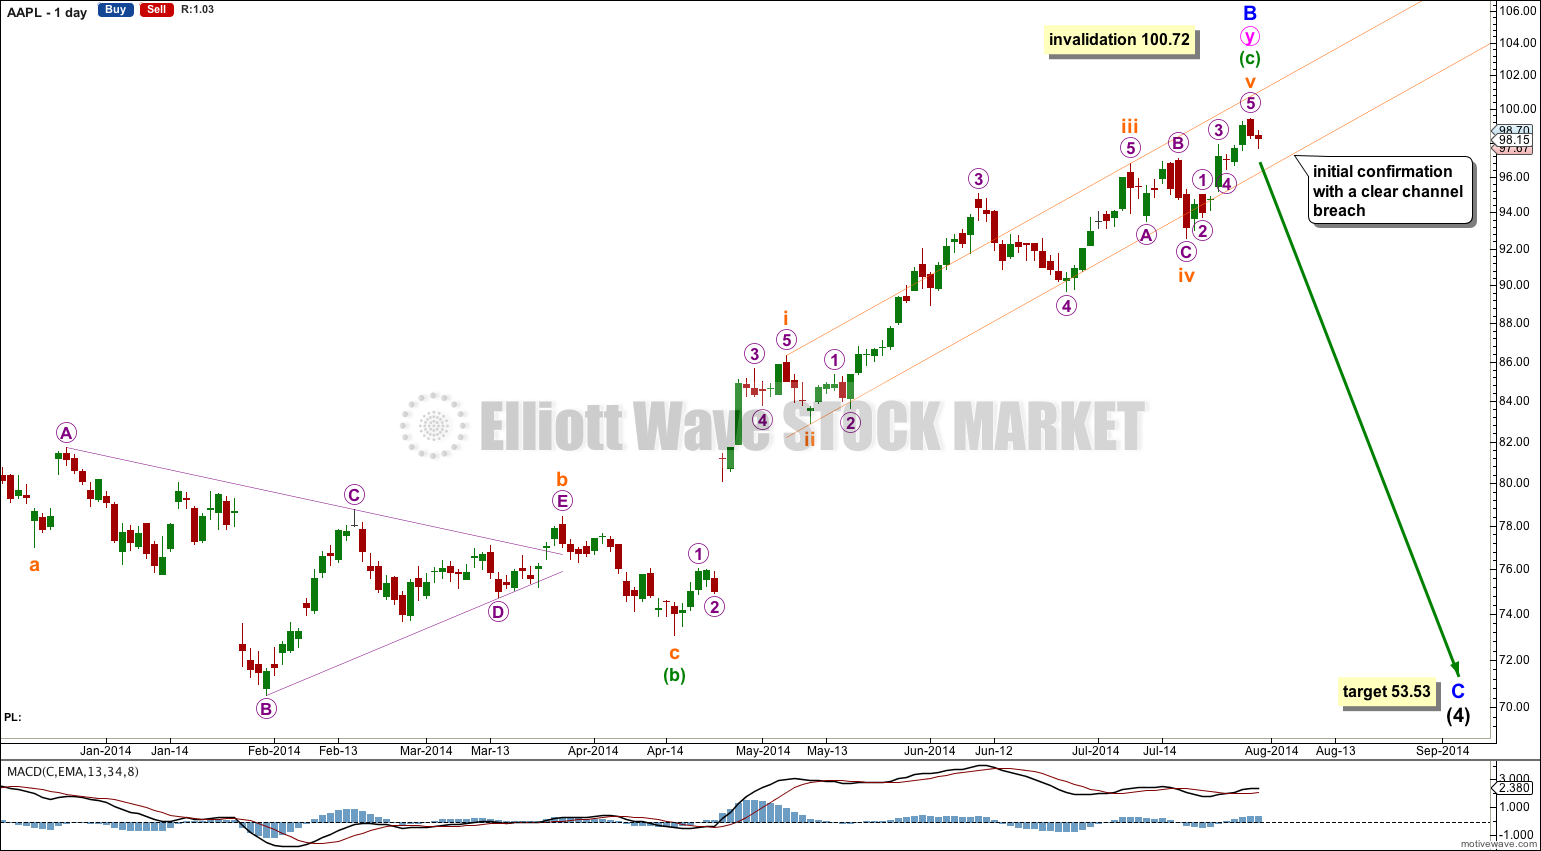
The daily chart focusses on the structure of the final wave up within minor wave B: minuette wave (c) of the second zigzag.
The small orange channel is drawn using Elliott’s technique about minuette wave (c): draw the first trend line from the ends of subminuette waves i to iii, then place a parallel copy on the end of subminuette wave ii. Only when this channel is very clearly breached with a full daily candlestick below it and not touching the lower trend line will I have confidence in this trend change. While price remains within this channel we may yet see more upwards movement.
At 53.53 minor wave C would reach equality in length with minor wave A. Minor wave A lasted seven months, so minor wave C may be about an even duration.


I think thats a more fundamental analysis approach.
Elliott wave principle expects it is social mood which is expressed in market movements. Our behaviour as reported in the media follows social mood. So the apparent cause of a market movement is not a cause but a result of social mood.
Popular expectations are opposite to this. We think it is stuff that happens as reported in the media which cause markets to move one way or the other.
Please read the comments guidelines.
If you want me to consider an alternate wave count please provide a chart.
What about 4th wave triangle ending at a higher price level.
If this turns out to be the case I wonder what the cause could be? It seems like they have a lot of good things coming out in the next few months. Could there be a crash if the market as a whole in that timeframe?
Lara, today aapl closed 95.6. Do we have a clear channel breach supporting major trend change?
“Only when this channel is very clearly breached with a full daily candlestick below it and not touching the lower trend line will I have confidence in this trend change. “
Not yet, no. The candlestick for 31st July is still partly within the channel.
Its looking good so far though!
Lara,
Thanks for answer.
One more question please. How long until AAPL hits maybe 53 low?
In today’s analysis you commented “The long term target is 53.53 which may be seven months away”. Answering a question in 8 July APPL analysis you said “I don’t expect the low to be reached for six weeks or so”.
My apologies, I do not wish to nit-pick but there is a huge difference between 7 months and 6 weeks. I am looking to short AAPL and there’s a big difference between 6 week options and 7 month options.