Elliott Wave Stock Market
  • Analysis
    • S&P 500
    • Lara’s Weekly
    • Public
  • Resources
  • About
    • Testimonials
    • Contact
    • FAQ
    • TOS
  • Subscribe
    • S&P 500 Daily
    • Lara’s Weekly
    • Subscription Plans
  • My Account
    • Login
Select Page
TSLA: Technical Analysis | Charts – July 16, 2020

TSLA: Technical Analysis | Charts – July 16, 2020

by Lara | Jul 17, 2020 | Public Analysis, TSLA

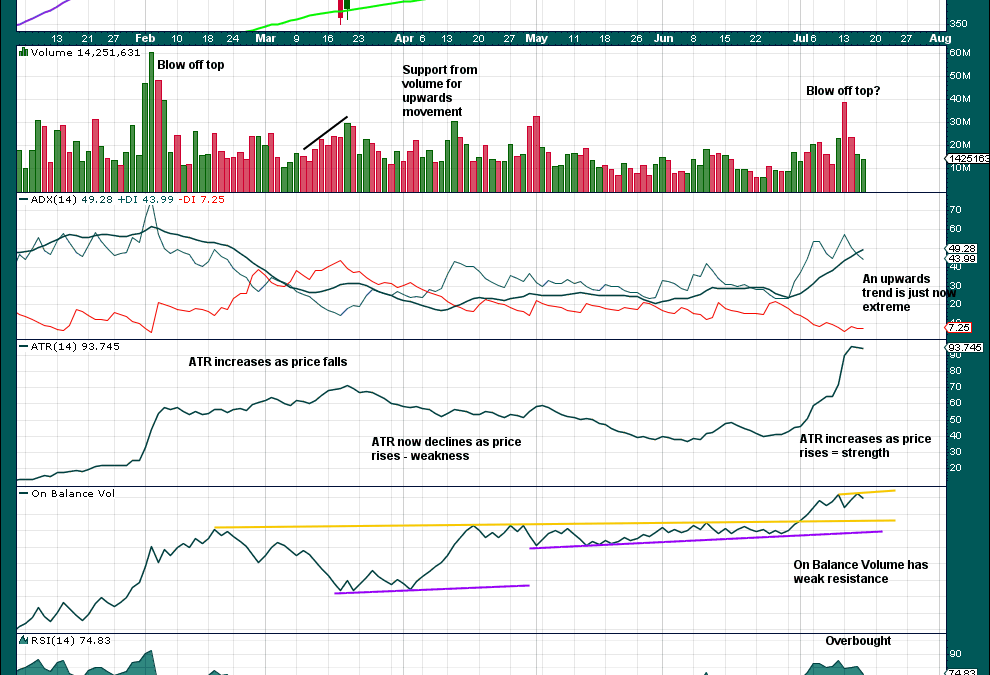
TSLA: Technical Analysis | Charts – July 16, 2020 Summary: While price remains above 1,228, it may be safest to assume the upwards trend remains intact. A target calculated from a pennant pattern is at 2,393. MONTHLY CHART Click chart to enlarge. Longer-term bearish...
TSLA: Technical Analysis | Charts – April 23, 2020

TSLA: Technical Analysis | Charts – April 23, 2020

by Lara | Apr 23, 2020 | Public Analysis, TSLA

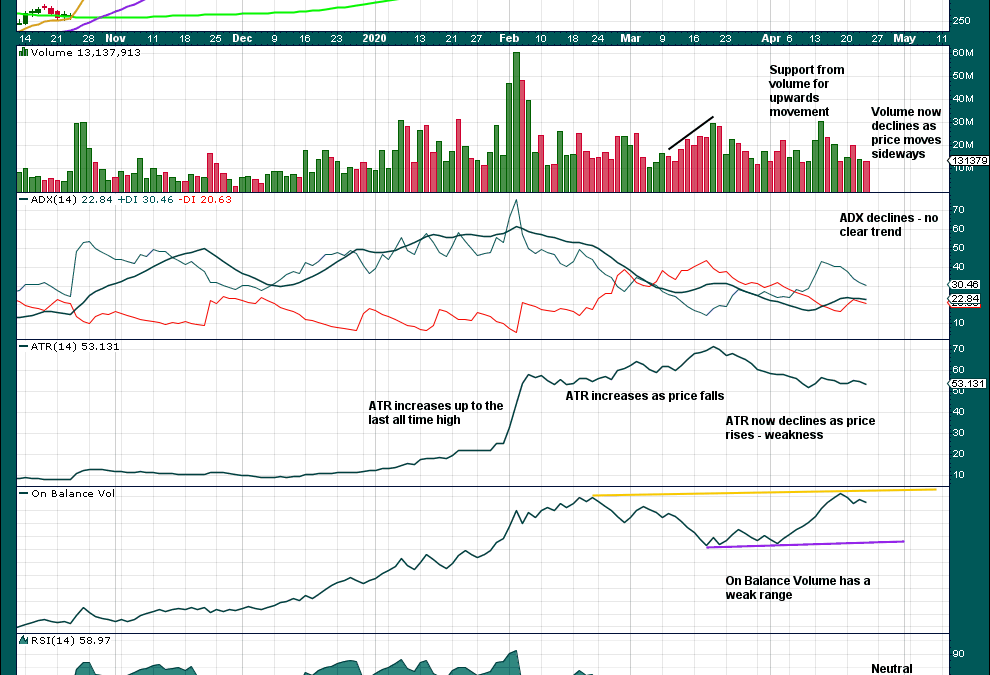
TSLA: Technical Analysis | Charts – April 23, 2020 It is possible that TSLA may have a sustainable high in place. Summary: There is reasonable risk here of more downwards movement. A new low below 652 would indicate a bounce may be over. However, expect more upwards...

MEMBERS LOGIN

You are not currently logged in.


» Lost your Password?

Free Elliott Wave Structures Guide

Elliott Wave Stock Market - Elliott Wave Structures Guide

Free Wave Notation

Elliott Wave Stock Market - Wave Notation

Categories

Archives

Partners


* When you purchase a MotiveWave product via links on this website, you won't pay a penny more, but I'll get a small commission.
  • Facebook
  • Twitter
© Elliott Wave Stock Market
This EWSM website uses cookies to ensure members and visitors get the best experience. By continuing, you agree to the use of cookies on this website. - To learn more see TOS.