by Lara | Apr 3, 2020 | Stocks
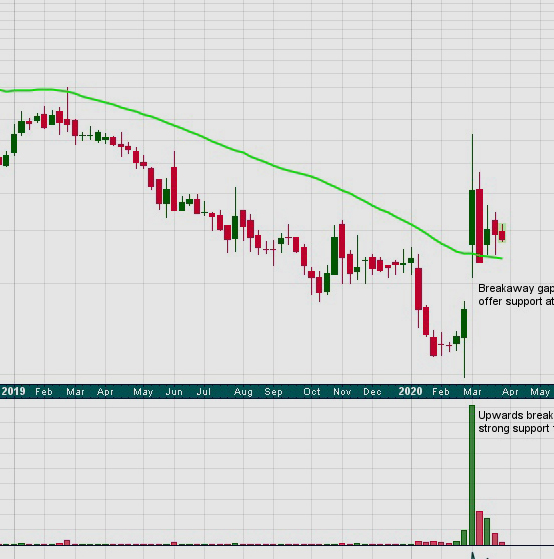
Technical Analysis of Stocks – Health Care Sector | Charts – April 2, 2020 Analysis of stocks of companies that are working on treatments or vaccines that target the infection caused by the Covid-19 virus. Download PDF report here. Published @ 12:07 a.m. EST on...
by Lara | Nov 5, 2019 | TRENDS Monthly
A new TRENDS Monthly report is now available. The TRENDS Monthly report is available from: Invysis.com. About: In TRENDS Monthly I combine technical analysis with relative rotation graph analysis and macroeconomic analysis to identify stocks within the S&P 500...
by Lara | Oct 6, 2019 | TRENDS Monthly
A new TRENDS Monthly report is now available. The TRENDS Monthly report is available from: Invysis.com. About: In TRENDS Monthly I combine technical analysis with relative rotation graph analysis and macroeconomic analysis to identify stocks within the S&P 500...
by Lara | Sep 2, 2017 | EW Education, Public Analysis, S&P 500 |
I mentioned in comments on Thursday that I wanted to illustrate a real life example of an expanded flat. The concept is important when trading corrections. Click chart to enlarge. I did not have to go far back at all to find a good example of this very common...
by Lara | Aug 12, 2017 | EW Education, Public Analysis, S&P 500, Trading Tips
This chart was published two days ago. At that time, it was warned that the possible upwards breakout of the 8th of August lacked support from volume and may turn out to be false: Click chart to enlarge. That was proven correct. The strong downwards movement from the...
by Lara | Aug 9, 2017 | EW Education, Public Analysis, S&P 500, Trading Tips
After a consolidation price will break out. The presence or absence of support from volume on the breakout tells us how reliable the breakout may be. Click chart to enlarge. Pennant patterns are one of the most reliable continuation patterns. But in an upwards trend...
by Lara | Jul 3, 2017 | Public Analysis, S&P 500, S&P 500 + DJIA |
This video is of the process of developing an alternate Elliott wave count for the S&P 500, using the MotiveWave analysis platform, and shows the steps I go through and my train of thought.
by Lara | Jul 11, 2015 | HSI, NZ50 |
I’ve been following the New Zealand stock market for a while now. This is the first time I’ve shared this analysis with members and the general public. I’ve also more recently with interest been watching what’s happening in China and Hong Kong....
by Lara | Oct 1, 2014 | Russell 2000, Russell 2000 Historical
Click on charts to enlarge. Data available extends back only to the end of 1987. Data begins with the 1987 “crash” which I am labeling a cycle degree second wave correction. A five wave impulse for a super cycle wave (I) ended in March, 2000. Ratios of...


