
I’ve been following the New Zealand stock market for a while now. This is the first time I’ve shared this analysis with members and the general public.
I’ve also more recently with interest been watching what’s happening in China and Hong Kong.
Note: This analysis is not a full Elliott wave analysis, but just the analysis I’ve already done for these markets to date.
NZ50 ELLIOTT WAVE AND TECHNICAL ANALYSIS
Click chart to enlarge.
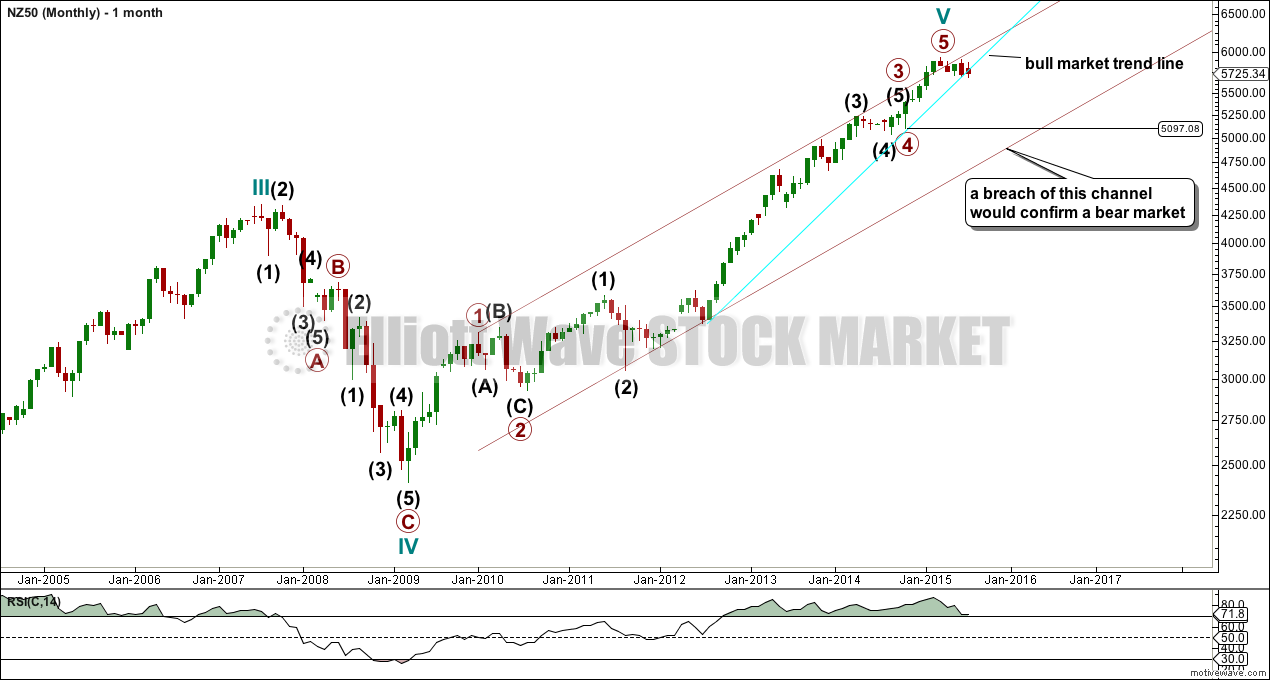
For the NZ50 to confirm a bear market I would want to see:
1. A breach of the aqua blue bull market trend line by a close of 3% or more of market value below that line. (The trend line is breached on the daily chart at 5,846.97, so we need a close at 5,674.56 or below.)
2. A new swing low below the end of primary wave 4 at 5,097.08.
3. A breach of the maroon trend channel on the monthly chart.
While the bull market trend line is not breached by 3% or more a bull market should be expected to remain intact. Primary wave 5 may yet continue higher.
I am confident that my labelling of primary waves 1 through to 4 is correct. Primary wave 3 is just 1.1 points short of 2.618 the length of primary wave 1. This is a remarkable Fibonacci ratio between waves which lasted 10 and 54 months, respectively.
One cause for concern at the monthly chart level is there is so little divergence between price and RSI at the recent high. The last time the NZ50 saw a big bear market was preceded by years of strong persistent divergence between price and RSI. That it is not happening now may indicate primary wave 5 may not be over. There is no Fibonacci ratio between primary wave 5 and either of 1 or 3.

Click chart to enlarge.
Primary wave 2 was a deeper 0.43 flat correction, and primary wave 4 was a more shallow 0.08 zigzag.
Within primary wave 3, there is no Fibonacci ratio between intermediate waves (3) and (1), but intermediate wave (5) is just 0.9 points longer than 0.382 the length of intermediate wave (1).
There is negative divergence between price and MACD at the weekly chart level.
Click chart to enlarge.
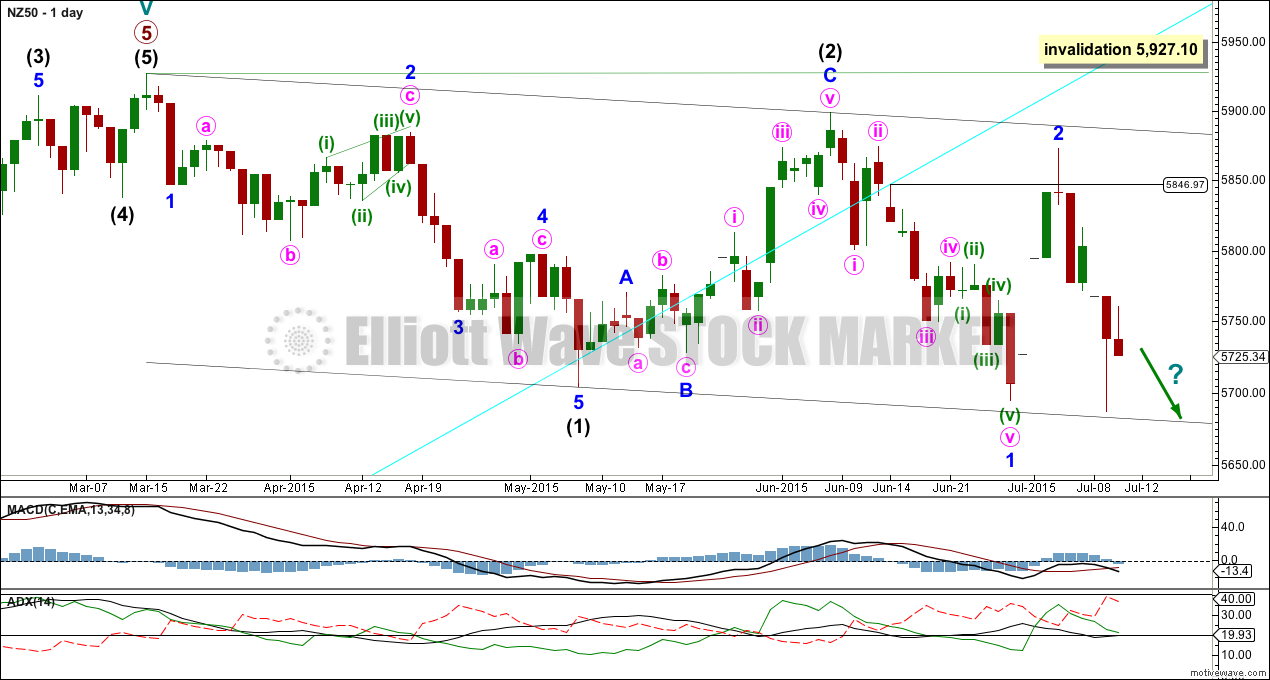
At the daily chart level, primary wave 5 is off to the left of the chart. Within primary wave 5, there are no Fibonacci ratios between intermediate waves (1), (3), and (5). Intermediate wave (2) is a 0.29 zigzag and intermediate wave (4) is a 0.14 flat correction; there is perfect alternation.
So far, since the last all time high at 5,927.10 on 16th March, there looks like what is a clear five down on the daily chart which was followed by a three up. Another five down has made a new low very recently and thursday last week saw a new low below that, and so this movement cannot be labelled A-B-C because a new low has been made after it was done. It would better be labelled 1-2, 1-2. This indicates some strong downwards movement next week as the middle of a third wave down begins.
ADX does not yet indicate a trend, however, and the market has been moving sideways in a range although the movement has a slight downwards slope.
The bull market trend line which goes back to June 2012 was breached about 5,846.97. If next week continues down as I expect, and we see a close at 5,674.56 or below, then I would have a little more confidence in expecting the NZ stock market is in a bear market. Next week shall be interesting.
AUCKLAND PROPERTY MARKET TECHNICAL ANALYSIS
Click chart to enlarge.
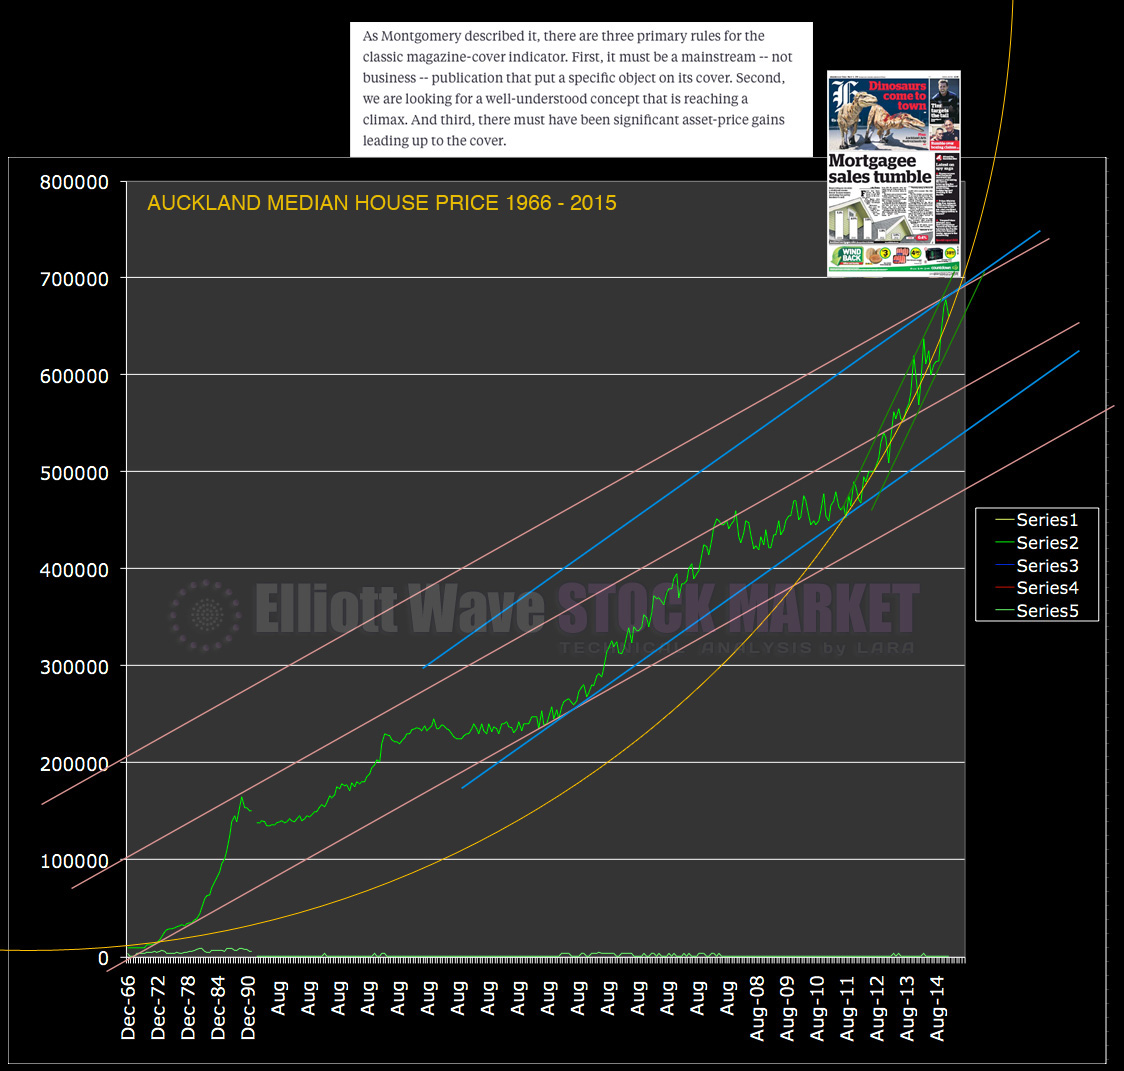
There looks like a fairly typical looking bubble developing in the Auckland Property market (Auckland has about 1/3 of the NZ population, so this is our largest market). The problem with bubbles and the problem with highs is they’re ridiculously difficult to pick an end for. Therefore, in this instance, I would use trend lines: if the lines are breached to the downside, then the bubble has most likely burst.
While New Zealand’s government debt has been rising in recent years, it is still relatively low in comparison to other countries. Currently, the debt is at 35.9% of GDP, so the country may be in a reasonable state to weather another economic downturn. However, household debt is not looking very healthy and looks to possibly have just last month reached new highs, over 160% of disposable income. It may be that recent entrants into the overheated Auckland property market are over-leveraged and are not ready to withstand an economic downturn.
The magazine cover on the chart is from the NZ Herald Property supplement section, from March 2015, and meets the criteria for a classic magazine cover indicator of a bubble / high.
New Zealand was affected economically during the Global Financial Crisis (or Credit Crunch), but not on the same scale as the USA or Europe. Comments from members and readers in New Zealand (or world wide) about NZ50 and Auckland property market are welcomed.
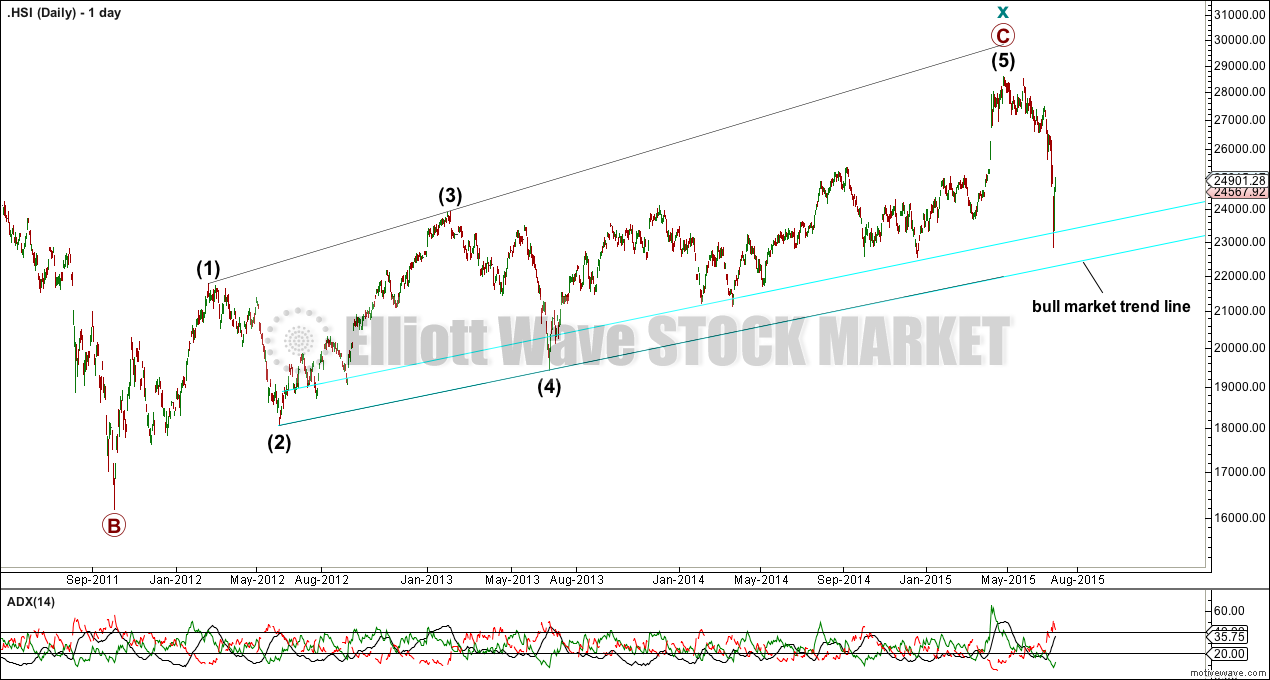
HANG SENG INDEX ELLIOTT WAVE AND TECHNICAL ANALYSIS
Click chart to enlarge.
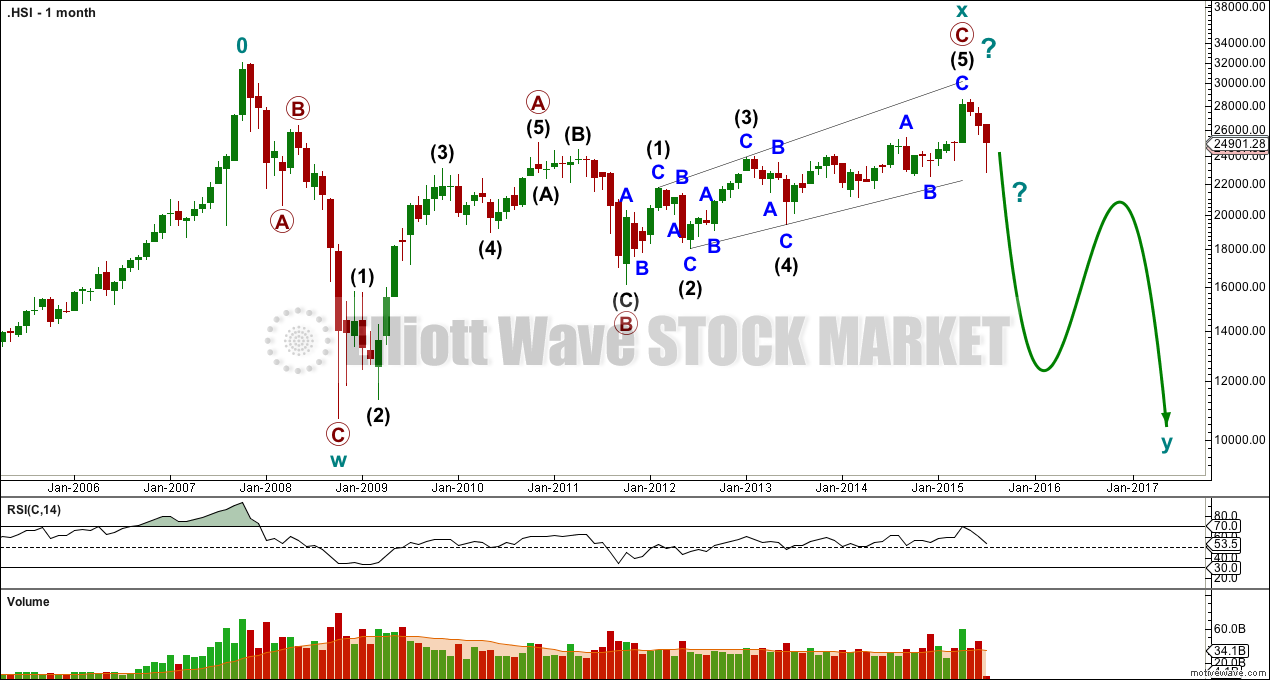
The most recent rise on HSI, from the end of primary wave B, does not look at all like a third wave, not even the start of it.
The big drop for the GFC (to the low of October 2008) subdivides as a three. The following wave up also subdivides as a completed three, but it is less than 90% of the prior drop. So this cannot be a big flat correction and is more likely to be a huge combination, or less likely a double zigzag. A combination may be more likely because they tend to have deep X waves whereas double zigzags tend to have rather shallow X waves.
Within cycle wave X, primary wave C subdivides as a completed ending expanding diagonal. Because the diagonal is expanding, there is no (theoretical) limit to how long the final fifth wave can be so most certainly it could continue higher yet.
For a bear market to be indicated for HSI I would want to see the following things:
1. A new swing low below the last major low at 23,252.63 (the end of minor wave B within intermediate wave (5) ).
2. A breach of the bull market trend line (on the daily chart below) by a close of 3% or more of market value. This line is not yet met.
RSI did not reach overbought levels on the monthly chart just before the DotCom crash of 2000 – 2003, but it did though for the crash prior to that, the Asian Crash of 1997, which was preceded by RSI twice reaching overbought levels (but it showed no divergence).
At the peak of 2007, before the Global Financial Crisis, RSI was heavily overbought, but there was no divergence and RSI moved strongly higher right up to the peak and then fell with price.
Again, RSI is close to being overbought (not there yet), but it does not appear to be a reliable indicator for HSI (unlike the S&P500).
Volume data for July is incomplete (because the month is incomplete), and the volume for June shows an increase beyond that of May, and both months have reasonable volume. This increase in volume supports the fall in price.
Volume spiked on the last upwards month for April, which is very typical behaviour for the end of a rise in price.
Click chart to enlarge.
The double trend line has worked so far nicely to show where the bull market has been finding support.
The ending diagonal is most likely complete, but it is still possible that intermediate wave (5) could continue higher. When the bull market trend line is breached, then the fifth wave zigzag would break below the (2)-(4) diagonal trend line, which is the same as the bull market trend line, so the possibility that intermediate wave (5) could continue higher would be extremely unlikely.
The recent fall on HSI is 20% of its market value. ADX is clear and strong: there is a trend and it is down.
The high for HSI was 29th April. NZ50 had its high later, on 16th March.
According to the chart it looks like the current wave down should be at primary degree. If around a thirty percent loss was registered in just under a month, this could be the swiftest primary degree decline on record.
Asset bubbles are peculiar in that they all have one thing in common – they all burst eventually. The HSI has shed over three trillion of equity evaluation in less than a month.
This is the equivalent of of 75% of the FED’s 4 trillion balance sheet which is backed with capital reserves of only 56 billion. They are going to work mightily to keep this bubble inflated; their very survival depends on it. I suspect the parabolic rise of the Aukland median home price is going to end the way all the previous ones did.
Yep. So do I.
And to reinforce that view most NZers ATM seem confident that there’s no bubble, this situation is different, and prices may slow but can never fall.