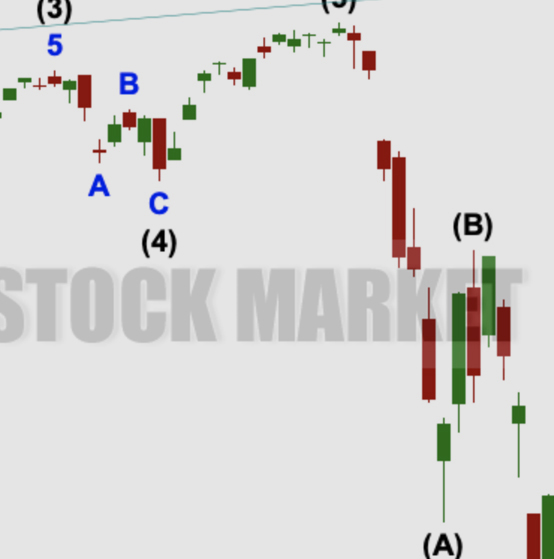
by Lara | Mar 16, 2021 | S&P 500, S&P 500 + DJIA
S&P 500: Elliott Wave and Technical Analysis | Charts – March 16, 2021 A little more upwards movement today with a session that closed red overall fits the expectations for the Elliott wave count, but a small decline in breadth and an increase in VVIX suggest...
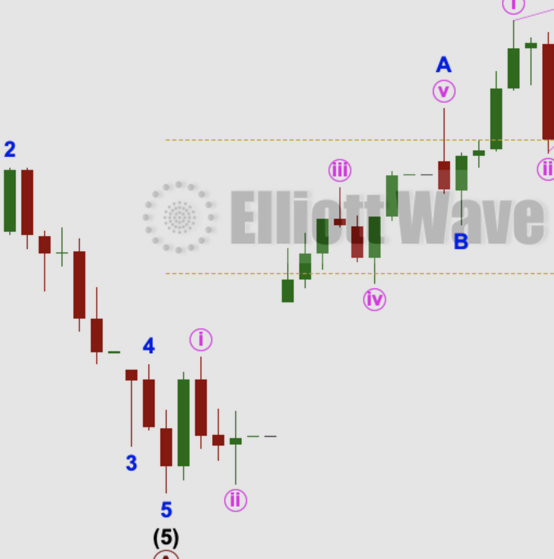
by Lara | Mar 15, 2021 | S&P 500, S&P 500 + DJIA
S&P 500: Elliott Wave and Technical Analysis | Charts – March 15, 2021 The upwards trend continues exactly as this analysis has expected for months. Pullbacks are a normal and to be expected part of an upwards trend. Summary: Both main and alternate wave counts...
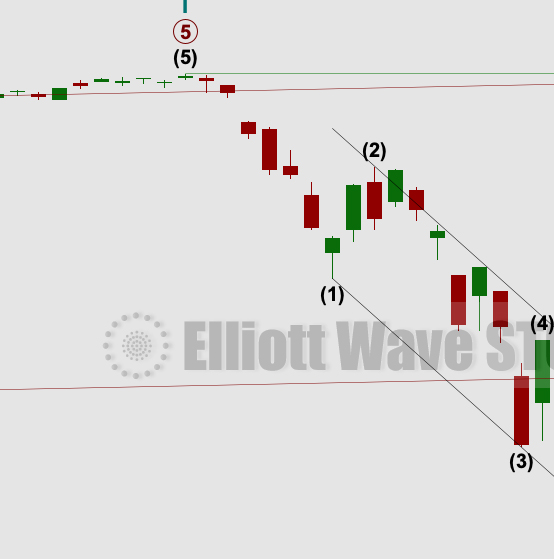
by Lara | Feb 19, 2021 | S&P 500, S&P 500 + DJIA
S&P 500: Elliott Wave and Technical Analysis | Charts – February 19, 2021 A small range upwards week closes red. Overall, price continues to move higher towards targets, with normal corrections along the way. Summary: The current pullback is still expected to be...

by Lara | Feb 18, 2021 | S&P 500, S&P 500 + DJIA
S&P 500: Elliott Wave and Technical Analysis | Charts – February 18, 2021 A little more downwards movement remains above support and above the short-term Elliott wave invalidation point. Summary: The current pullback is still expected to be short term in nature....
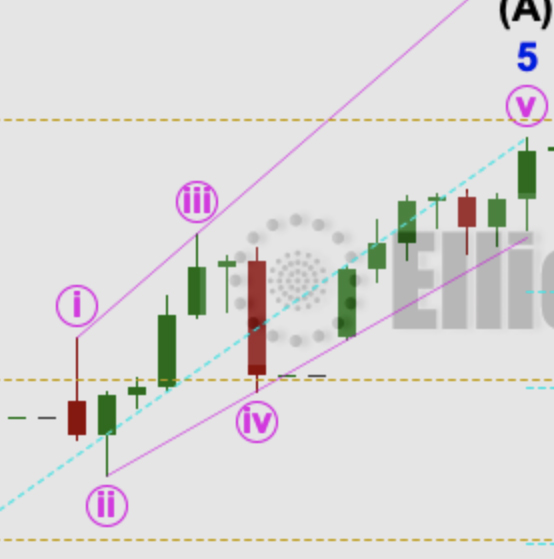
by Lara | Jan 27, 2021 | S&P 500, S&P 500 + DJIA
S&P 500: Elliott Wave and Technical Analysis | Charts – January 27, 2021 A little more downwards movement was expected, but the main Elliott wave count was invalidated. Downwards movement leaves the alternate Elliott wave count valid today. Summary: Both main and...
by Lara | Jan 26, 2021 | S&P 500, S&P 500 + DJIA
S&P 500: Elliott Wave and Technical Analysis | Charts – January 26, 2021 A new all time high from price continues the upwards trend as expected by the main Elliott wave count. Summary: The wave count expects the low of the 30th of October to not be breached for...
by Lara | Dec 31, 2020 | S&P 500, S&P 500 + DJIA
S&P 500: Elliott Wave and Technical Analysis | Charts – December 31, 2020 The year ends with new all time highs from both price and the AD line. This is exactly in line with the larger picture from the Elliott wave count. Summary: The wave count expects the low...

by Lara | Dec 30, 2020 | S&P 500, S&P 500 + DJIA
S&P 500: Elliott Wave and Technical Analysis | Charts – December 30, 2020 A small range inside day leaves the Elliott wave count unchanged. Today the AD line gives a signal suggesting the direction for tomorrow. Summary: The wave count expects the low of the 30th...

by Lara | Dec 7, 2020 | S&P 500, S&P 500 + DJIA
S&P 500: Elliott Wave and Technical Analysis | Charts – December 7, 2020 A small range inside day leaves the Elliott wave count mostly unchanged. Summary: The wave count expects the low of the 30th of October to not be breached. A new mid-term target is at 3,785....


