
S&P 500: Elliott Wave and Technical Analysis | Charts – February 18, 2021
A little more downwards movement remains above support and above the short-term Elliott wave invalidation point.
Summary: The current pullback is still expected to be short term in nature.
Both main and alternate wave counts expect the low of the 30th of October to not be breached for many months.
The next targets for the upwards trend are first at 4,072 and then a zone at 4,585 – 4,606. About either of these targets another multi-week pullback or consolidation may develop.
An alternate wave count at the weekly chart level has an about even probability with the main weekly chart.
The biggest picture, Grand Super Cycle analysis, is here.
Monthly charts are last updated here with video here.
MAIN WAVE COUNT
WEEKLY CHART
Click chart to enlarge.
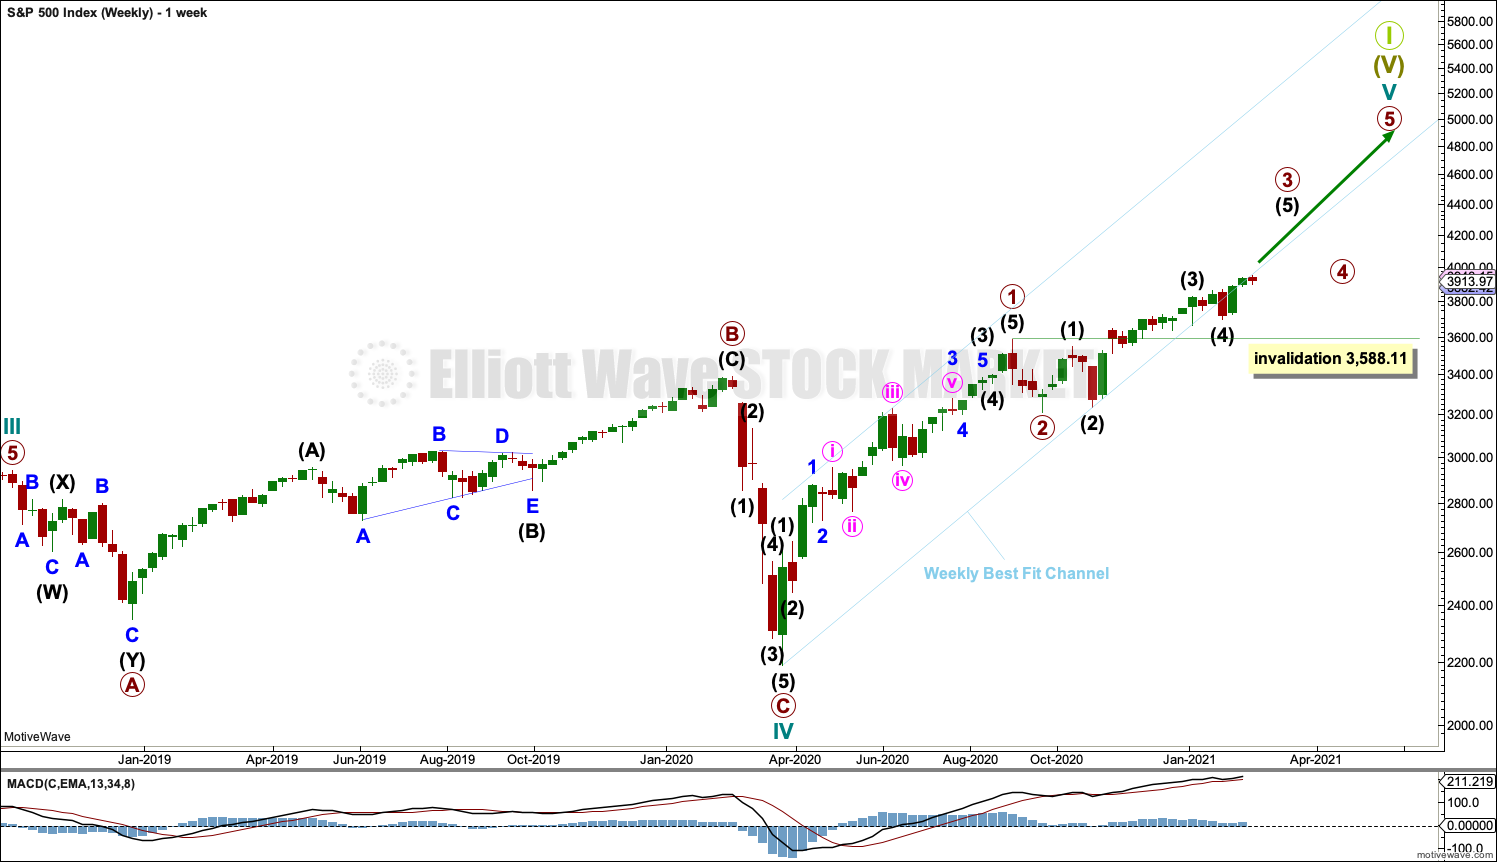
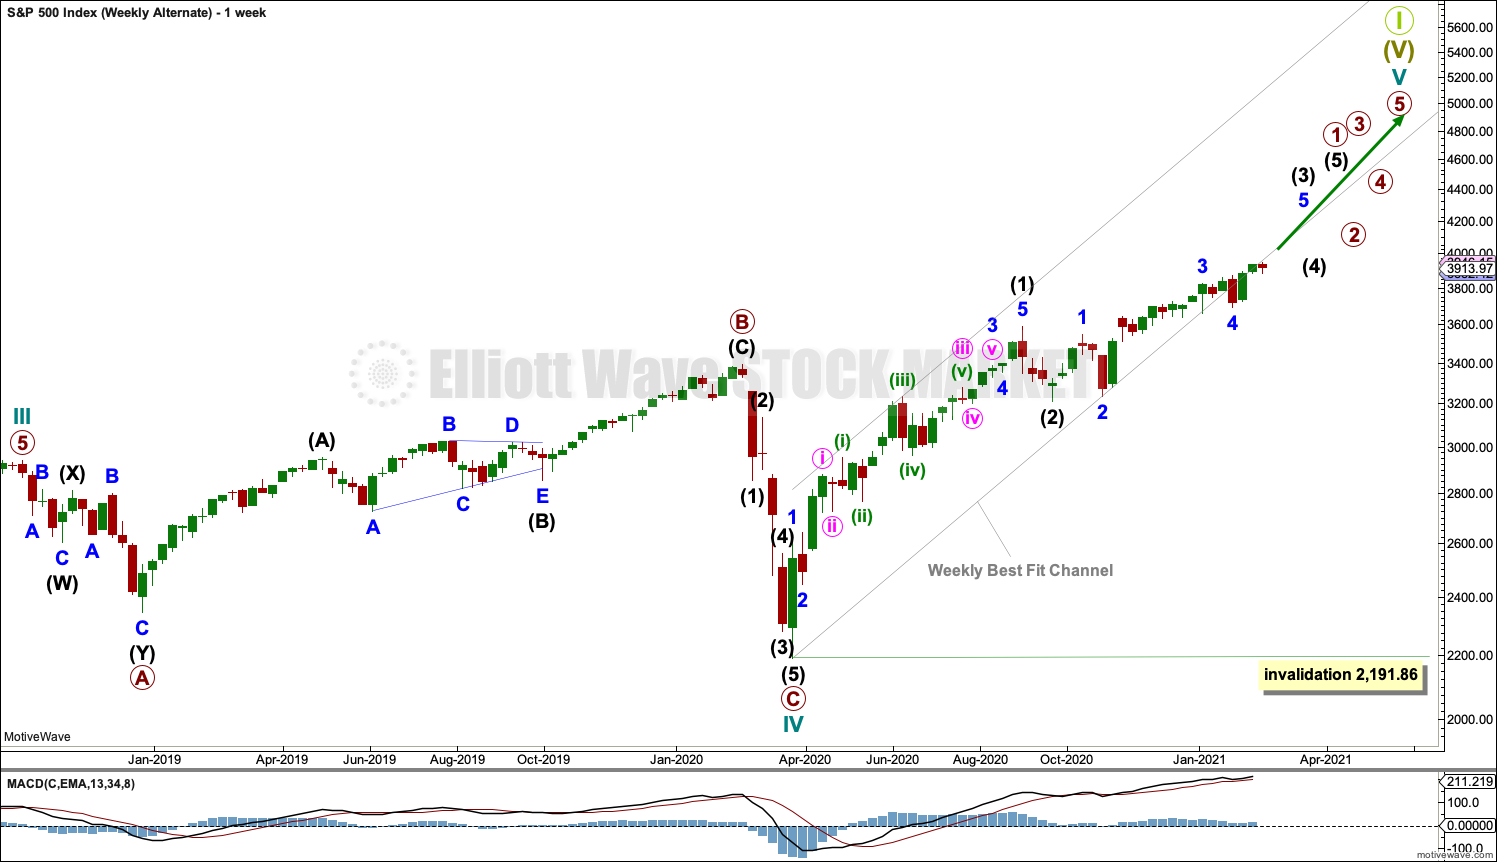
Cycle wave V may last from one to several years. So far it is in its tenth month.
This wave count may allow time for the AD line to diverge from price as price makes final highs before the end of the bull market. The AD line most commonly diverges a minimum of 4 months prior to the end of a bull market. A longer divergence is positively correlated with a deeper bear market. A shorter divergence is positively correlated with a more shallow bear market. With zero divergence at this stage, if a surprise bear market does develop here, then it would likely be shallow.
Cycle wave V would most likely subdivide as an impulse. But if overlapping develops, then an ending diagonal should be considered. This chart considers the more common impulse.
Primary waves 1 and 2 may be complete.
Primary wave 3 may only subdivide as an impulse.
Primary wave 3 has now moved well above the end of primary wave 1. Primary wave 4 may not move into primary wave 1 price territory below 3,588.11.
There is already a Fibonacci ratio between cycle waves I and III within Super Cycle wave (V). The S&P500 often exhibits a Fibonacci ratio between two of its actionary waves but rarely between all three; it is less likely that cycle wave V would exhibit a Fibonacci ratio. The target for Super Cycle wave (V) to end would best be calculated at primary degree, but that cannot be done until all of primary waves 1, 2, 3 and 4 are complete.
DAILY CHART
Click chart to enlarge.
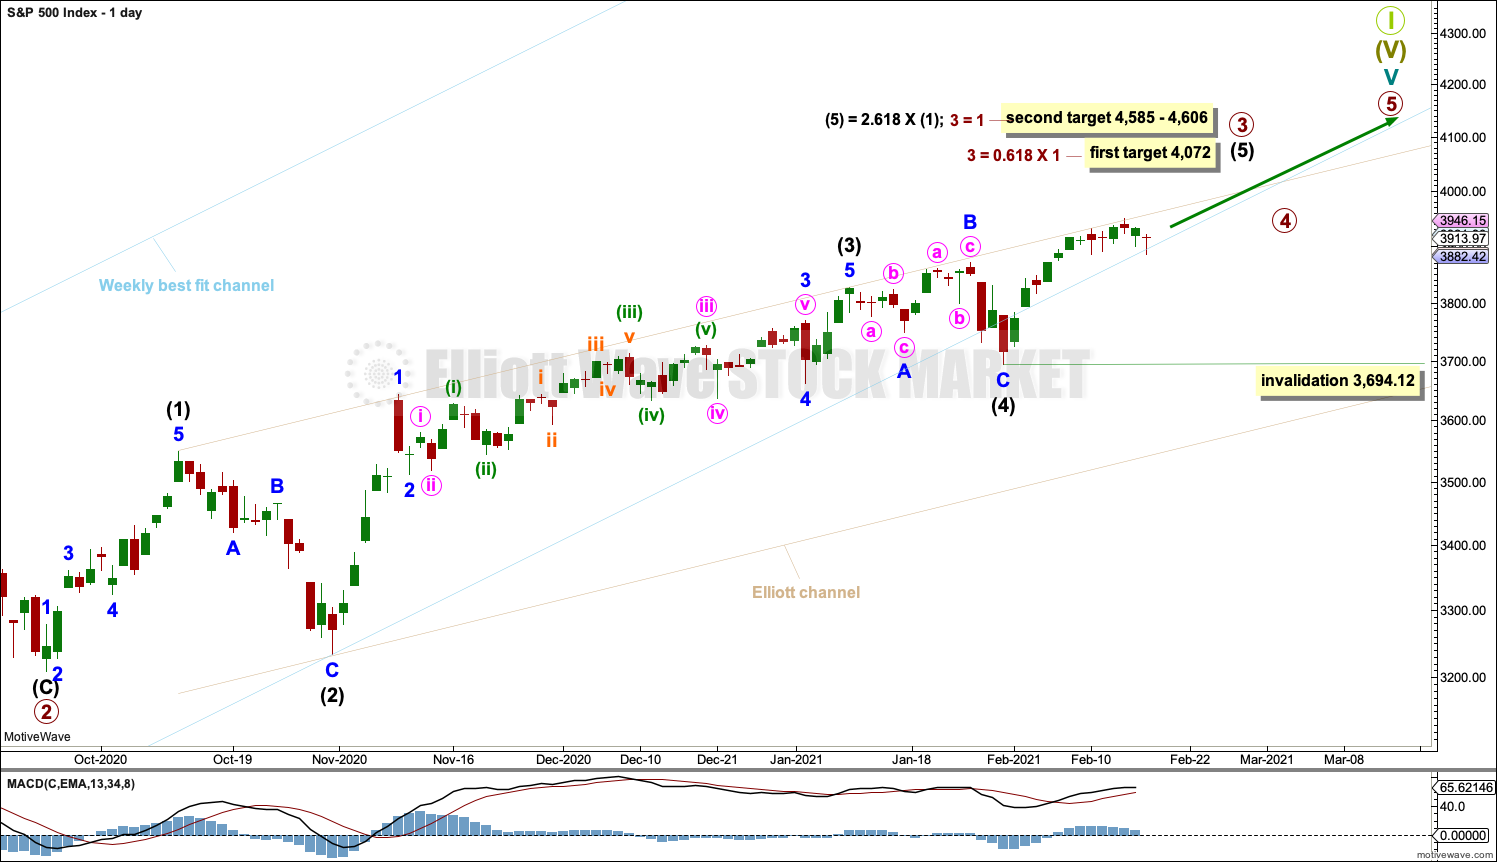
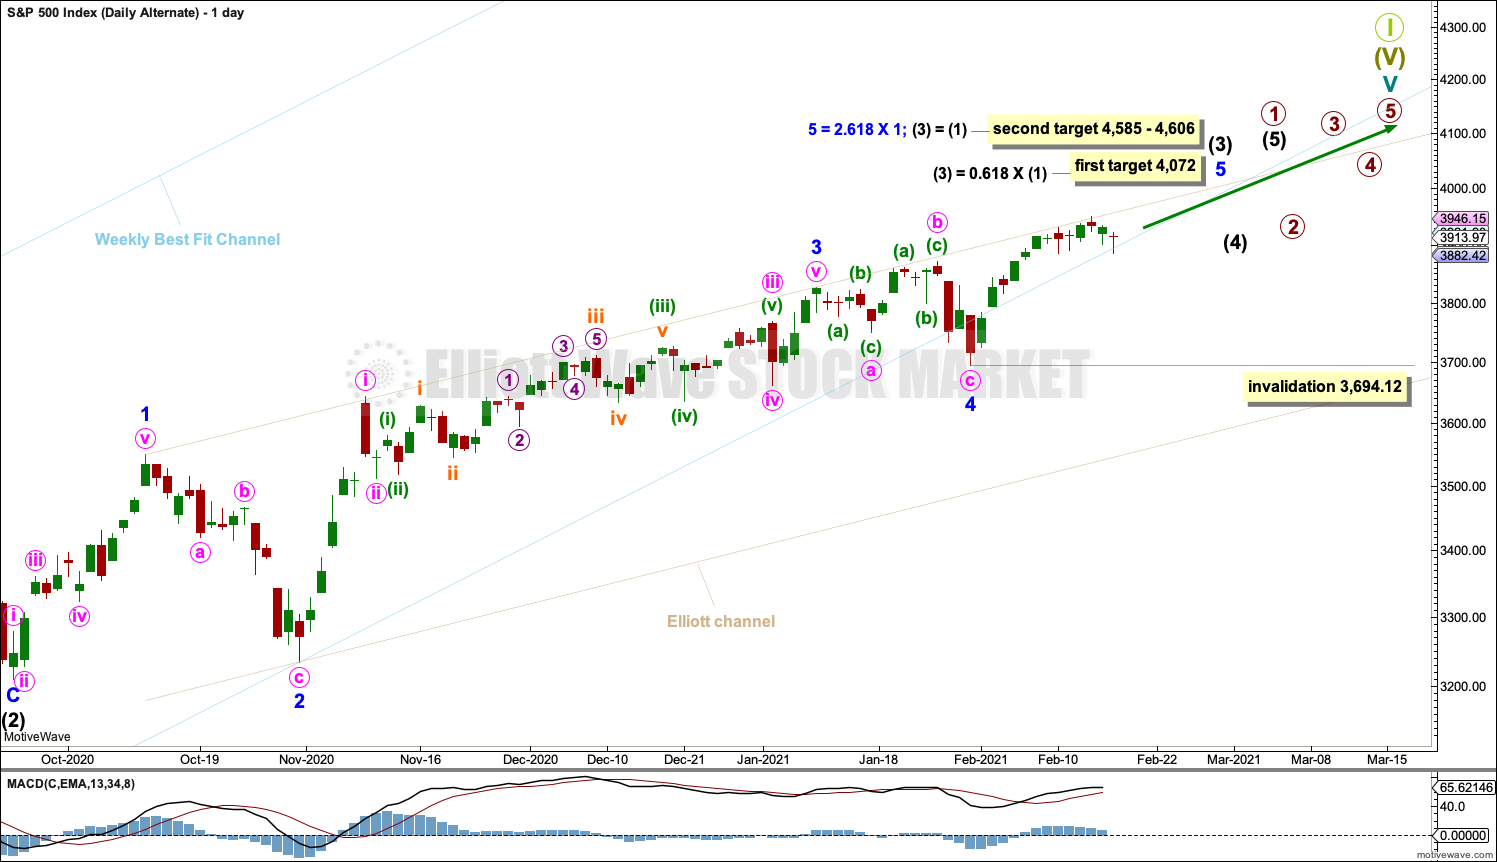
The daily chart focusses on the unfolding impulse of primary wave 3.
Primary wave 3 may only subdivide as an impulse.
Intermediate waves (1) through to (4) may be complete. Intermediate wave (5) may be underway.
Intermediate wave (2) was a very deep zigzag lasting 14 sessions. Intermediate wave (4) was an expanded flat lasting 14 sessions. There is alternation and perfect proportion between intermediate waves (4) and (2).
An Elliott channel is added in beige about primary wave 3. The upper edge may provide resistance and initiate pullbacks, which normally occur within an upwards trend.
The targets for primary wave 3 fit with the alternate hourly chart below.
Primary wave 1 looks extended. The second target for primary wave 3 expects it to also be extended.
No second wave correction within intermediate wave (5) may move beyond its start below 3,694.12.
MAIN HOURLY CHART
Click chart to enlarge.
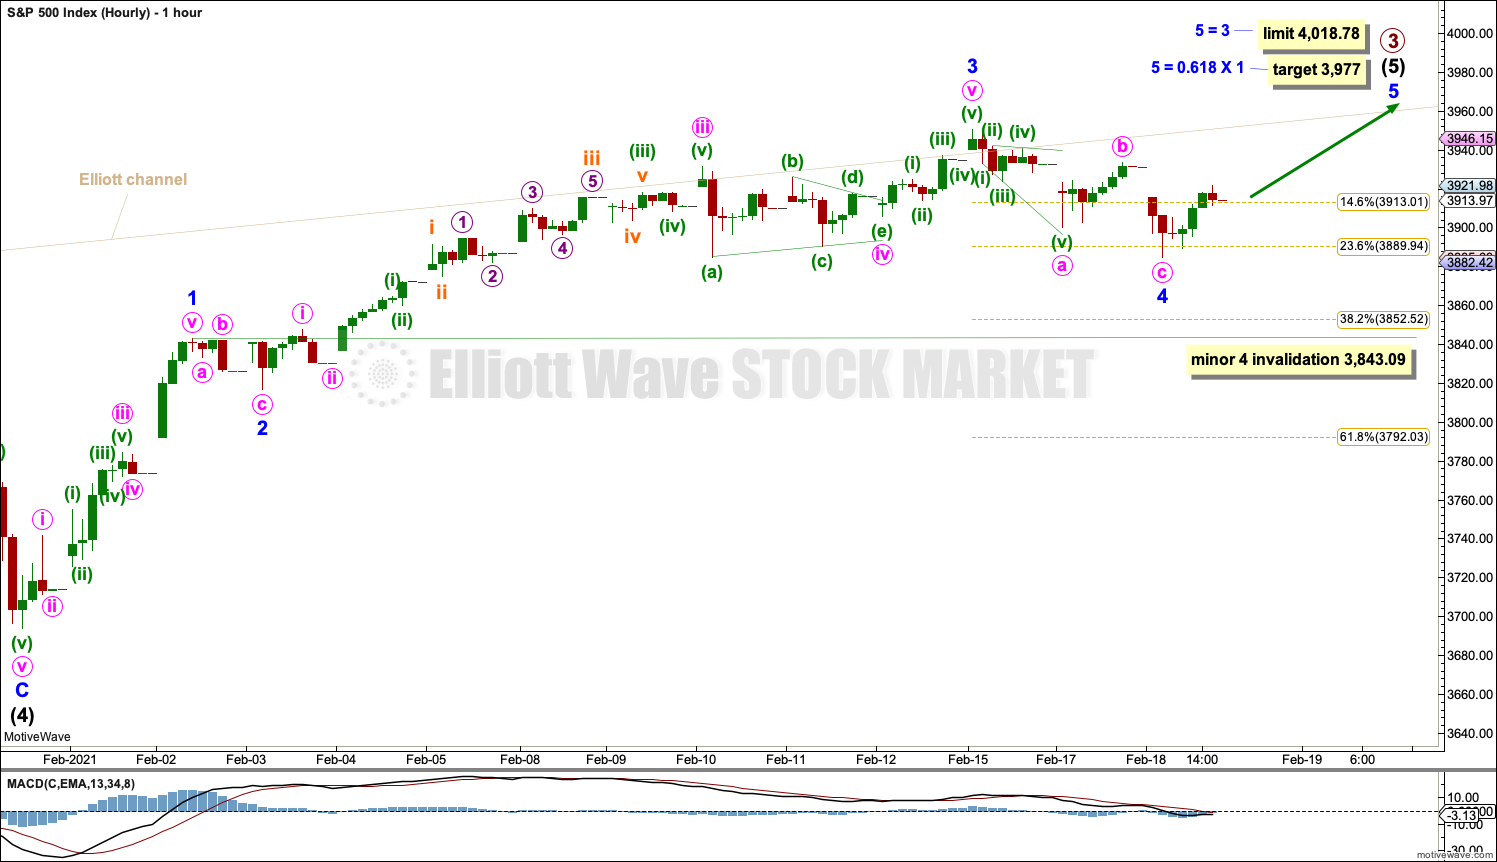
Intermediate wave (5) may subdivide as either an impulse or an ending diagonal. An impulse is much more common, so it is much more likely. An impulse will be expected until and unless overlapping suggests a diagonal should be considered.
Minor waves 1 through to 4 within intermediate wave (5) may be complete.
Minor wave 3 is shorter than minor wave 1. So that minor wave 3 may not be the shortest actionarly wave within the impulse of intermediate wave (5), minor wave 5 is limited to no longer than equality in length with minor wave 3.
If minor wave 4 continues lower as a double zigzag, then it may not move into minor wave 1 price territory below 3,843.09.
Occasionally, the S&P can behave a little like a commodity for the ends of its third wave impulses. There may be an increase in upwards momentum for the end of minor wave 5 to end intermediate wave (3).
However, prior to any expectation of an increase in upwards momentum the upper edge of the beige Elliott channel may be expected to again provide resistance. This trend line has initiated yet another pullback. Price is now below it. There is room again for price to rise. If that trend line is breached by upwards movement, then a release of energy may be seen for the end of minor wave 3.
This main wave count with a limit for minor wave 5 at 4,018.78 would see primary wave 3 shorter than primary wave 1.
ALTERNATE HOURLY CHART
Click chart to enlarge.
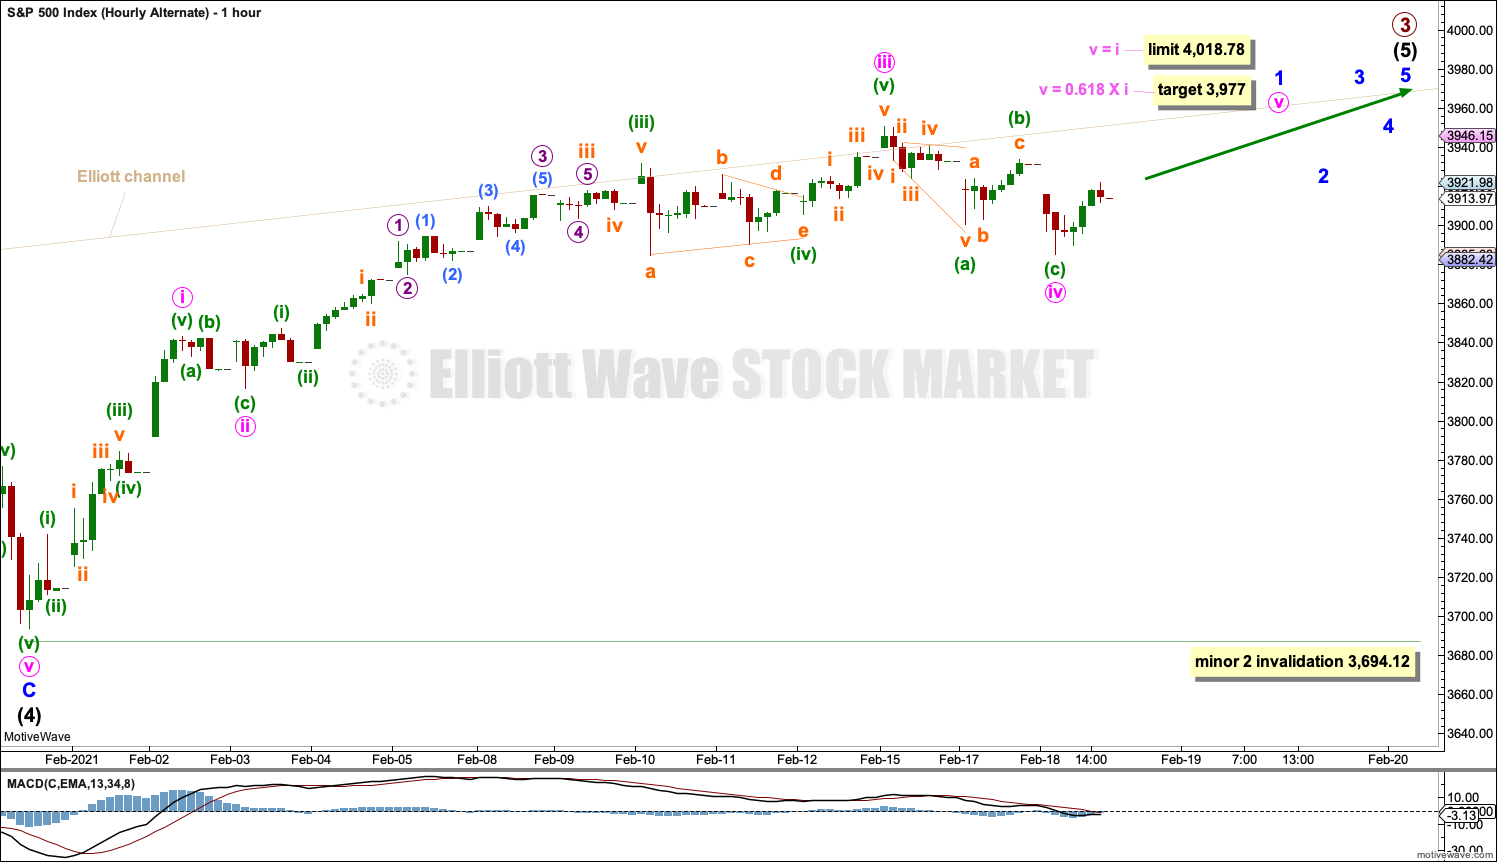
This alternate hourly wave count is the same as the main hourly wave count with the exception of the degree of labelling within intermediate wave (5). If the degree of labelling is moved down one degree, then only minor wave 1 within intermediate wave (5) may be nearing an end.
When minor wave 1 may be complete, then minor wave 2 may be a multi-day pullback or consolidation that may not move beyond the start of minor wave 1 below 3,694.12.
ALTERNATE WAVE COUNT
WEEKLY CHART
Click chart to enlarge.
This wave count is the same as the first weekly chart with the exception of the degree of labelling within cycle wave V.
If the degree of labelling within cycle wave V is moved down one degree, then only primary wave 1 may be currently unfolding. When primary wave 1 may be complete, then a multi-week pullback or consolidation may begin for primary wave 2. Primary wave 2 may not move beyond the start of primary wave 1 below 2,191.86.
This wave count is more bullish than the main weekly chart. It expects that cycle wave V may be in an earlier stage and may yet last many more years than the main weekly chart expects it to. These two weekly wave counts are of an even probability. In coming months to years classic technical analysis will be used to judge the probability of these two weekly wave counts.
DAILY CHART
Click chart to enlarge.
This wave count is the same as the first daily chart except the degree of labelling is one degree lower within primary wave 1.
The targets for a third wave up to end is the same.
TECHNICAL ANALYSIS
WEEKLY CHART
Click chart to enlarge. Chart courtesy of StockCharts.com.
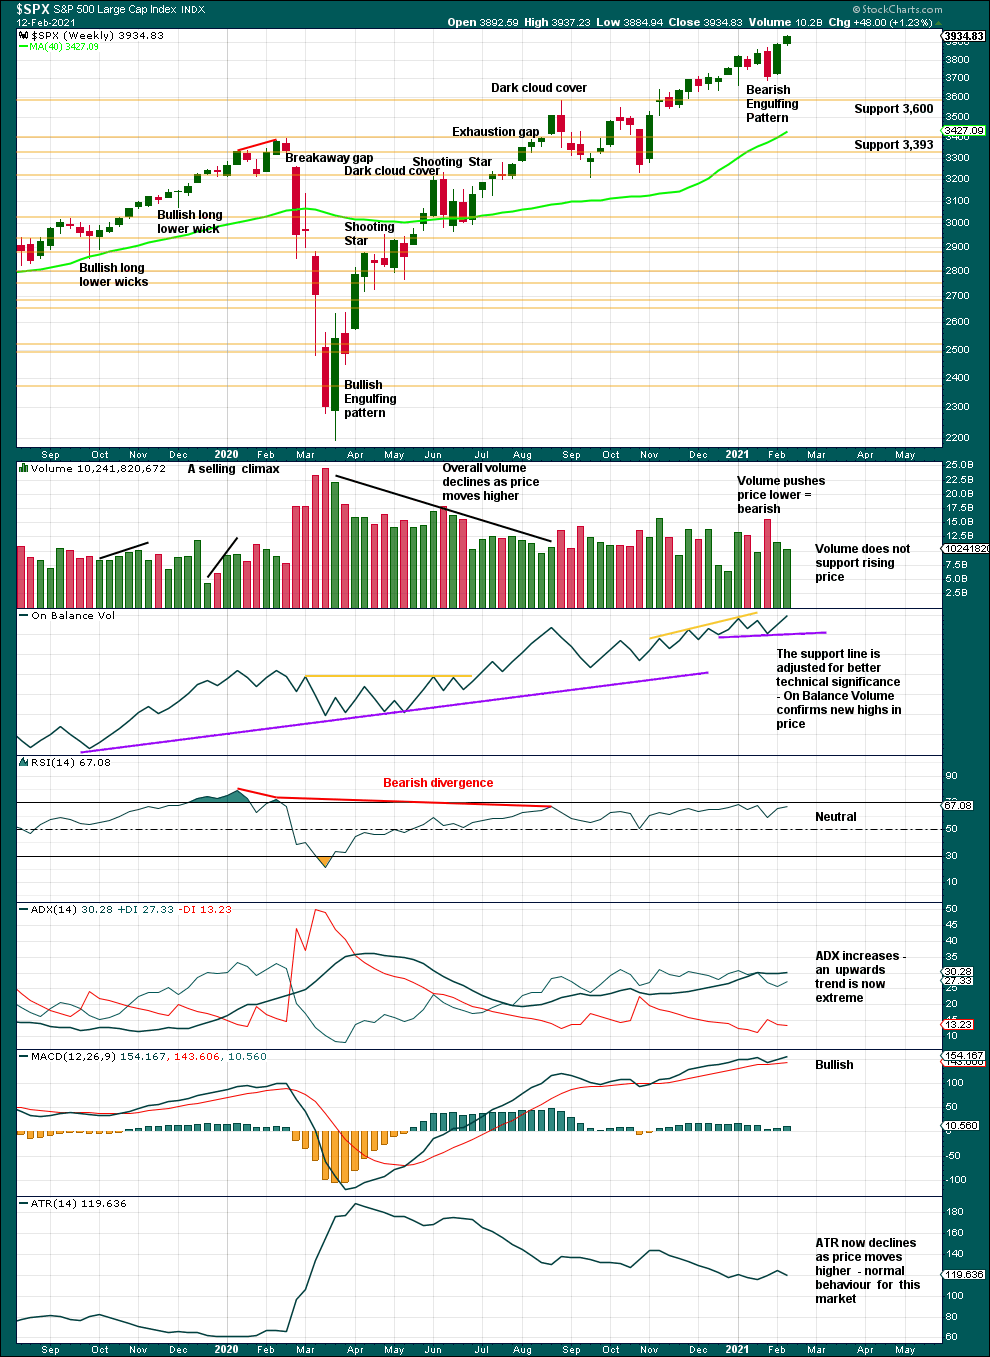
ADX indicates the trend is extreme because the ADX line is above both DX lines, but there is a long way to go before ADX reaches 45 and very extreme. This market has a strong bullish bias and extreme conditions can persist for reasonable periods of time while price travels a considerable distance.
A decline in volume last week is not of a concern in current market conditions. For years now this market has risen sustainably on light and declining volume, so it may yet be sustained for some more years. Eventually, when a bear market arrives, thin volume below may leave little support, which is concerning, but at this time there is no technical evidence of a bear market being imminent. The bull market continues.
DAILY CHART
Click chart to enlarge. Chart courtesy of StockCharts.com.
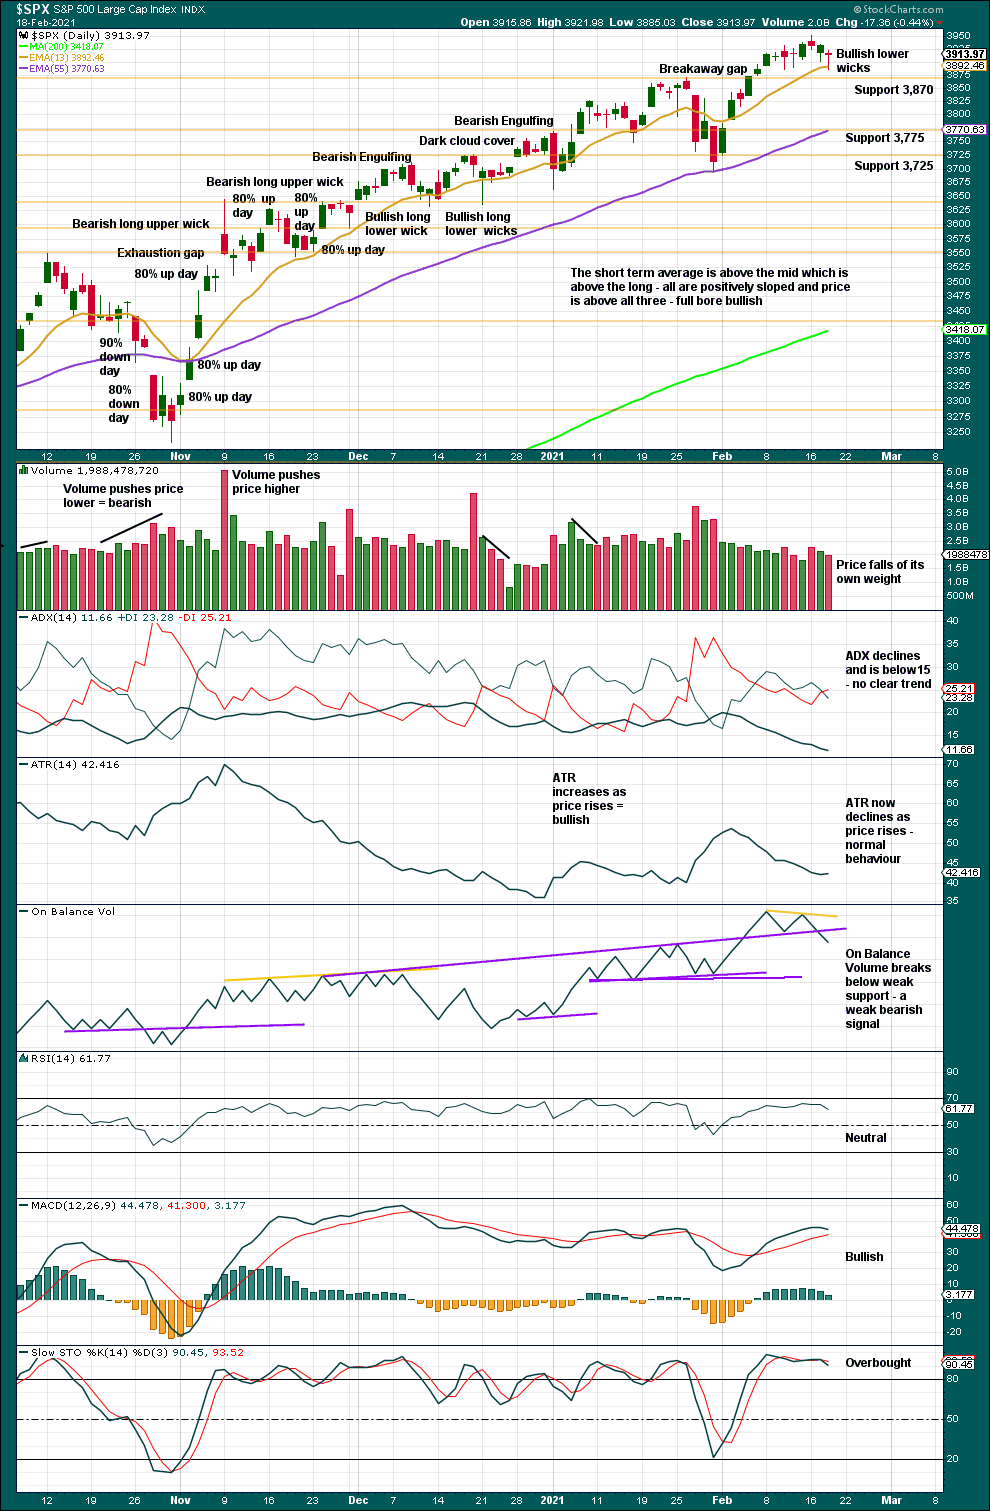
The series of higher highs and higher lows from the low of the 30th of October continues.
ADX is a lagging indicator. The many small pullbacks in this trend are causing it to lag in identifying an obvious upwards trend.
The breakaway gap may provide support for smaller pullbacks at this time. The lower edge of the gap is at 3,872.42. This gap remains open. After a break above resistance on 5th February, price has now curved down for a small pullback to test support. So far this looks like typical price behaviour. Support may hold and price would typically turn up from here.
The signal from On Balance Volume is bearish, but it is weak.
There is plenty of room for this upwards trend to continue before conditions become extreme.
BREADTH – AD LINE
WEEKLY CHART
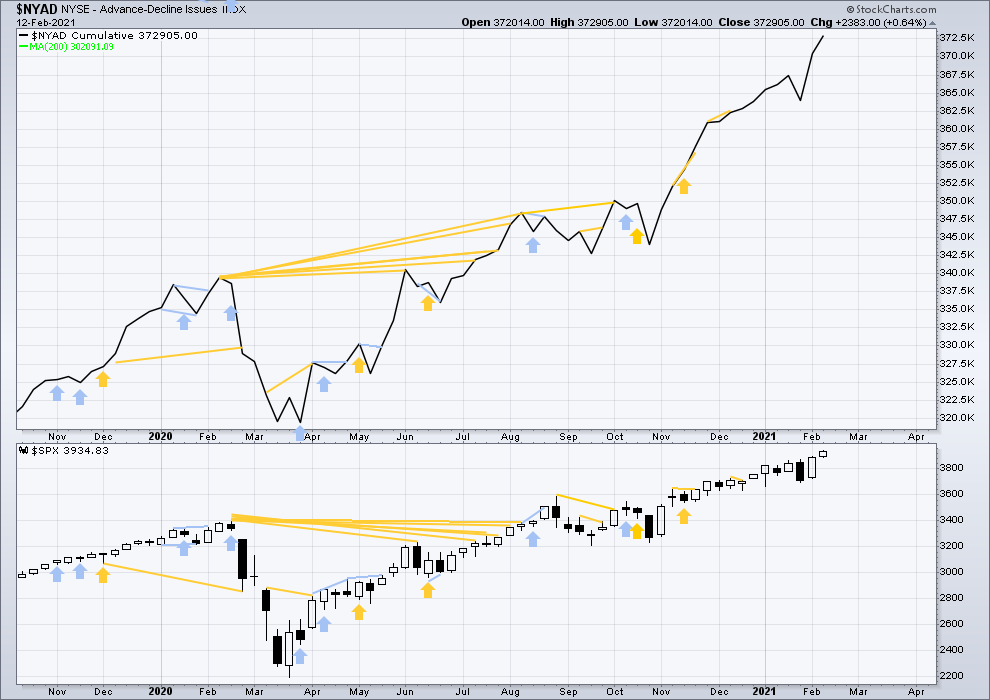
Click chart to enlarge. Chart courtesy of StockCharts.com. So that colour blind members are included, bearish signals will be noted with blue and bullish signals with yellow.
Breadth should be read as a leading indicator.
Lowry’s Operating Companies Only AD line has made a new all time high on the 10th of February. This is a strong bullish signal and supports the main Elliott wave count.
Large caps all time high: 3,950.43 on February 16, 2021.
Mid caps all time high: 2,563.15 on February 16, 2021.
Small caps all time high: 1,309.05 on February 16, 2021.
Last week both price and the AD line have made new all time highs. There is no divergence. Upwards movement has support from rising market breadth. This is bullish.
DAILY CHART
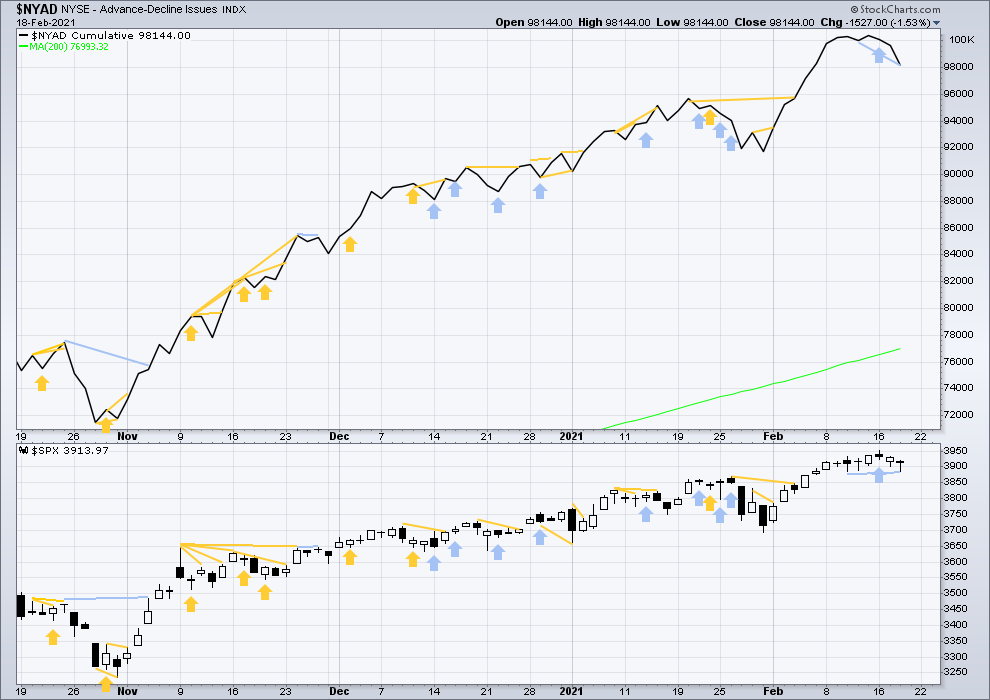
Click chart to enlarge. Chart courtesy of StockCharts.com. So that colour blind members are included, bearish signals will be noted with blue and bullish signals with yellow.
Today both price and the AD line have moved lower. The AD line has made a new short-term low below the prior low of the 11th of February, but price has not by a very small margin. This divergence is bearish for the short term, but it is weak.
VOLATILITY – INVERTED VIX CHART
WEEKLY CHART
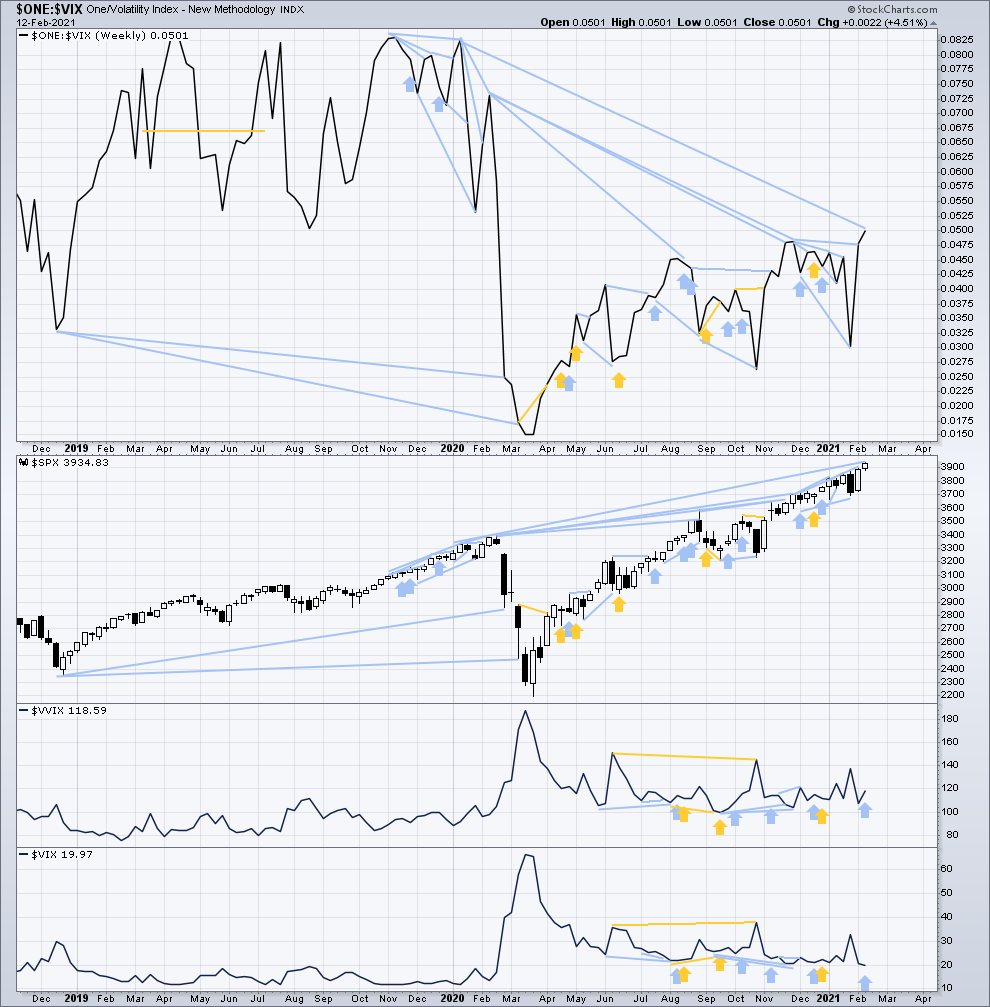
Click chart to enlarge. Chart courtesy of StockCharts.com. So that colour blind members are included, bearish signals will be noted with blue and bullish signals with yellow.
Inverted VIX remains well below all time highs. The all time high for inverted VIX was in the week beginning October 30, 2017. There is over 3 years of bearish divergence between price and inverted VIX. There is all of long, mid and short-term bearish divergence. This bearish divergence may develop further before the bull market ends. It may be a very early indicator of an upcoming bear market, but it is not proving to be useful in timing.
Last week both price and inverted VIX have moved higher. Price has made new all time highs, but inverted VIX has not. There is no longer short-term divergence, but mid and long-term bearish divergence remains.
Comparing VIX and VVIX: Last week VIX has moved lower as price has moved higher, a normal relationship. However, VVIX has moved higher. This is very short-term bearish divergence for price.
DAILY CHART
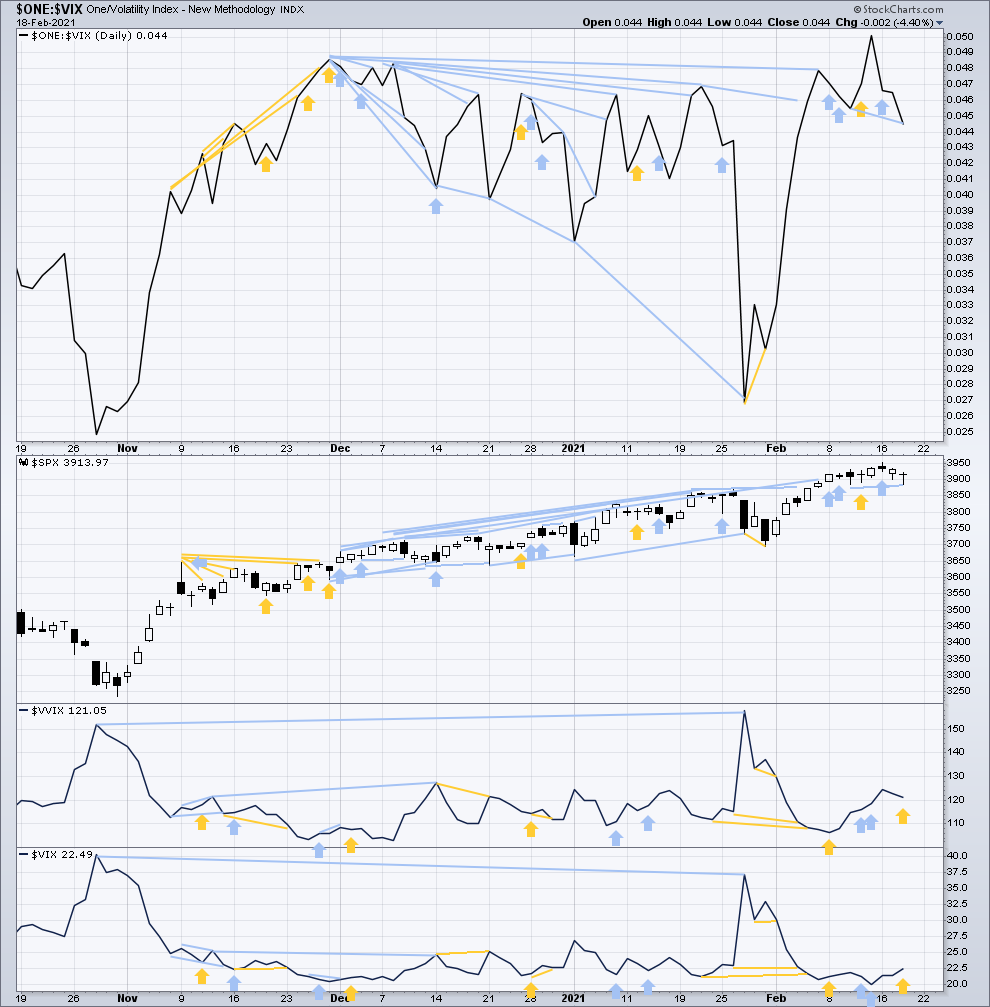
Click chart to enlarge. Chart courtesy of StockCharts.com. So that colour blind members are included, bearish signals will be noted with blue and bullish signals with yellow.
Today price and inverted VIX have both moved lower. Inverted VIX has made a new short-term swing low below the prior low of the 10th of February, but price has not by a small margin. This divergence is bearish for the short term, but it is weak.
Comparing VIX and VVIX at the daily chart level: VVIX has made a new high above the high of October 28, 2020, but VIX has not. This divergence remains bearish for the mid term. Today VIX has moved higher, but VVIX has moved lower. This very short-term bullish divergence contradicts bearish divergence between inverted VIX and price.
DOW THEORY
Dow Theory confirms a new bull market with new highs made on a closing basis:
DJIA: 29,568.57 – closed above on 16th November 2020.
DJT: 11,623.58 – closed above on 7th October 2020.
Adding in the S&P and Nasdaq for an extended Dow Theory, confirmation of a bull market would require new highs made on a closing basis:
S&P500: 3,393.52 – closed above on 21st August 2020.
Nasdaq: 9,838.37 – closed above on June 8, 2020.
The following major swing lows would need to be seen on a closing basis for Dow Theory to confirm a change from bull to a bear market:
DJIA: 18,213.65
DJT: 6,481.20
Adding in the S&P and Nasdaq for an extended Dow Theory, confirmation of a new bear market would require new lows on a closing basis:
S&P500: 2,191.86
Nasdaq: 6,631.42
Published @ 06:03 p.m. ET.
—
Careful risk management protects your trading account(s).
Follow my two Golden Rules:
1. Always trade with stops.
2. Risk only 1-5% of equity on any one trade.
—
New updates to this analysis are in bold.