
S&P 500: Elliott Wave and Technical Analysis | Charts – March 16, 2021
Summary: Both main and alternate wave counts (daily and weekly) expect the low of the 30th of October to not be breached for many months.
For the very short term, today bearish short-term divergence between price and the AD line, and between VIX and VVIX, warn of another pullback possibly beginning tomorrow. However, price is not yet at the upper edge of the channel on the daily chart, which has initiated several pullbacks. There is a little room for it to continue to move higher before resistance is met.
The next target for the upwards trend is at 4,464 and thereafter at 4,606. About this target another multi-week pullback or consolidation may develop.
An alternate wave count at the weekly chart level has a slightly lower probability with the main weekly chart.
The biggest picture, Grand Super Cycle analysis, is here.
Monthly charts are last updated here with video here.
MAIN WAVE COUNT
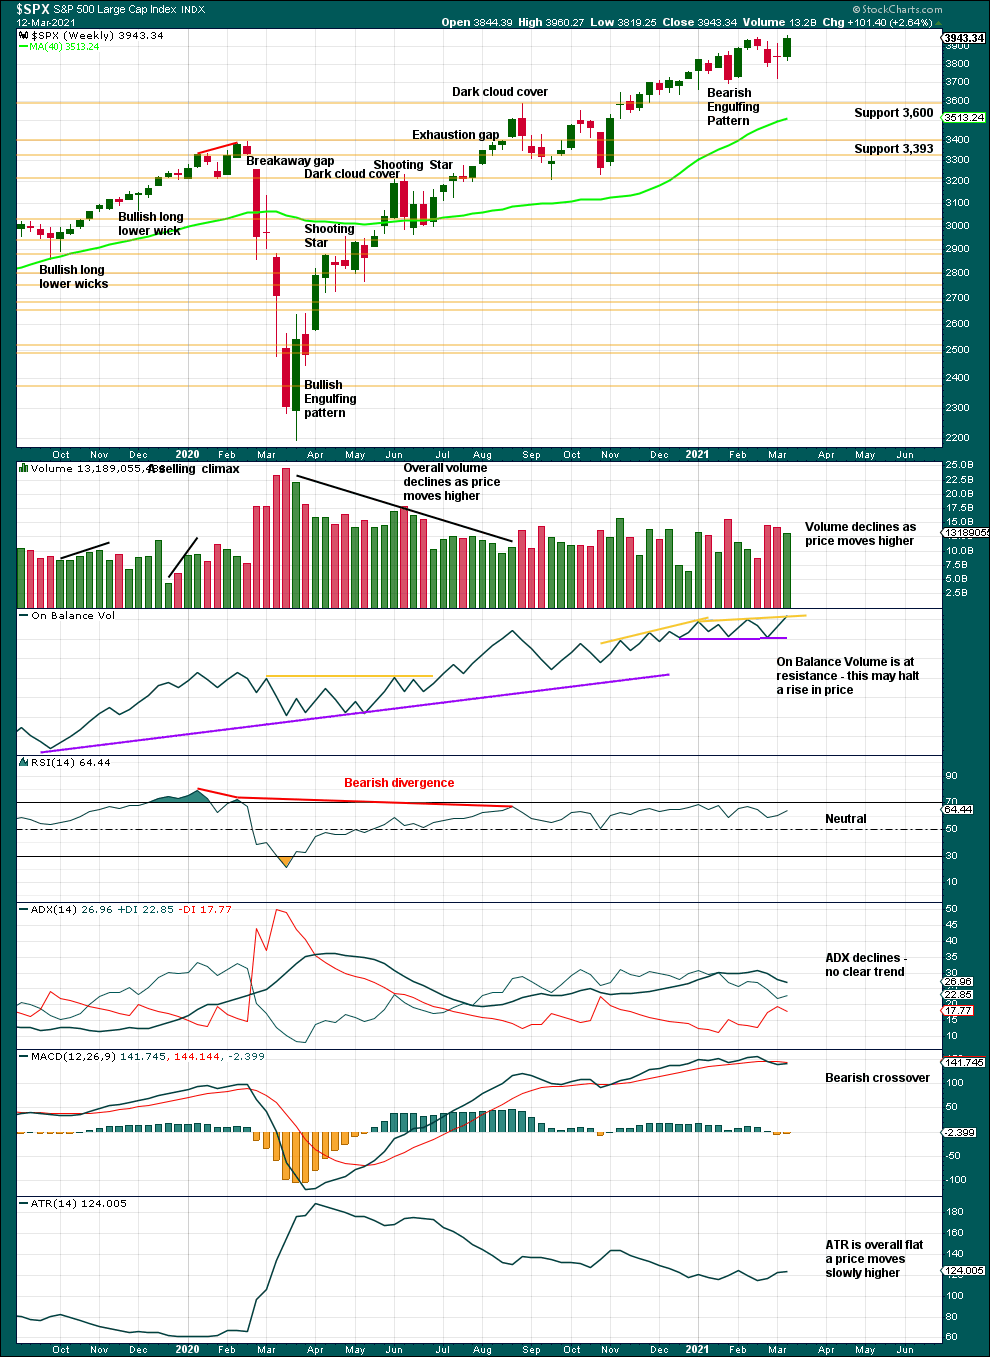
WEEKLY CHART

Click chart to enlarge.
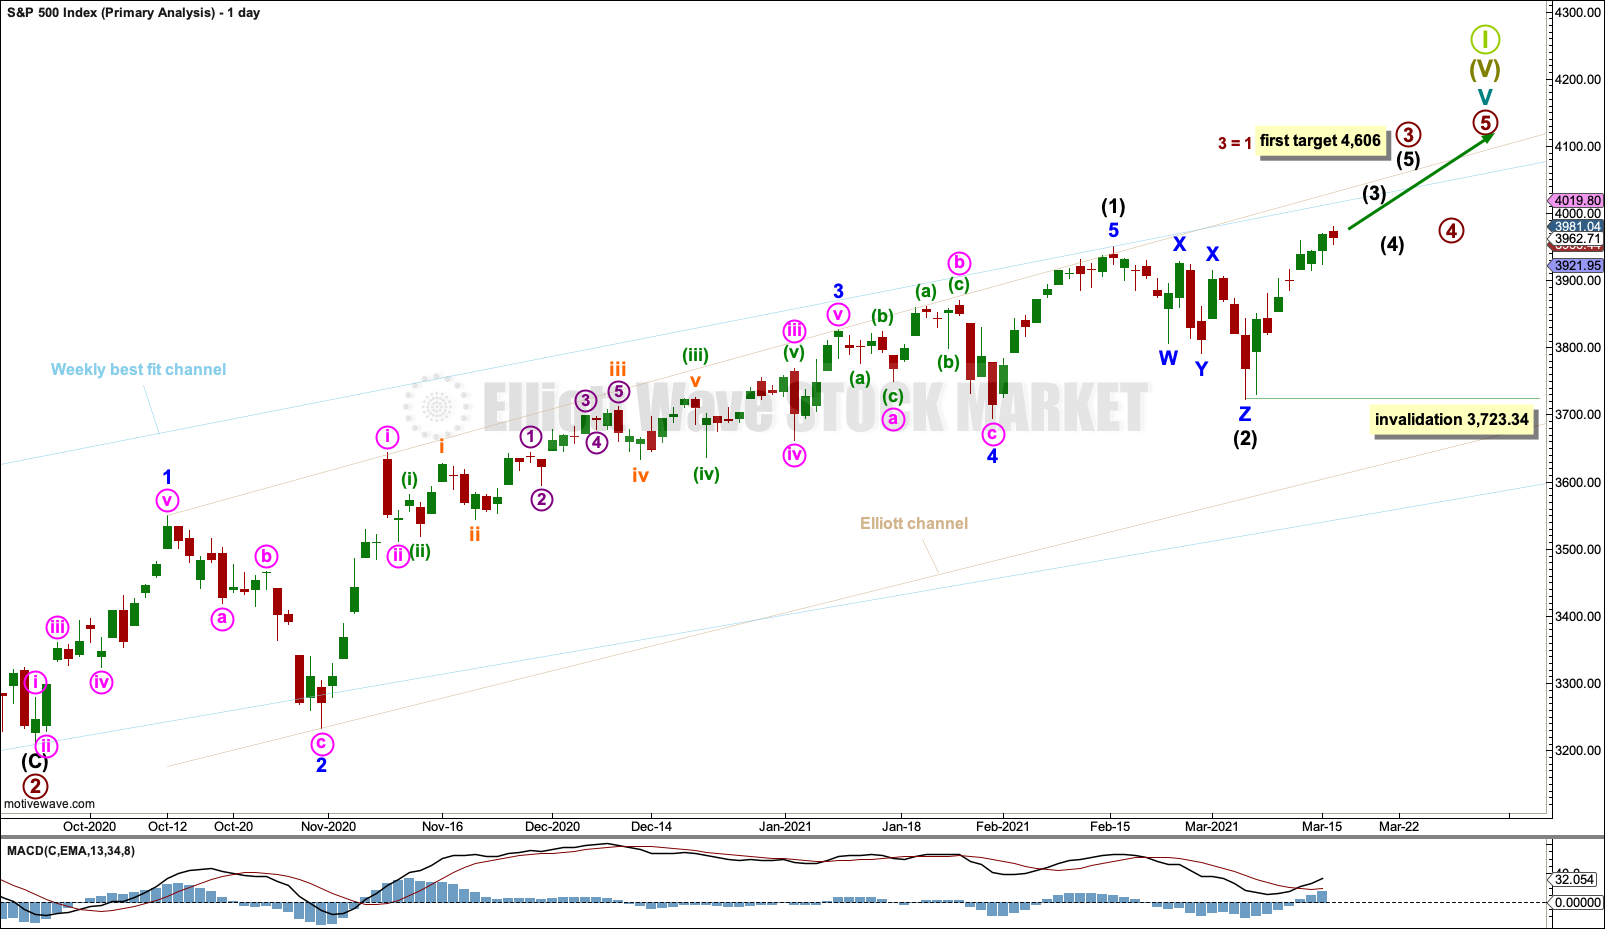
Cycle wave V may last from one to several years. So far it is in its twelfth month.
This wave count may allow time for the AD line to diverge from price as price makes final highs before the end of the bull market. The AD line most commonly diverges a minimum of 4 months prior to the end of a bull market. A longer divergence is positively correlated with a deeper bear market. A shorter divergence is positively correlated with a more shallow bear market. With zero divergence at this stage, if a surprise bear market does develop here, then it would likely be shallow.
Cycle wave V would most likely subdivide as an impulse. But if overlapping develops, then an ending diagonal should be considered. This chart considers the more common impulse.
Primary waves 1 and 2 may be complete.
Primary wave 3 may only subdivide as an impulse.
Primary wave 3 has now moved well above the end of primary wave 1. Primary wave 4 may not move into primary wave 1 price territory below 3,588.11.
There is already a Fibonacci ratio between cycle waves I and III within Super Cycle wave (V). The S&P500 often exhibits a Fibonacci ratio between two of its actionary waves but rarely between all three; it is less likely that cycle wave V would exhibit a Fibonacci ratio. The target for Super Cycle wave (V) to end would best be calculated at primary degree, but that cannot be done until all of primary waves 1, 2, 3 and 4 are complete.
The blue weekly best fit channel is slightly adjusted, so that the lower edge may better show where price may find support. Copy this over to the daily chart.
DAILY CHART
Click chart to enlarge.
The daily chart focusses on the unfolding impulse of primary wave 3.
Intermediate wave (1) within primary wave 3 may have been complete and the last pullback may be intermediate wave (2).
Intermediate wave (2) may have continued lower as a triple zigzag.
Intermediate wave (3) within primary wave 3 may now have begun. An increase in upwards momentum may be expected.
No second wave correction within intermediate wave (3) may move beyond its start below 3,723.34.
HOURLY CHART
Click chart to enlarge.
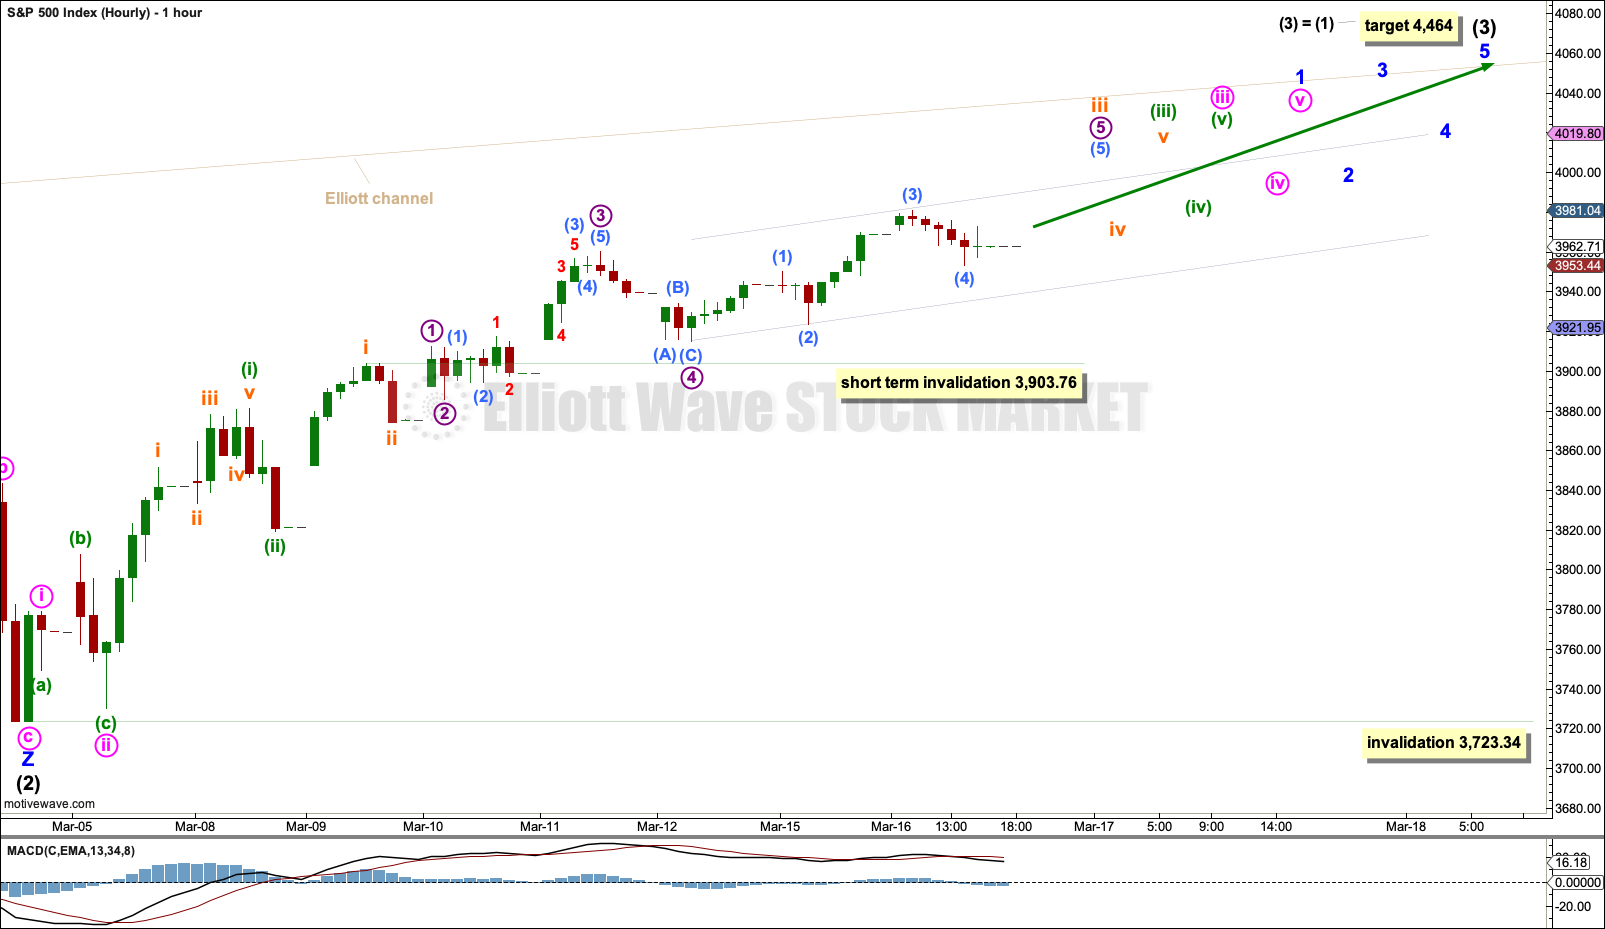
Intermediate wave (3) may only subdivide as an impulse. Minor wave 1 within the impulse may be extending higher.
When minor wave 1 may be complete, then minor wave 2 may not move beyond the start of minor wave 1 below 3,723.34.
Within minor wave 1: Minute waves i and ii may be complete, and minute wave iii may be a long extension (this is typical for the S&P). Subminuette wave iv within minute wave iii may not move into subminuette wave i price territory below 3,903.76. If this short-term invalidation point is breached tomorrow, then minor wave 1 may be complete and minor wave 2 may then be assumed to be underway.
The channel about the last complete portion of minor wave 1 is again adjusted. The S&P often breaches channels to the downside as it completes bullish waves, and it commonly forms rounded tops.
When minor wave 2 arrives, then it may correct as a brief and shallow pullback.
Intermediate wave (3) within primary wave 3 should exhibit an increase in upwards momentum.
ALTERNATE WAVE COUNT
WEEKLY CHART
Click chart to enlarge.
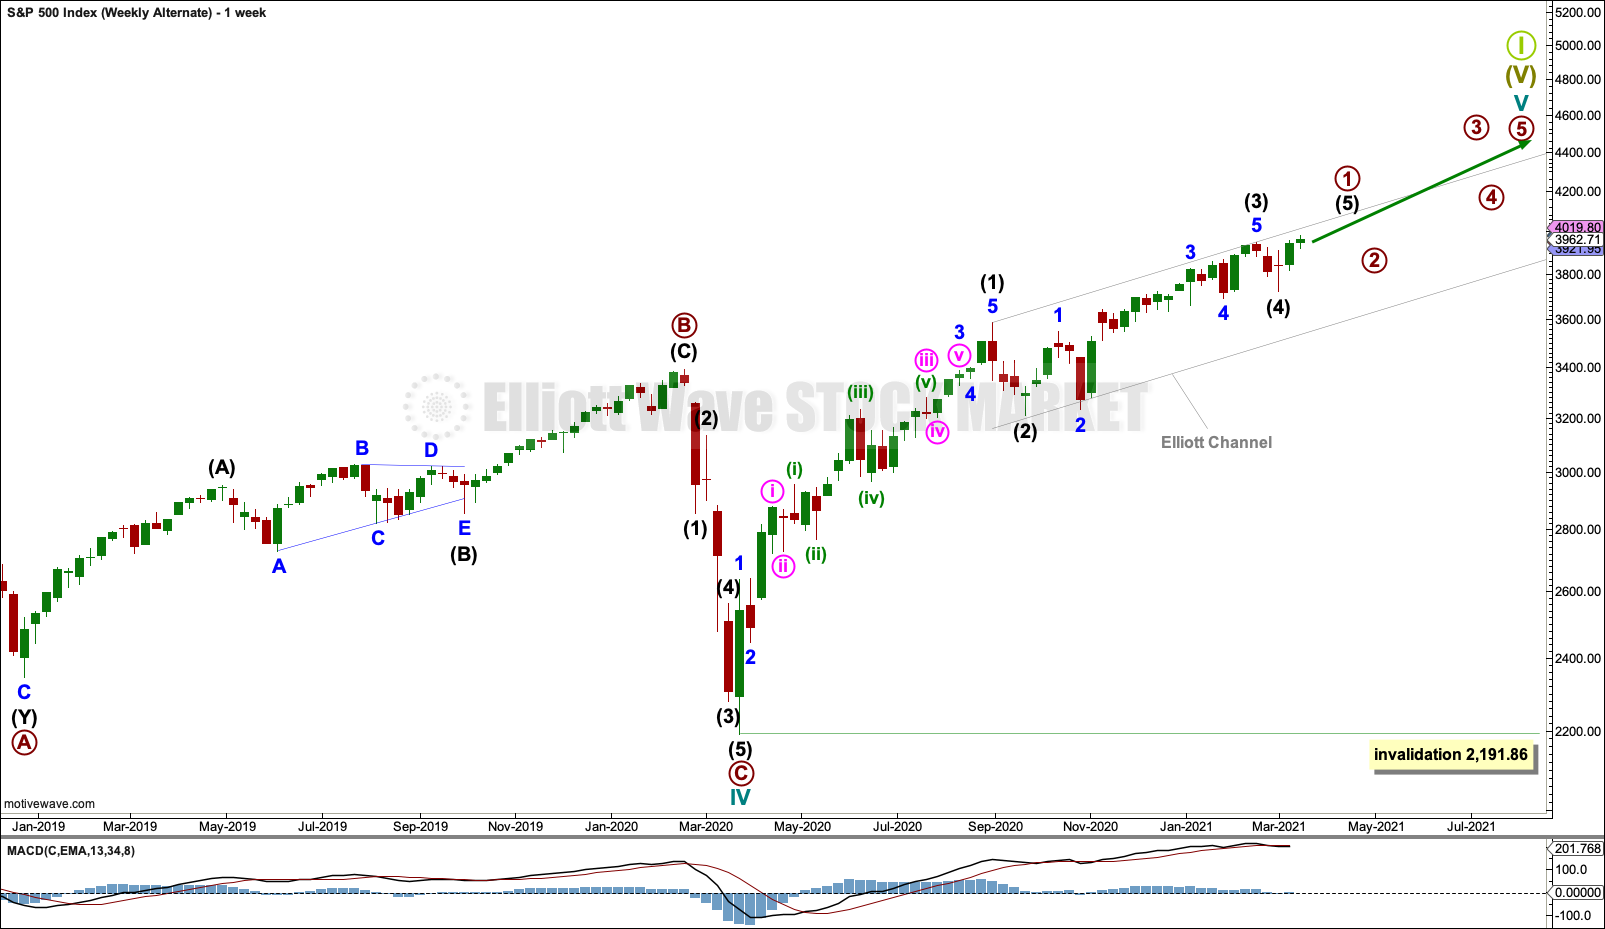
This wave count moves the degree of labelling within cycle wave V down one degree. Primary wave 1 may be incomplete.
This alternate is more bullish than the main weekly chart. It expects that cycle wave V may last many more years than the main weekly chart. This wave count now considers intermediate waves (3) and (4) within primary wave 1 may be complete. Intermediate wave (3) is shorter than intermediate wave (1), which reduces the probability of this alternate wave count.
When primary wave 1 may be complete, then a multi-week pullback for primary wave 2 should begin. Primary wave 2 may not move beyond the start of primary wave 1 below 2,191.86.
DAILY CHART
Click chart to enlarge.
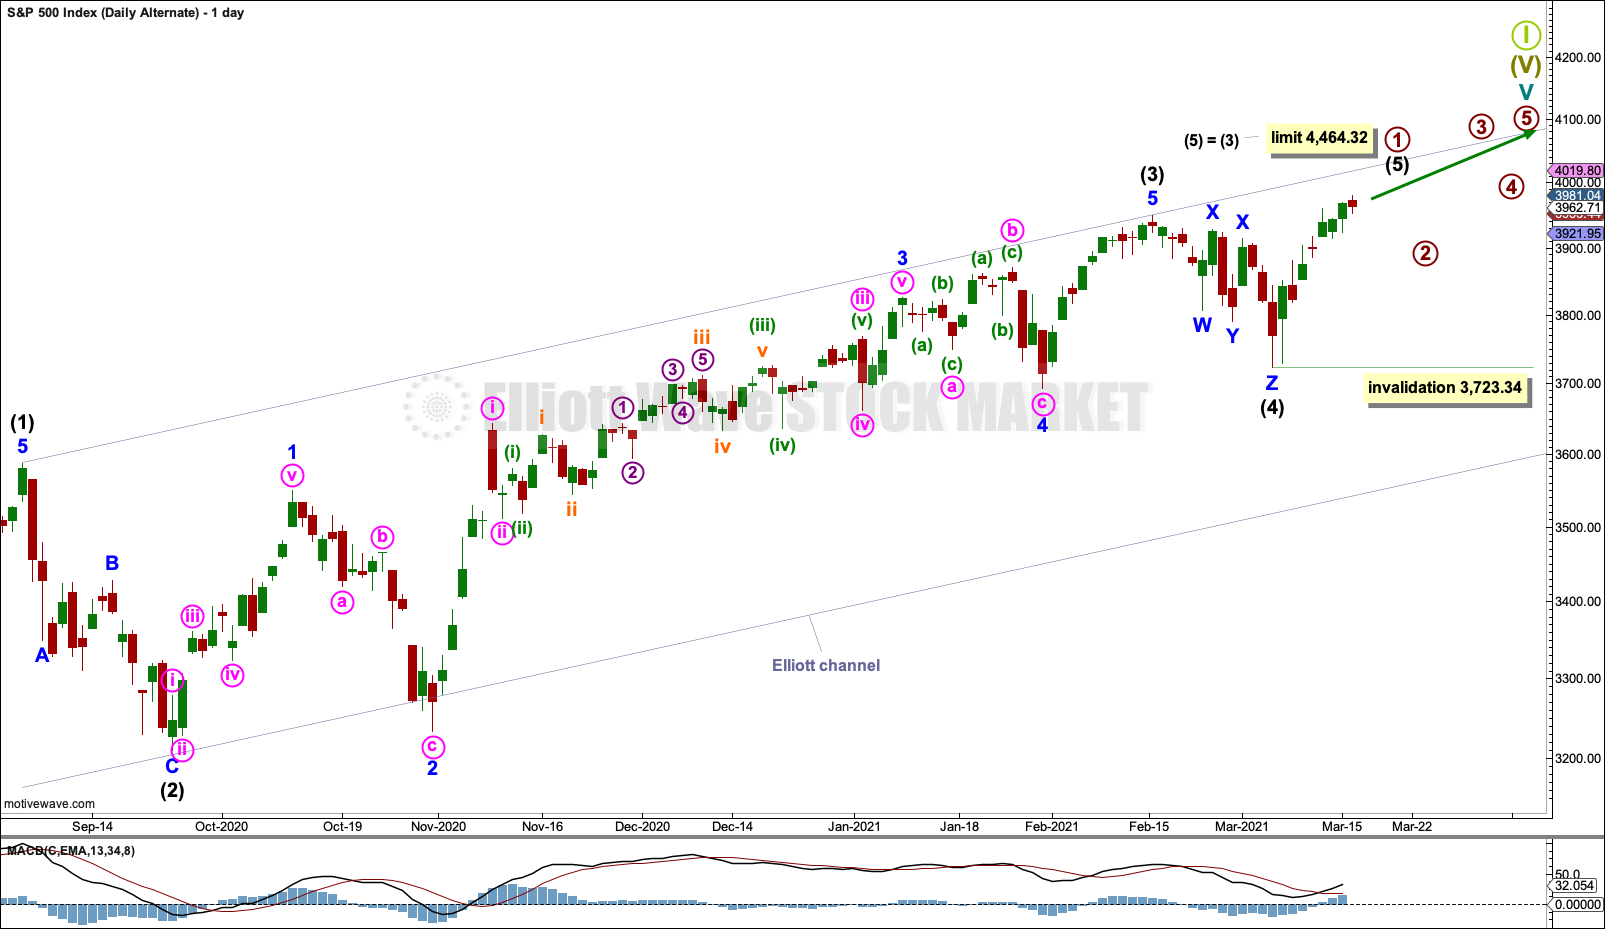
Intermediate waves (1) through to (4) within primary wave 1 may be complete.
No second wave correction within intermediate wave (5) may move beyond its start below 3,723.34.
TECHNICAL ANALYSIS
WEEKLY CHART
Click chart to enlarge. Chart courtesy of StockCharts.com.
The last swing low of the 29th of January remains intact. A series of higher highs and higher lows remains intact. A new all time high last week with a strong green candlestick reinforces the view that the last pullback is likely over.
DAILY CHART
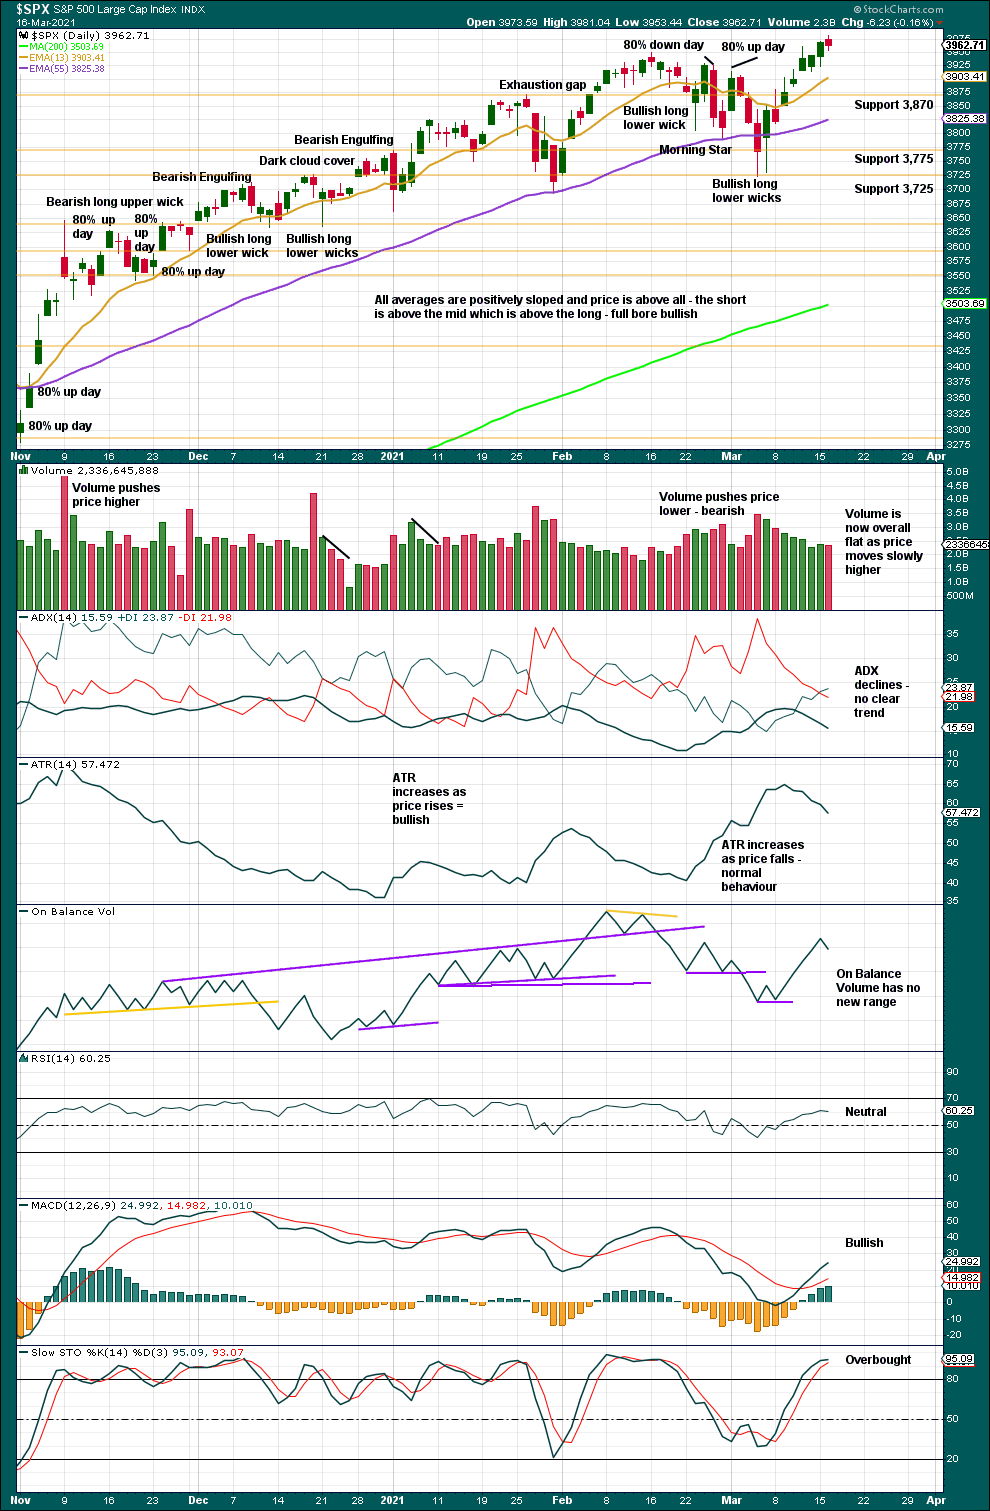
Click chart to enlarge. Chart courtesy of StockCharts.com.
The series of higher highs and higher lows from the low of the 30th of October continues.
Regular pullbacks have caused ADX to fluctuate. The last pullback was indicated by ADX as a downwards trend. The +DX line has crossed above the -DX line, indicating a possible change back to upwards. The series of higher highs and higher lows continues, the basic definition of an upwards trend, despite ADX not indicating it is so.
RSI and ADX are not extreme. There is plenty of room for this upwards trend to continue.
Stochastics is overbought, but this oscillator may remain overbought for long periods of time when this market, with its strong bullish bias, is in an upwards trend.
BREADTH – AD LINE
WEEKLY CHART
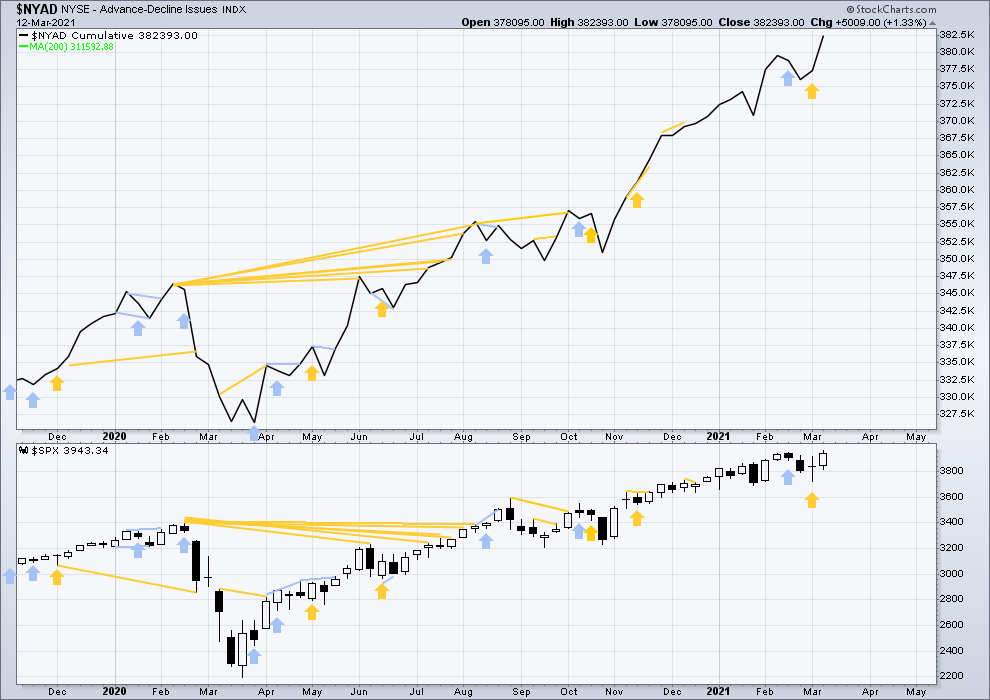
Click chart to enlarge. Chart courtesy of StockCharts.com. So that colour blind members are included, bearish signals will be noted with blue and bullish signals with yellow.
Breadth should be read as a leading indicator.
Lowry’s Operating Companies Only AD line has made a new all time high on the 11th of March. This is a strong bullish signal and supports the main Elliott wave count.
Large caps all time high: 3,981.04 on March 16, 2021.
Mid caps all time high: 2,682.94 on March 15, 2021.
Small caps all time high: 1,399.31 on March 12, 2021.
Last week both price and the AD line have moved higher. Upwards movement has support from rising market breadth. This is bullish.
DAILY CHART

Click chart to enlarge. Chart courtesy of StockCharts.com. So that colour blind members are included, bearish signals will be noted with blue and bullish signals with yellow.
Today the AD line has moved lower while price has moved higher (although the session closed red). This divergence is bearish for the very short term.
VOLATILITY – INVERTED VIX CHART
WEEKLY CHART

Click chart to enlarge. Chart courtesy of StockCharts.com. So that colour blind members are included, bearish signals will be noted with blue and bullish signals with yellow.
Inverted VIX remains well below all time highs. The all time high for inverted VIX was in the week beginning October 30, 2017. There is over 3 years of bearish divergence between price and inverted VIX. There is all of long, mid and short-term bearish divergence. This bearish divergence may develop further before the bull market ends. It may be a very early indicator of an upcoming bear market, but it is not proving to be useful in timing.
Last week price has made new highs, but inverted VIX has not. There is again all of short, mid and long-term bearish divergence.
Comparing VIX and VVIX at the weekly chart level:
Again, last week both VIX and VVIX have moved lower. There is no new short-term divergence.
DAILY CHART

Click chart to enlarge. Chart courtesy of StockCharts.com. So that colour blind members are included, bearish signals will be noted with blue and bullish signals with yellow.
Both price and inverted VIX have moved higher today. There is no longer short-term divergence. Long-term divergence is now only visible on the weekly chart.
Comparing VIX and VVIX at the daily chart level:
Today VIX has slightly declined, but VVIX has increased. With volatility of VIX increasing, this is bearish for price for the short term.
DOW THEORY
Dow Theory confirms a new bull market with new highs made on a closing basis:
DJIA: 29,568.57 – closed above on 16th November 2020.
DJT: 11,623.58 – closed above on 7th October 2020.
Adding in the S&P and Nasdaq for an extended Dow Theory, confirmation of a bull market would require new highs made on a closing basis:
S&P500: 3,393.52 – closed above on 21st August 2020.
Nasdaq: 9,838.37 – closed above on June 8, 2020.
The following major swing lows would need to be seen on a closing basis for Dow Theory to confirm a change from bull to a bear market:
DJIA: 18,213.65
DJT: 6,481.20
Adding in the S&P and Nasdaq for an extended Dow Theory, confirmation of a new bear market would require new lows on a closing basis:
S&P500: 2,191.86
Nasdaq: 6,631.42
Published @ 06:16 p.m. ET.
—
Careful risk management protects your trading account(s).
Follow my two Golden Rules:
1. Always trade with stops.
2. Risk only 1-5% of equity on any one trade.
—
New updates to this analysis are in bold.