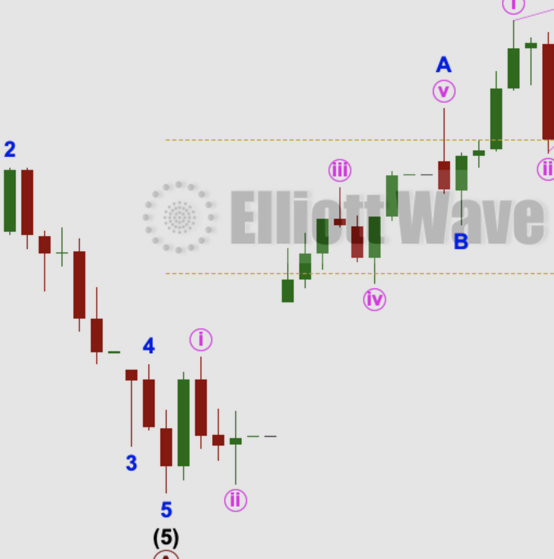
by Lara | Aug 11, 2021 | S&P 500, S&P 500 + DJIA
S&P 500: Elliott Wave and Technical Analysis | Charts – August 11, 2021 A little more upwards movement fits the first alternate Elliott wave count best, but classic technical analysis, particularly weakness in breadth as measured by the AD line, suggests the main...
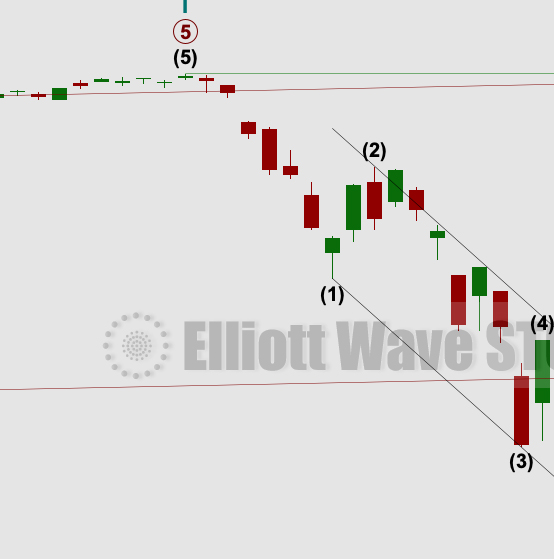
by Lara | Jun 23, 2021 | S&P 500, S&P 500 + DJIA
S&P 500: Elliott Wave and Technical Analysis | Charts – June 23, 2021 Upwards movement has continued a little further, falling just short of a new all time high today. This leaves all three short-term Elliott wave counts valid. Summary: The primary trend remains...

by Lara | May 7, 2021 | S&P 500, S&P 500 + DJIA
S&P 500: Elliott Wave and Technical Analysis | Charts – May 7, 2021 Upwards movement again unfolds as expected. Targets remain the same. Two Elliott wave counts remain bullish. Summary: The main and alternate Elliott wave counts may have about an even...
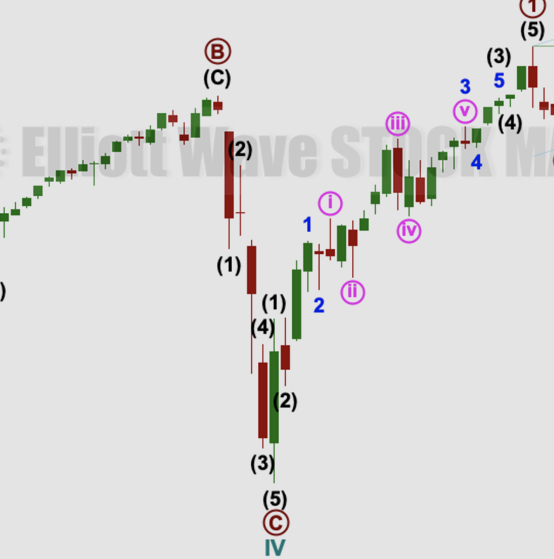
by Lara | Apr 12, 2021 | S&P 500, S&P 500 + DJIA
S&P 500: Elliott Wave and Technical Analysis | Charts – April 12, 2021 Another upwards session continues to move price towards Elliott wave targets. Two Elliott wave counts are provided at the weekly chart level. One is more bullish than the other. Summary: The...
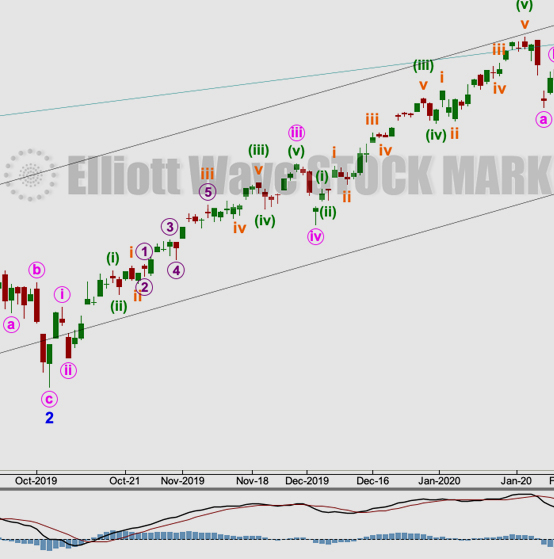
by Lara | Mar 3, 2021 | S&P 500, S&P 500 + DJIA
S&P 500: Elliott Wave and Technical Analysis | Charts – March 3, 2021 A downwards day closes with price still above the short-term invalidation point on the main hourly chart. All three short-term hourly charts remain valid. Technical analysis supports the main...

by Lara | Feb 8, 2021 | S&P 500, S&P 500 + DJIA
S&P 500: Elliott Wave and Technical Analysis | Charts – February 8, 2021 Upwards movement continues exactly as expected towards the next target zone, which is calculated at two Elliott wave degrees. Summary: Both main and alternate wave counts expect the low of...
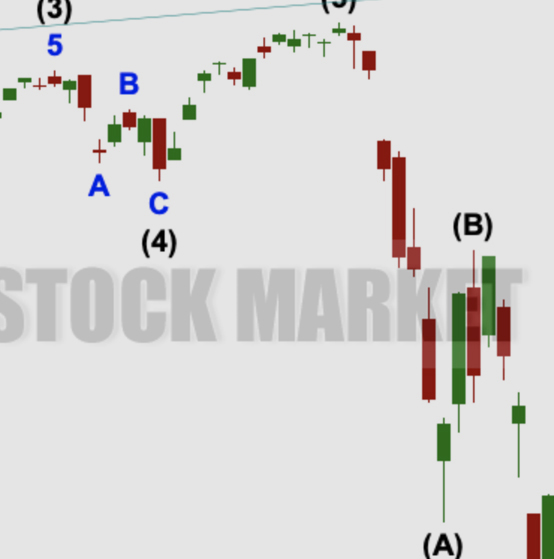
by Lara | Jan 13, 2021 | S&P 500, S&P 500 + DJIA
S&P 500: Elliott Wave and Technical Analysis | Charts – January 13, 2021 Another small range day continues a small range consolidation, which remains above support. Summary: The wave count expects the low of the 30th of October to not be breached for many months...

by Lara | Dec 17, 2020 | S&P 500, S&P 500 + DJIA
S&P 500: Elliott Wave and Technical Analysis | Charts – December 17, 2020 An upwards march continues towards targets on the Elliott wave count, which are calculated using Fibonacci ratios. Summary: The wave count expects the low of the 30th of October to not be...

by Lara | Nov 24, 2020 | S&P 500, S&P 500 + DJIA
S&P 500: Elliott Wave and Technical Analysis | Charts – November 24, 2020 Upwards movement has unfolded this session exactly as the main Elliott wave count expected. This Elliott wave analysis has strong support from breadth and volume data today. Summary: The...


