
S&P 500: Elliott Wave and Technical Analysis | Charts – March 3, 2021
A downwards day closes with price still above the short-term invalidation point on the main hourly chart.
All three short-term hourly charts remain valid. Technical analysis supports the main hourly chart.
Summary: The pullback may be over at last week’s low, or it may continue sideways as a triangle or lower as a triple zigzag for a few more sessions.
Both main and alternate wave counts expect the low of the 30th of October to not be breached for many months.
The next target for the upwards trend is at 4,606. About this target another multi-week pullback or consolidation may develop.
An alternate wave count at the weekly chart level has a slightly lower probability with the main weekly chart.
The biggest picture, Grand Super Cycle analysis, is here.
Monthly charts are last updated here with video here.
MAIN WAVE COUNT
WEEKLY CHART
Click chart to enlarge.
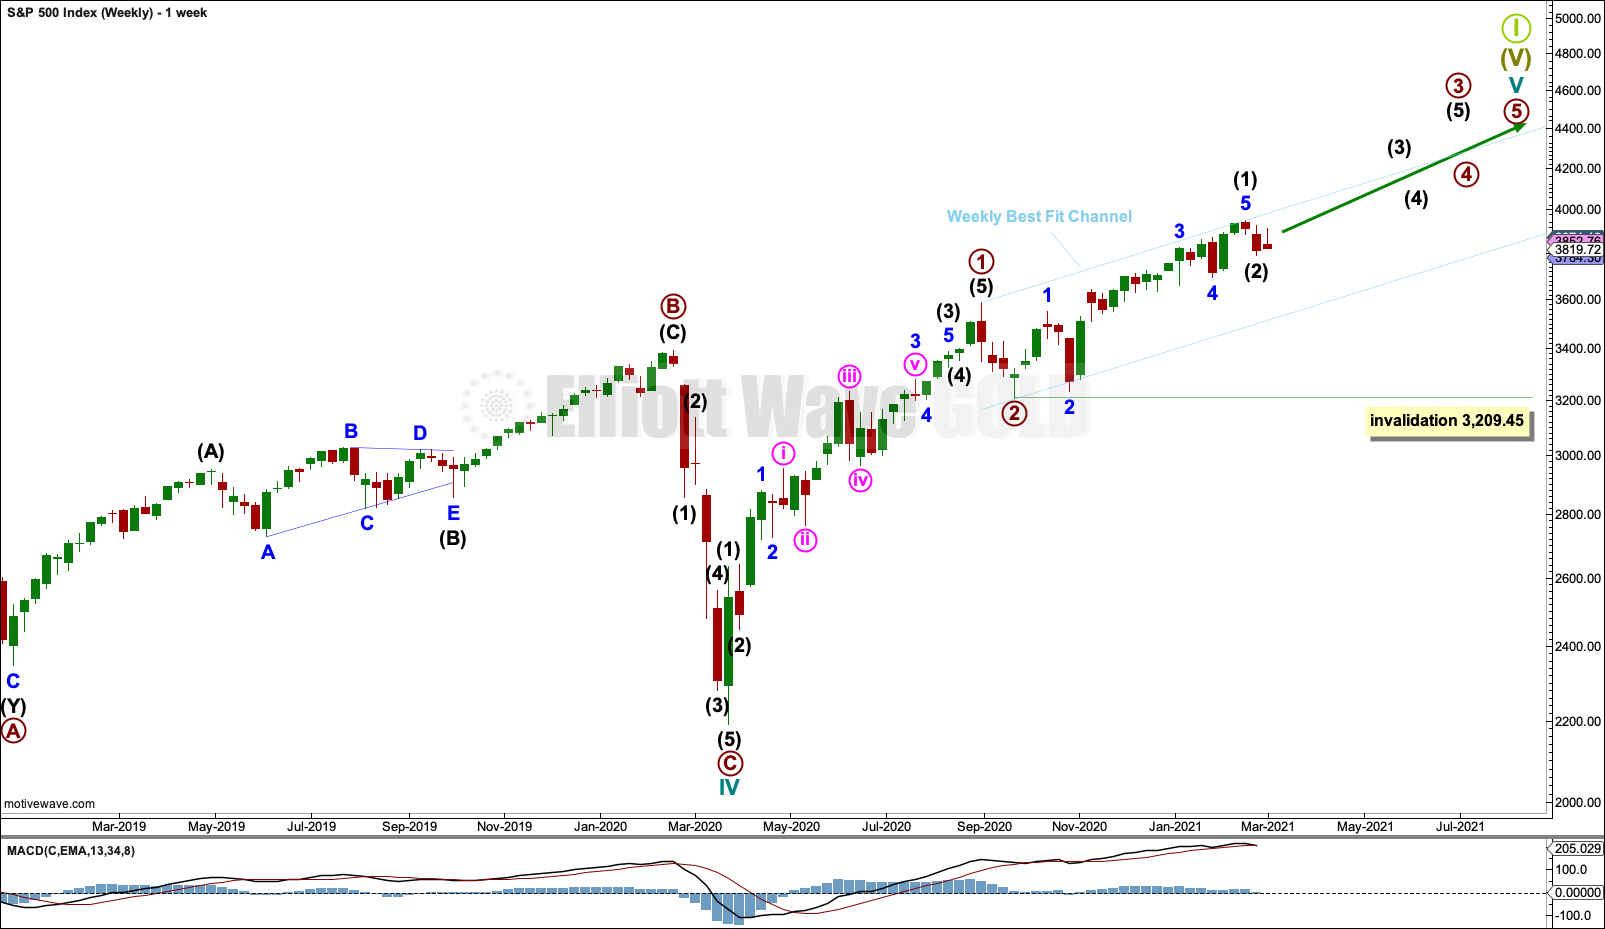
Cycle wave V may last from one to several years. So far it is in its eleventh month.
This wave count may allow time for the AD line to diverge from price as price makes final highs before the end of the bull market. The AD line most commonly diverges a minimum of 4 months prior to the end of a bull market. A longer divergence is positively correlated with a deeper bear market. A shorter divergence is positively correlated with a more shallow bear market. With zero divergence at this stage, if a surprise bear market does develop here, then it would likely be shallow.
Cycle wave V would most likely subdivide as an impulse. But if overlapping develops, then an ending diagonal should be considered. This chart considers the more common impulse.
Primary waves 1 and 2 may be complete.
Primary wave 3 may only subdivide as an impulse.
Primary wave 3 has now moved well above the end of primary wave 1. Primary wave 4 may not move into primary wave 1 price territory below 3,588.11.
There is already a Fibonacci ratio between cycle waves I and III within Super Cycle wave (V). The S&P500 often exhibits a Fibonacci ratio between two of its actionary waves but rarely between all three; it is less likely that cycle wave V would exhibit a Fibonacci ratio. The target for Super Cycle wave (V) to end would best be calculated at primary degree, but that cannot be done until all of primary waves 1, 2, 3 and 4 are complete.
The blue weekly best fit channel is slightly adjusted, so that the lower edge may better show where price may find support. Copy this over to the daily chart.
DAILY CHART
Click chart to enlarge.
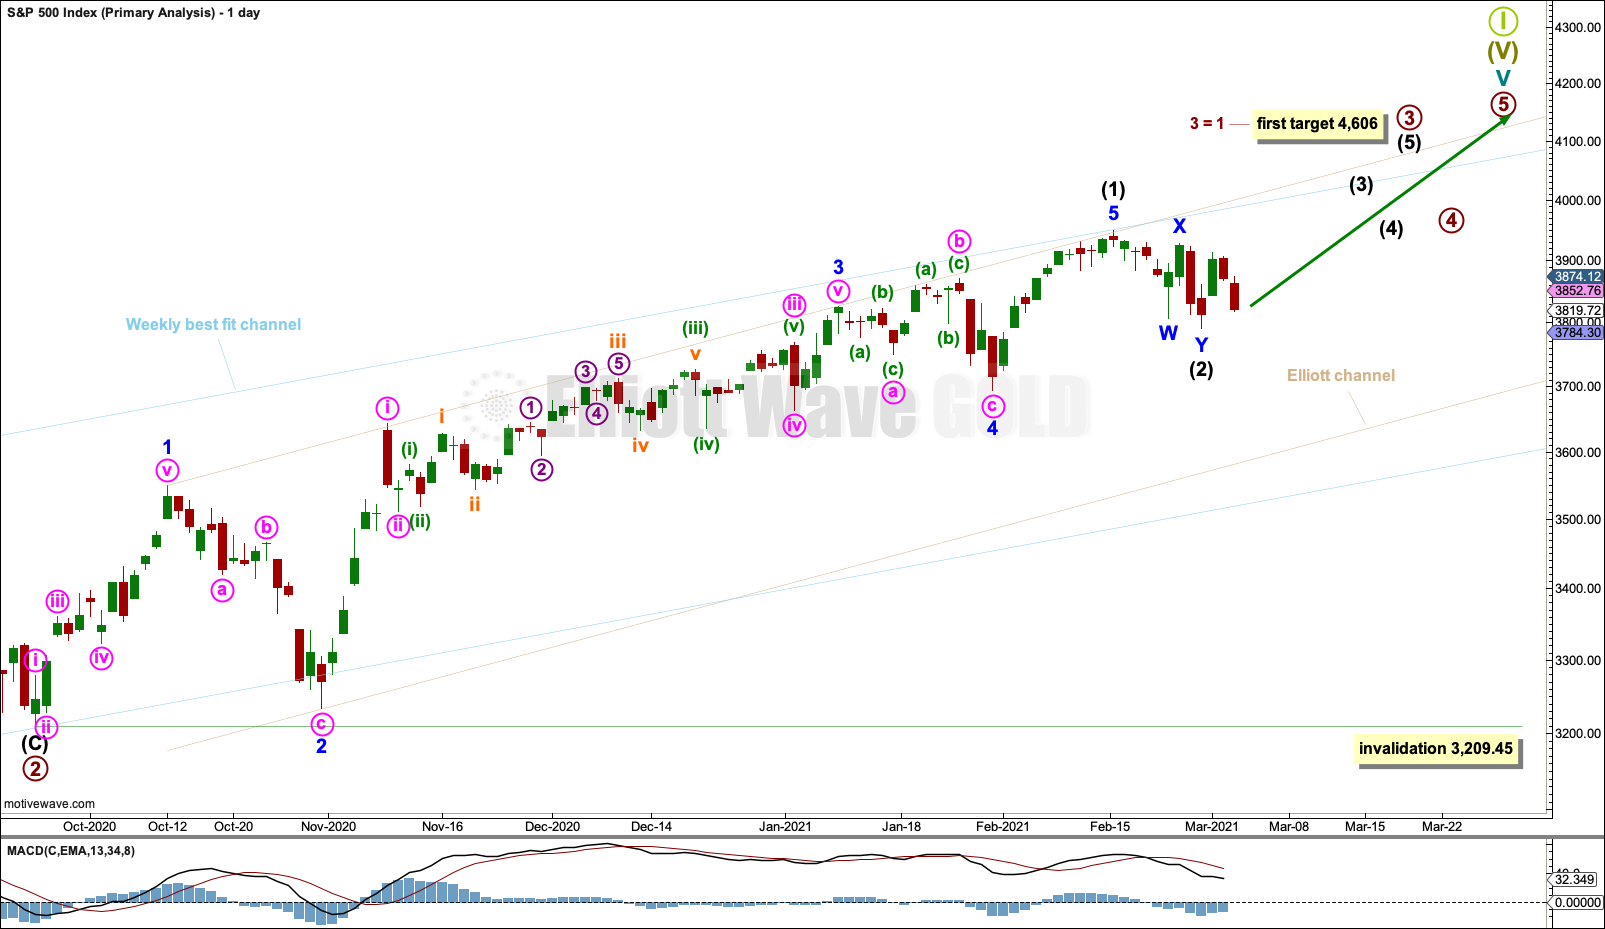
The daily chart focusses on the unfolding impulse of primary wave 3.
Intermediate wave (1) within primary wave 3 may have been complete at the last all time high and the last small pullback may be intermediate wave (2).
Intermediate wave (2) may be complete as a double zigzag as labelled, or the degree of labelling within it may be moved down one degree to continue sideways as a flat.
Intermediate wave (2) may not subdivide with a triangle as its sole corrective structure; triangles do not occur in second wave positions (unless they are one part of a combination). If the structure of this pullback is correctly analysed as a double zigzag at lower time frames, then intermediate wave (2) may not continue further as a double combination; combinations may only subdivide with simple corrective structures within W, Y and Z.
Intermediate wave (2) may continue lower as a triple zigzag. While triple zigzags are reasonably rare, they are not the rarest Elliott wave structure and may occur in a second wave position.
Intermediate wave (2) may not move beyond the start of intermediate wave (1) below 3,209.45.
HOURLY CHART
Click chart to enlarge.
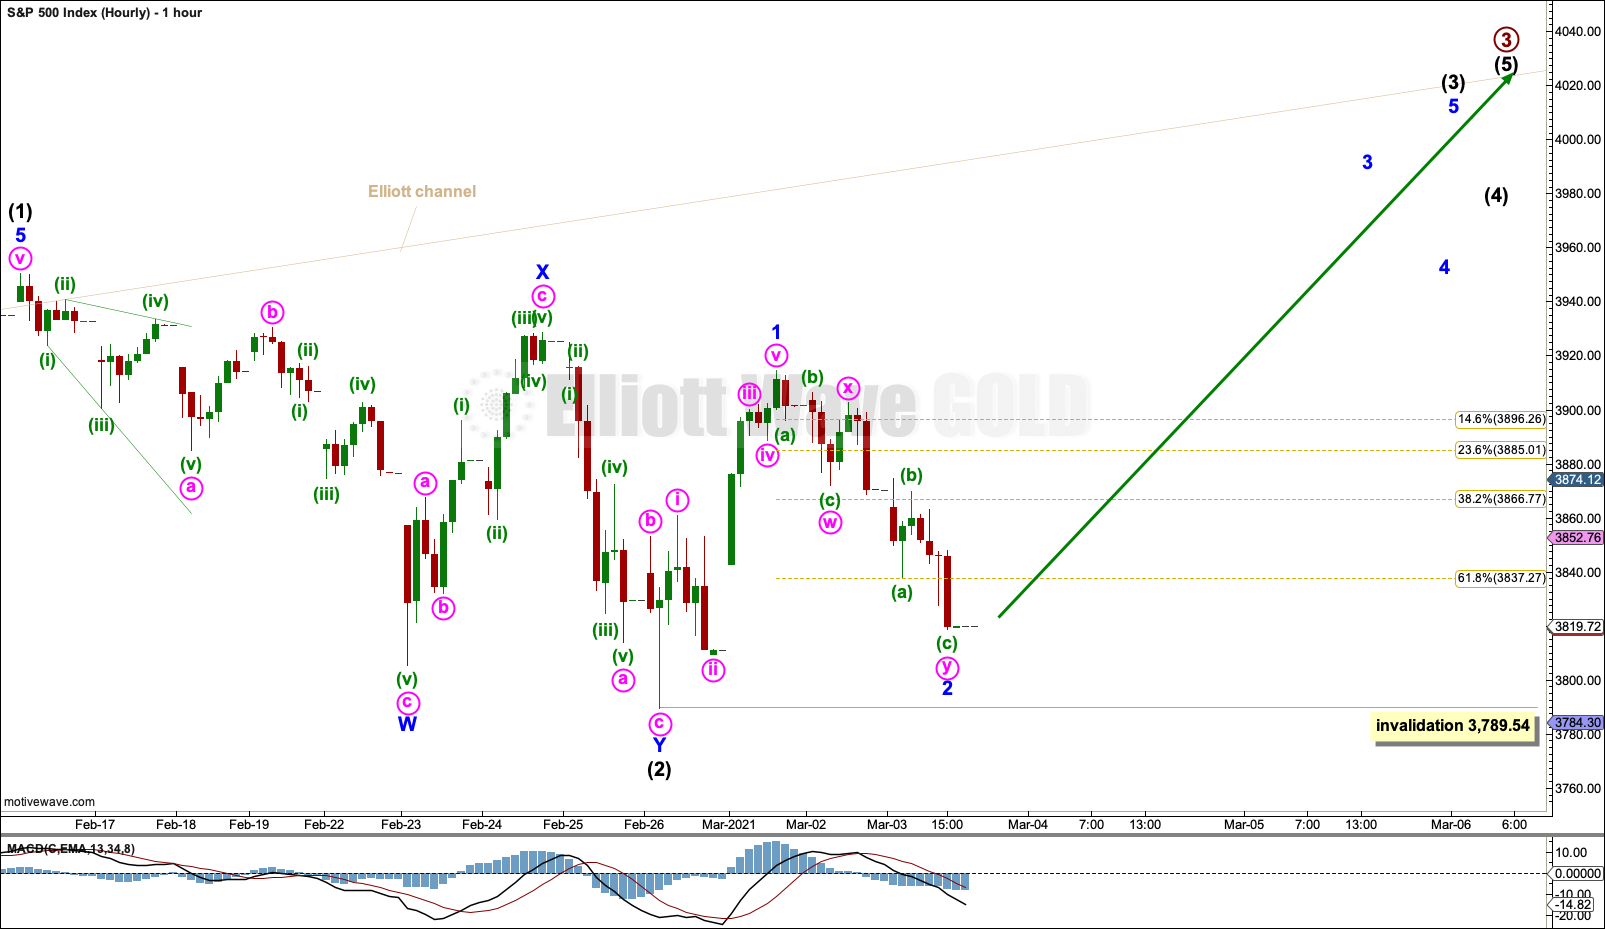
Intermediate wave (2) may have completed as a double zigzag. Minor wave Y is 5.73 points short of equality in length with minor wave W.
Intermediate wave (3) may only subdivide as an impulse. Minor wave 1 within the impulse may be complete. Minor wave 2 may not move beyond the start of minor wave 1 below 3,789.54.
Minor wave 2 may be a complete double zigzag as labelled. The second zigzag may continue lower.
With an 80% down day on 25th of February followed two sessions later by an 80% up day on the 1st of March, and a bullish reversal pattern in a Morning Star, a little confidence in this main hourly wave count may be had.
FIRST ALTERNATE HOURLY CHART
Click chart to enlarge.
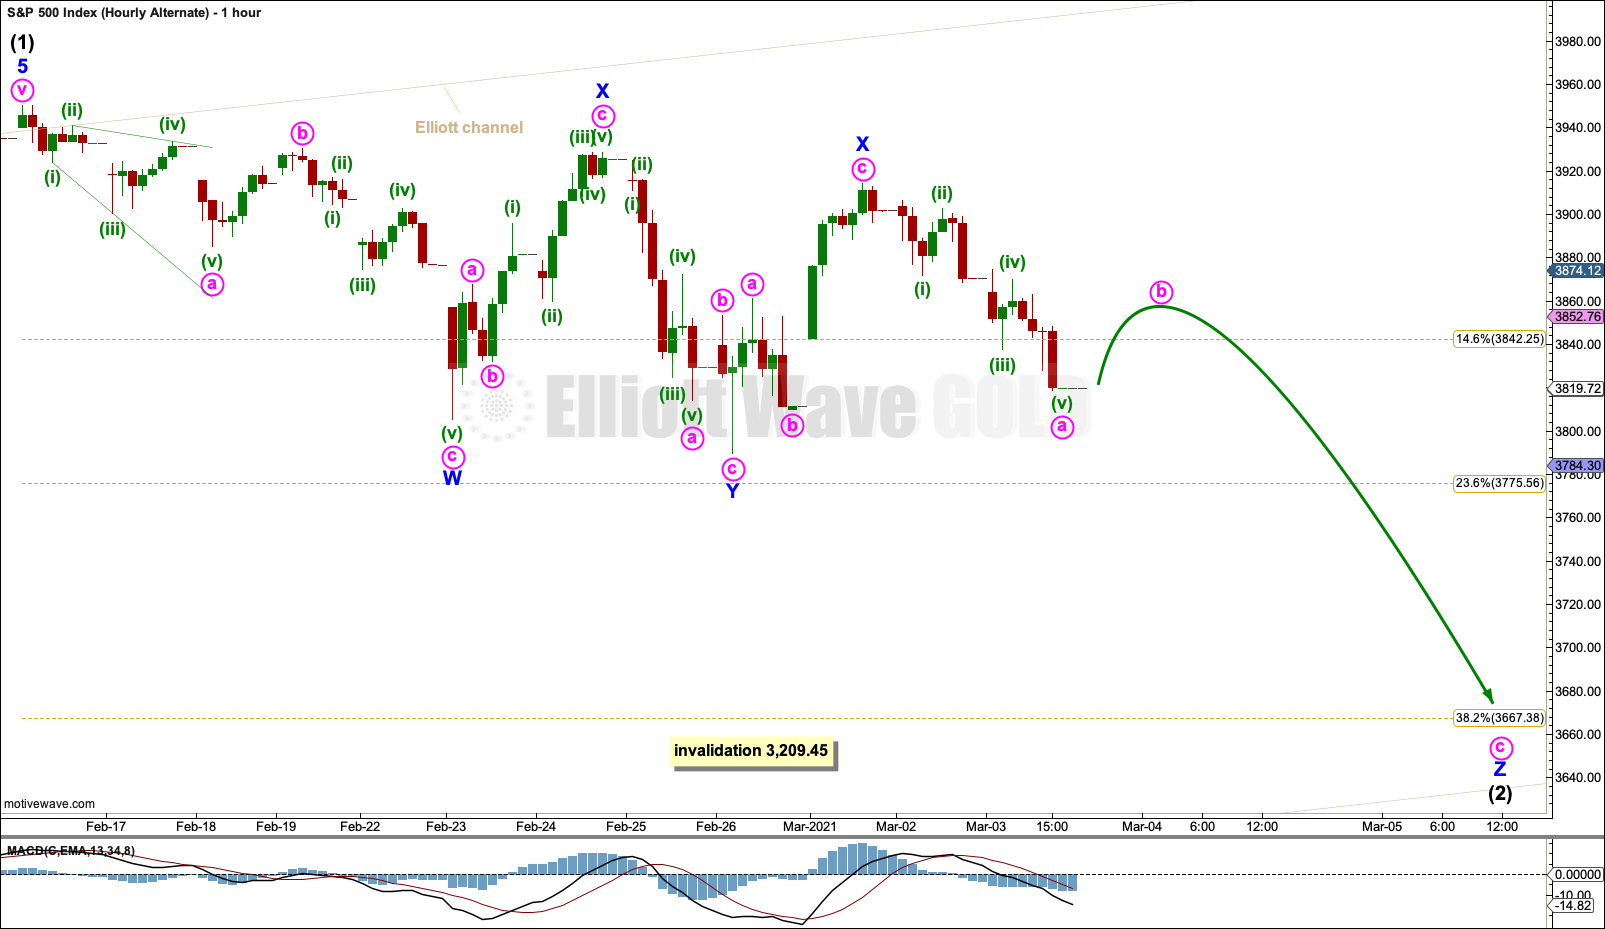
If intermediate wave (2) continues lower as a triple zigzag, then next areas for support may be the 0.382 Fibonacci ratio at 3,667.38 and below that the 0.618 Fibonacci ratio at 3,492.50.
Intermediate wave (2) may not move beyond the start of intermediate wave (1) below 3,209.45.
The rarity of a triple zigzag reduces the probability of this wave count to an alternate.
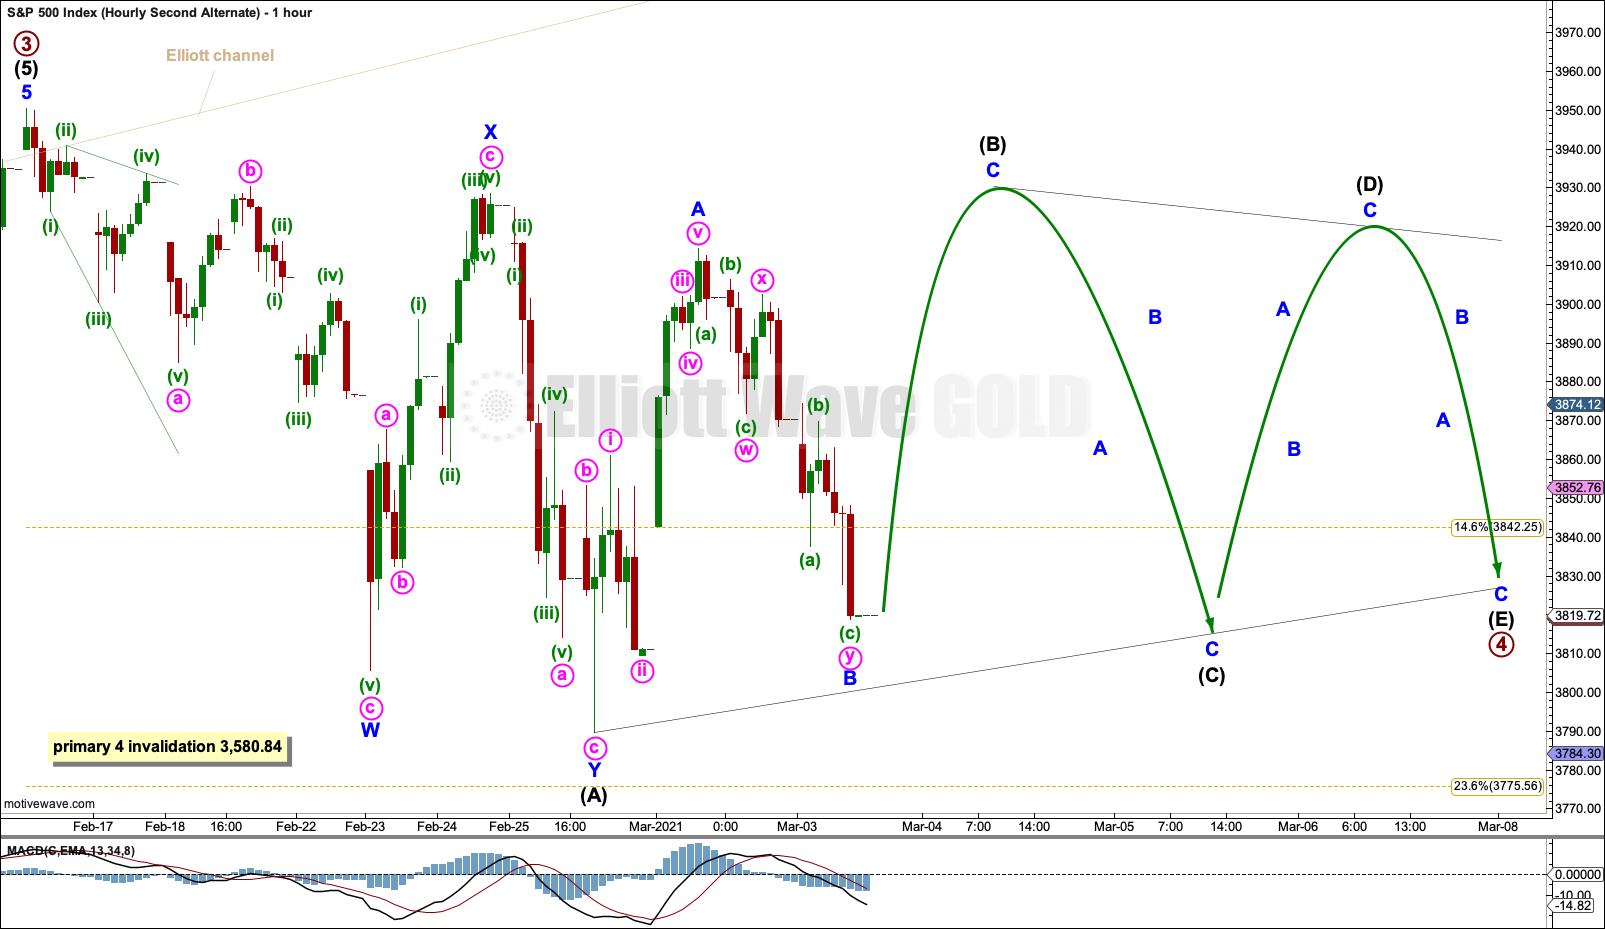
SECOND ALTERNATE HOURLY CHART
Click chart to enlarge.
If the degree of labelling within the entirety of primary wave 3 is moved up one degree, then it is possible that primary wave 3 may be over. However, this wave count sees primary wave 3 shorter than primary wave 1 by 655.27 points. This does not violate any Elliott wave rules, but it is not common for the S&P to exhibit third waves that are shorter than their counterpart first waves; normally, this market exhibits extended third waves.
The probability of this alternate wave count remains low.
Downwards movement from the last high will not fit as a diagonal or a complete impulse; there is too much overlapping for an impulse. Downwards movement will fit as a double zigzag, which may be intermediate wave (A) within primary wave 4.
When A waves subdivide as threes, then a flat or triangle is indicated.
If primary wave 4 unfolds as a triangle as labelled, then the most common type would be a contracting triangle. Intermediate wave (B) within a contracting triangle may move beyond the start of intermediate wave (A) as in a running triangle. Intermediate wave (C) may then not move beyond the end of intermediate wave (A) at 3,789.54. Intermediate wave (D) may not move beyond the end of intermediate wave (B), and intermediate wave (E) may not move beyond the end of intermediate wave (C).
If primary wave 4 unfolds as a flat, then within it intermediate wave (B) must retrace a minimum 90% of intermediate wave (A) at 3,934.41. The common range for intermediate wave (B) within a flat is from 1 to 1.38 the length of intermediate wave (A), from 3,950.43 to 4,011.57.
Primary wave 4 may not move into primary wave 1 price territory below 3,580.84.
ALTERNATE WAVE COUNT
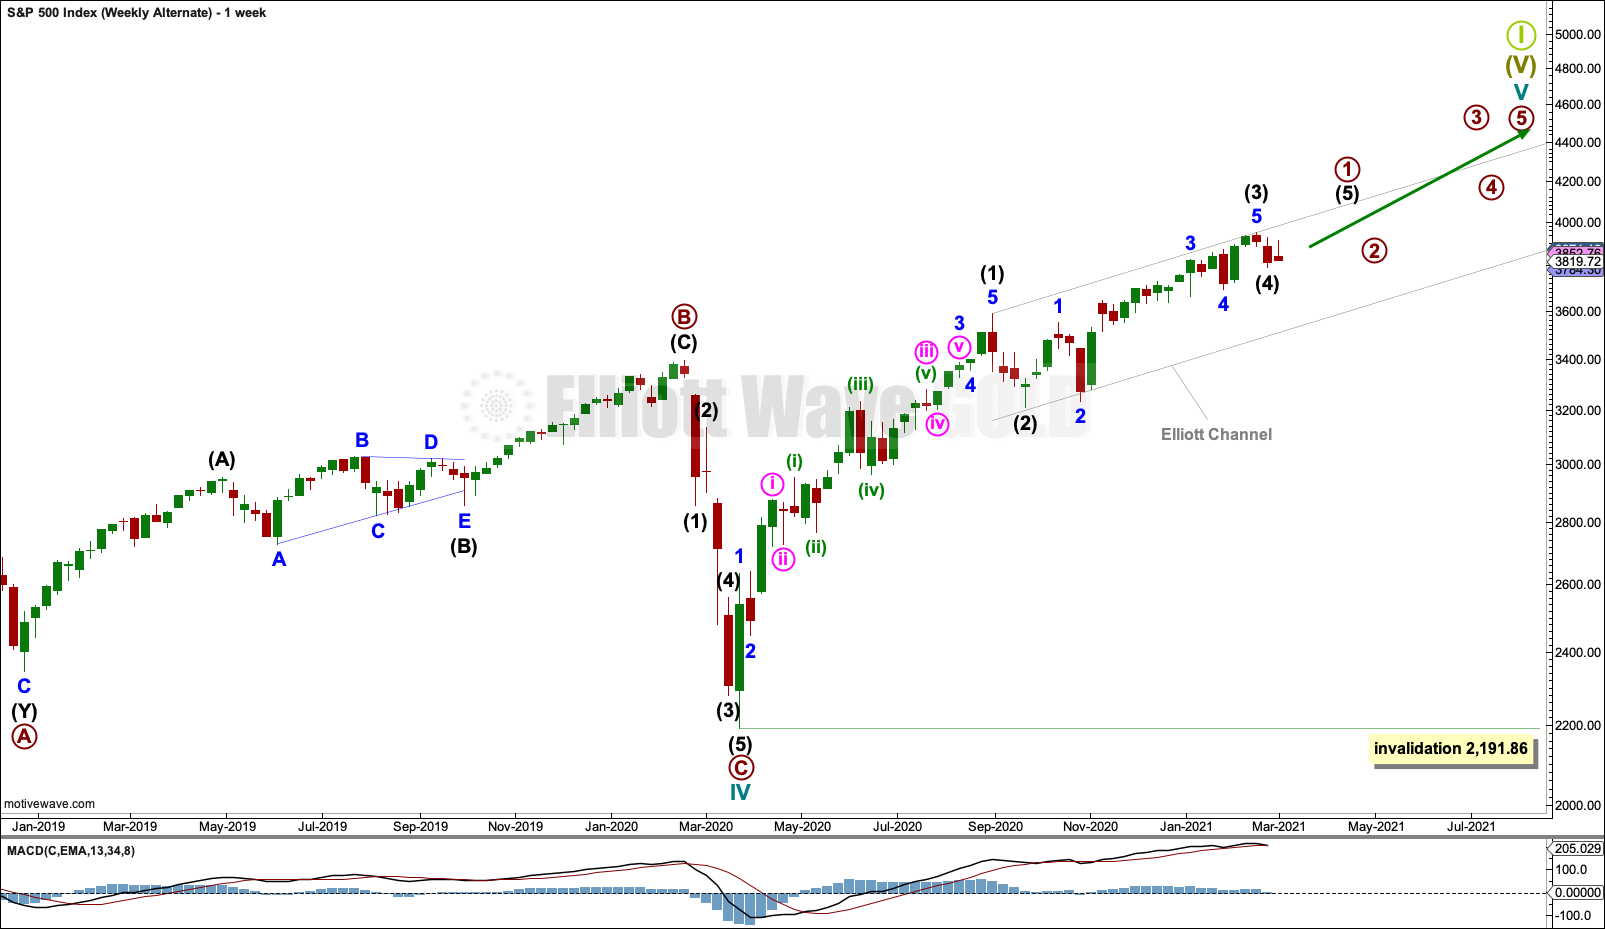
WEEKLY CHART
Click chart to enlarge.
This wave count moves the degree of labelling within cycle wave V down one degree. Primary wave 1 may be incomplete.
This alternate is more bullish than the main weekly chart. It expects that cycle wave V may last many more years than the main weekly chart. This wave count now considers intermediate waves (3) and (4) within primary wave 1 may be complete. Intermediate wave (3) is shorter than intermediate wave (1), which reduces the probability of this alternate wave count.
When primary wave 1 may be complete, then a multi-week pullback for primary wave 2 should begin. Primary wave 2 may not move beyond the start of primary wave 1 below 2,191.86.
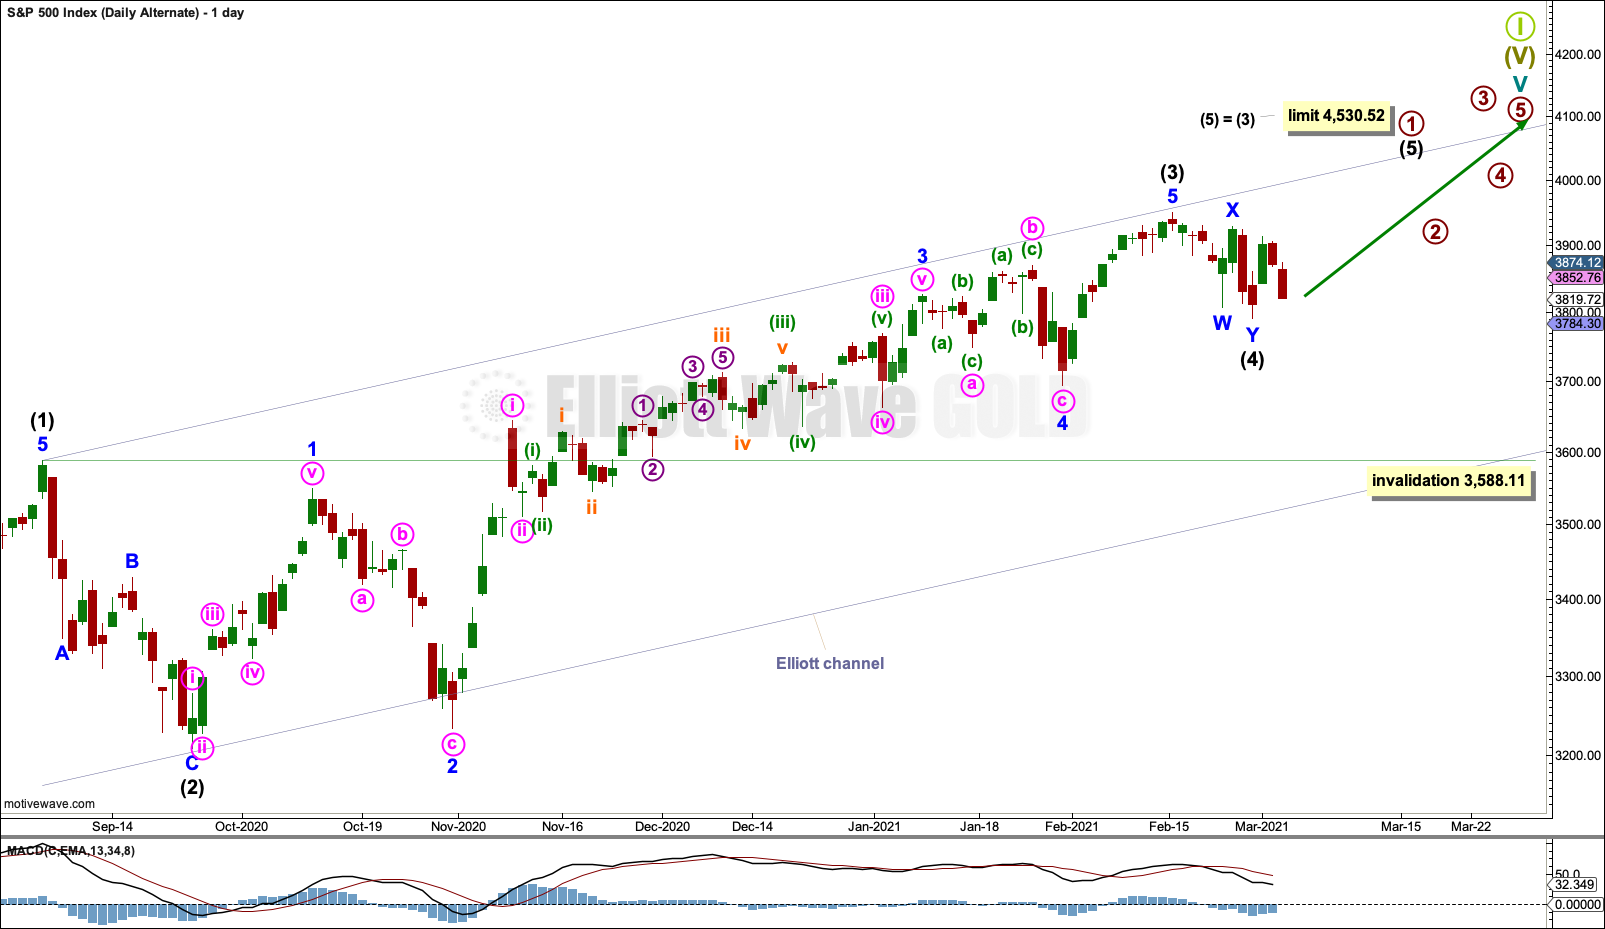
DAILY CHART
Click chart to enlarge.
Intermediate waves (1) through to (4) within primary wave 1 may be complete. If it continues lower, then intermediate wave (4) may not move into intermediate wave (1) price territory below 3,588.11.
TECHNICAL ANALYSIS
WEEKLY CHART
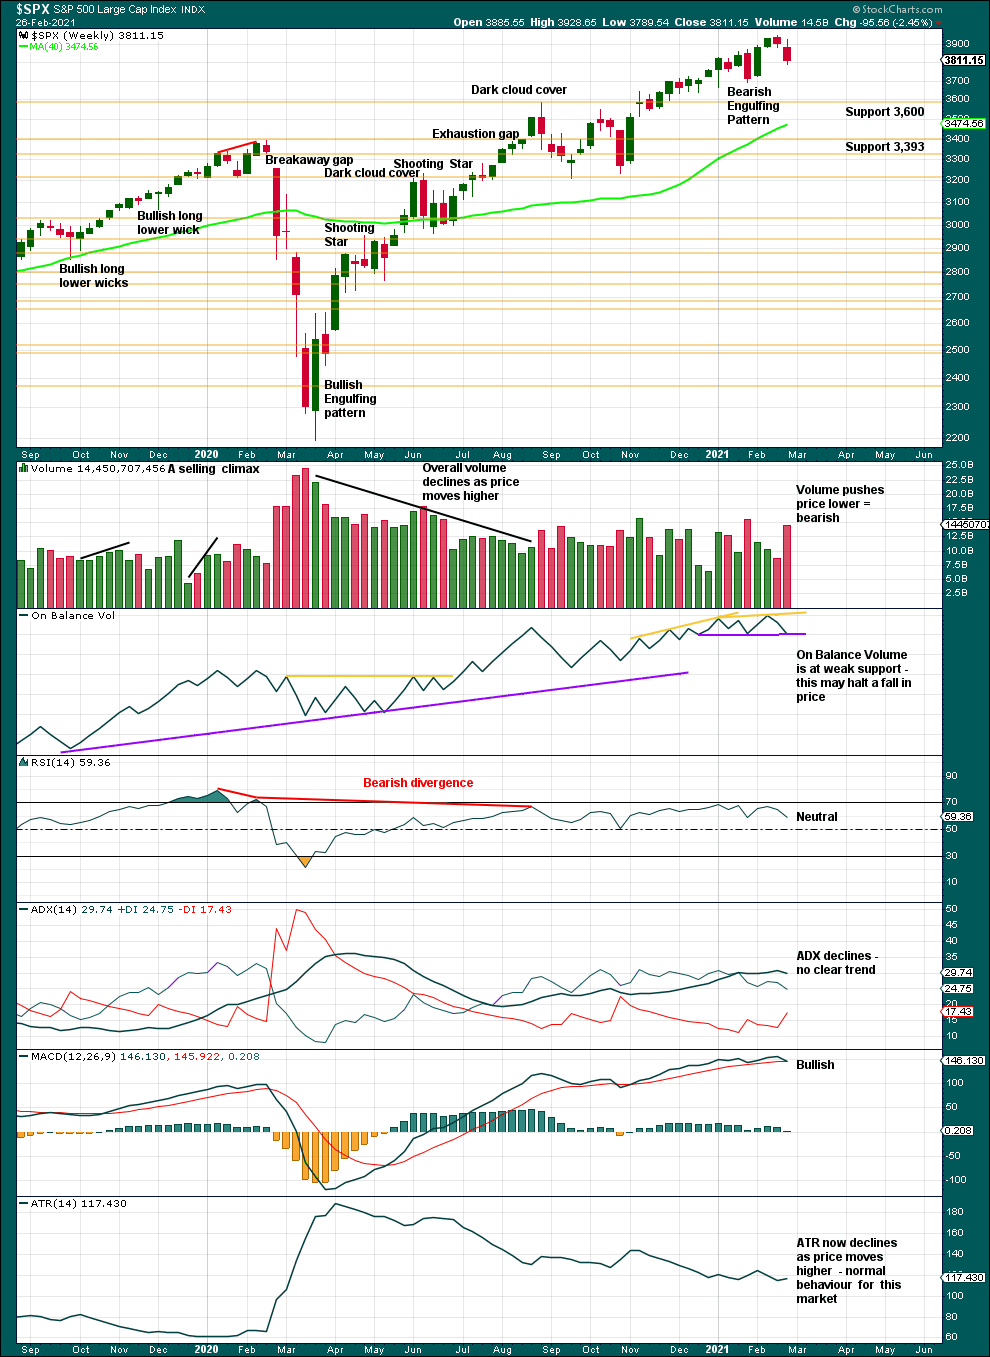
Click chart to enlarge. Chart courtesy of StockCharts.com.
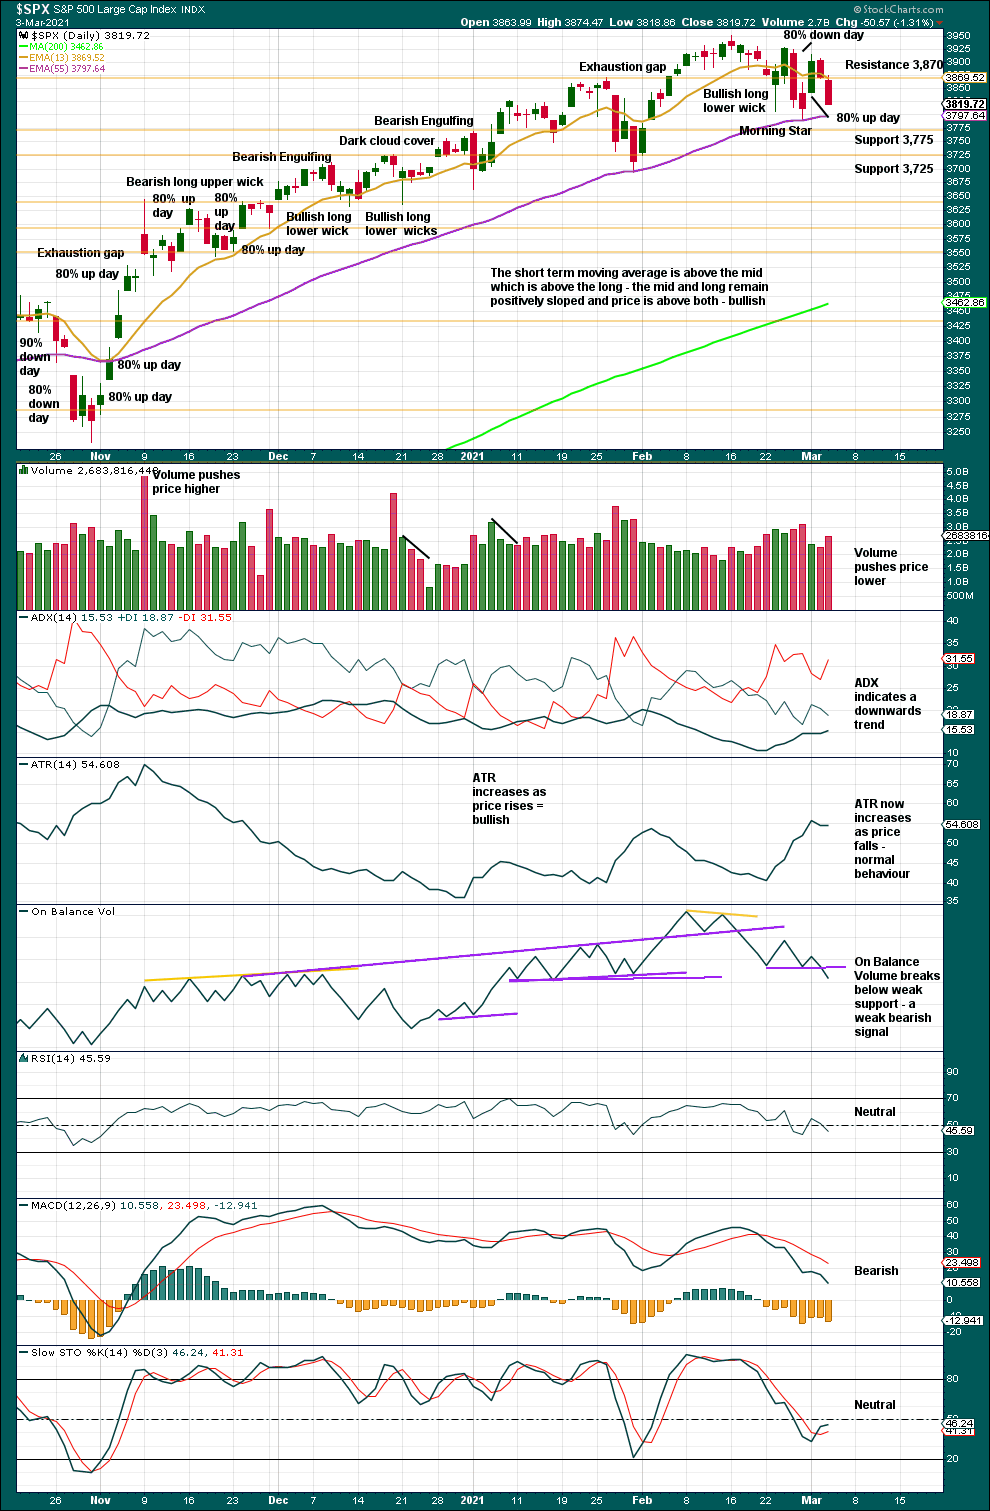
An increase in volume last week is bearish. But within this chart there are two examples of downwards weeks with strong volume occurring at the end of pullbacks: the week beginning October 26, 2020, and the week beginning January 25, 2021. An increase in volume for a downwards week last week does not necessarily mean price should continue lower this week.
ADX now declines last week; but if it turns back up, then an upwards trend would again be indicated.
Support for On Balance Volume is met, but it is weak.
DAILY CHART
Click chart to enlarge. Chart courtesy of StockCharts.com.
The series of higher highs and higher lows from the low of the 30th of October continues.
Next support is at 3,775. The last swing low on the 29th of January remains intact; while this has not been breached, an upwards trend may be assumed to remain in place as a series of higher highs and higher lows remains. Pullbacks are a normal part of an upwards trend.
One or more of the following may be seen in order to have confidence that this pullback is over:
– A 90% up day or two back to back 80% up days following within 4 sessions of a 90% down day or two back to back 80% down days.
– A bullish signal from On Balance Volume.
– A bullish signal from the AD line.
– A bullish candlestick reversal pattern that has support from volume.
The 1st of March was an 80% up day. Following the 80% down day on the 25th of February, this indicates a 180° reversal from down to up, although it is not as strong as a 90% up day or two back to back 80% up days. In conjunction with the Morning Star bullish candlestick pattern, this adds some confidence to the main hourly Elliott wave count.
Despite a strong red daily candlestick today, up volume slightly dominated at 52% of total up / down volume. This is bullish.
BREADTH – AD LINE
WEEKLY CHART
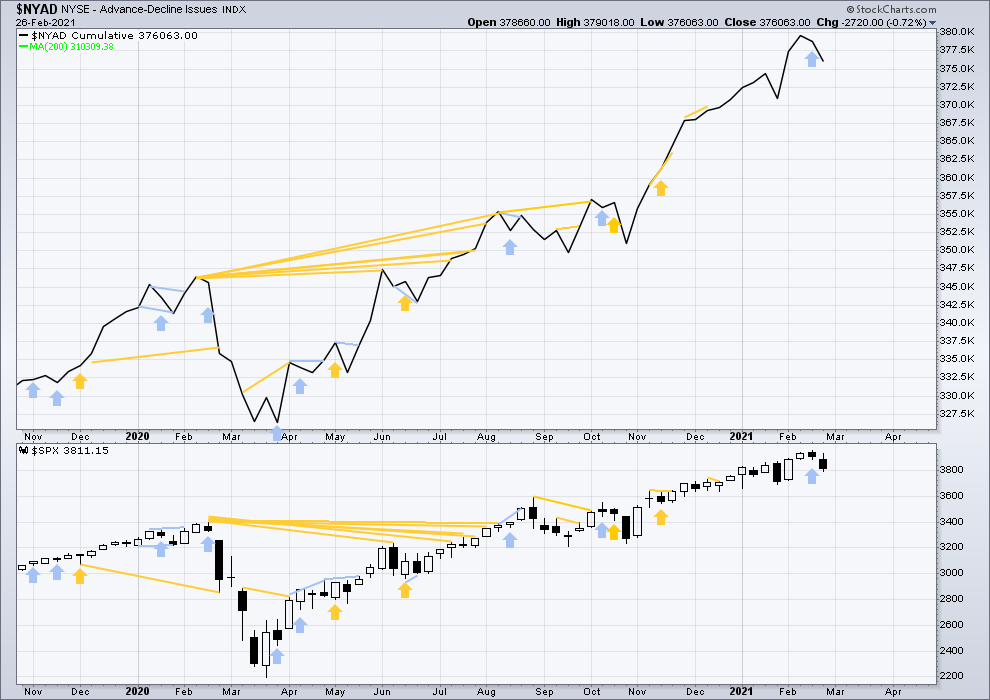
Click chart to enlarge. Chart courtesy of StockCharts.com. So that colour blind members are included, bearish signals will be noted with blue and bullish signals with yellow.
Breadth should be read as a leading indicator.
Lowry’s Operating Companies Only AD line has made a new all time high on the 12th of February. This is a strong bullish signal and supports the main Elliott wave count.
Large caps all time high: 3,950.43 on February 16, 2021.
Mid caps all time high: 2,581.02 on February 24, 2021.
Small caps all time high: 1,325.66 on February 24, 2021.
Last week both price and the AD line have moved lower. Neither have made new short-term swing lows. There is no new divergence.
DAILY CHART
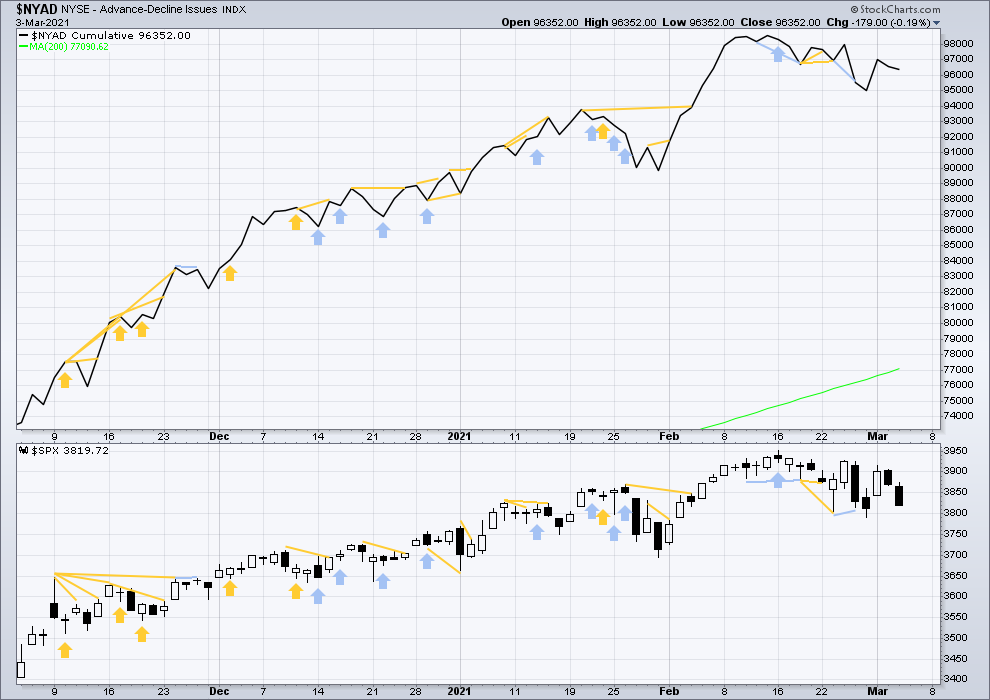
Click chart to enlarge. Chart courtesy of StockCharts.com. So that colour blind members are included, bearish signals will be noted with blue and bullish signals with yellow.
Again, both price and the AD line have moved lower. There is no new divergence.
VOLATILITY – INVERTED VIX CHART
WEEKLY CHART
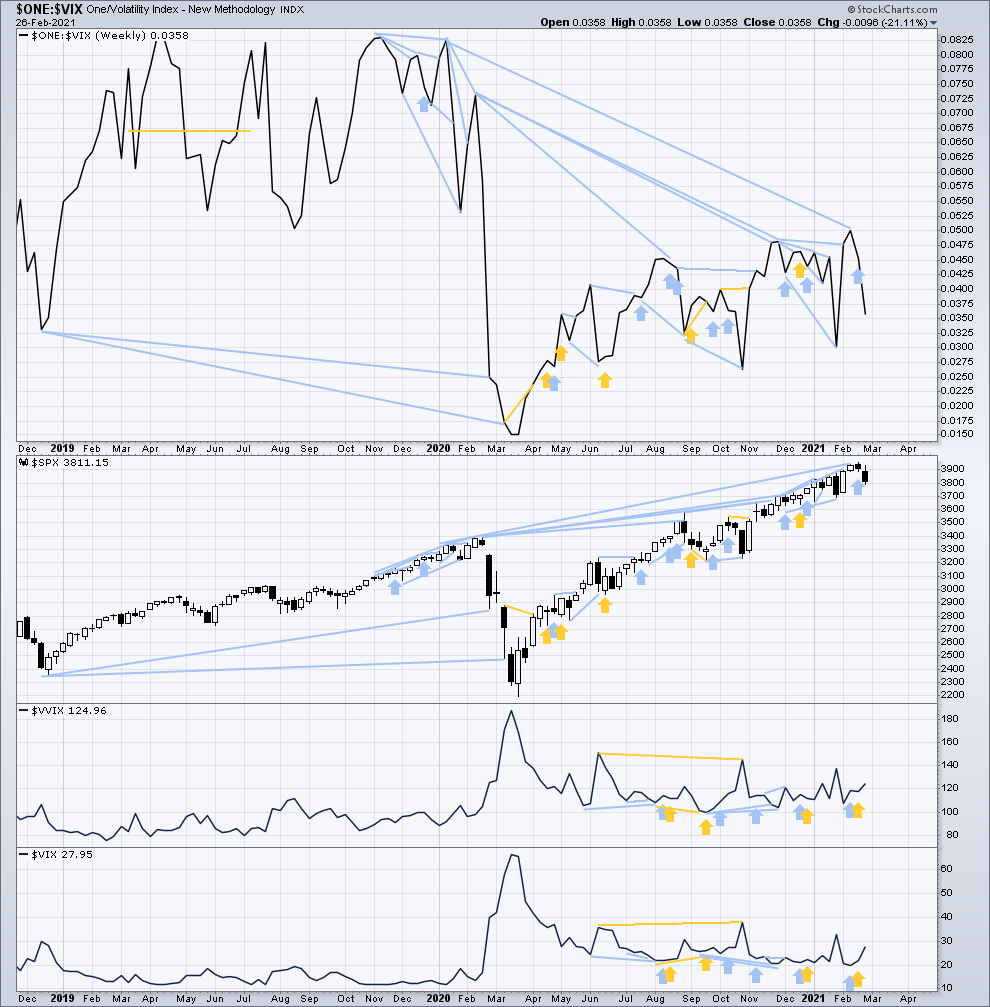
Click chart to enlarge. Chart courtesy of StockCharts.com. So that colour blind members are included, bearish signals will be noted with blue and bullish signals with yellow.
Inverted VIX remains well below all time highs. The all time high for inverted VIX was in the week beginning October 30, 2017. There is over 3 years of bearish divergence between price and inverted VIX. There is all of long, mid and short-term bearish divergence. This bearish divergence may develop further before the bull market ends. It may be a very early indicator of an upcoming bear market, but it is not proving to be useful in timing.
Last week both price and inverted VIX have moved lower. Neither have made new short-term swing lows. There is no new divergence.
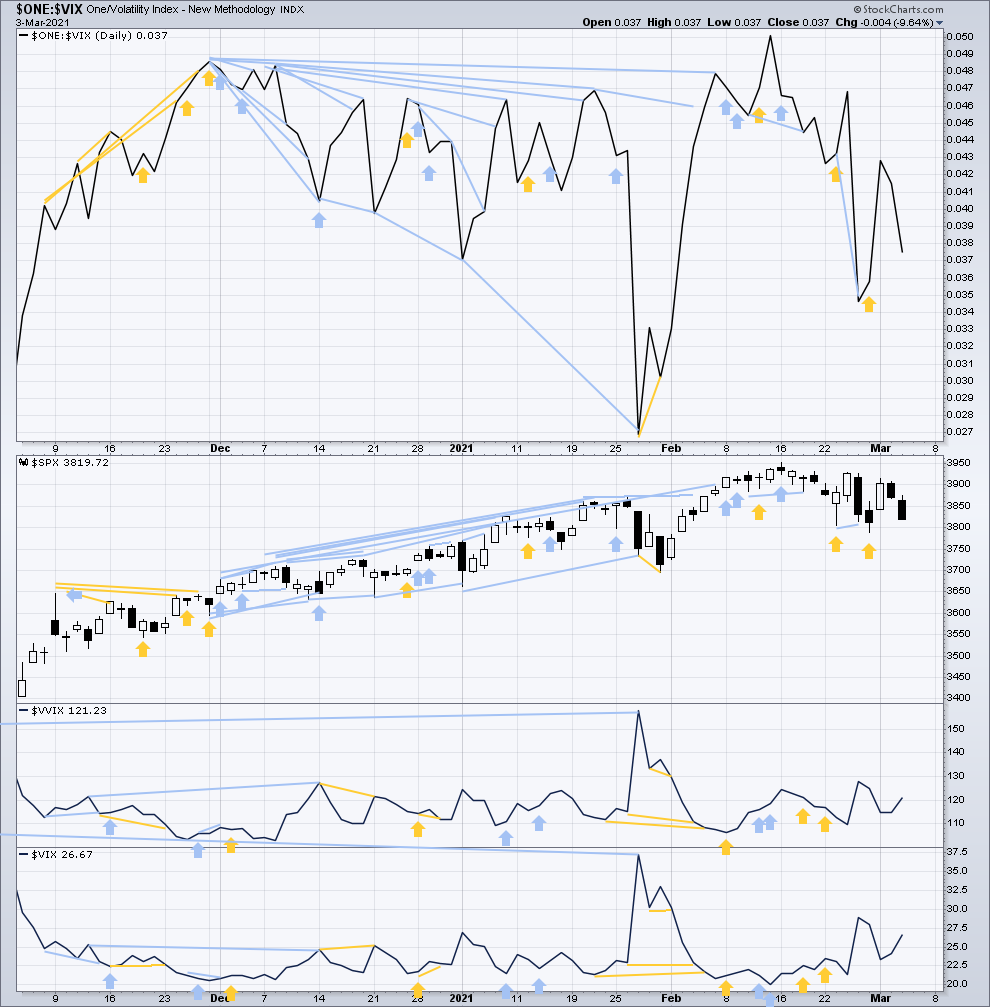
Comparing VIX and VVIX at the weekly chart level:
Short-term bearish divergence noted three weeks ago has now been followed by some downwards movement, so it may now be resolved. Last week both VIX and VVIX have moved higher. There is no new short-term divergence.
DAILY CHART
Click chart to enlarge. Chart courtesy of StockCharts.com. So that colour blind members are included, bearish signals will be noted with blue and bullish signals with yellow.
Again, both price and inverted VIX have moved lower. There is no new short-term divergence.
Comparing VIX and VVIX at the daily chart level:
VVIX has made a new high above the high of October 28, 2020, but VIX has not. This divergence remains bearish for the mid term. Today both VIX and VVIX have moved higher. There is no new divergence.
DOW THEORY
Dow Theory confirms a new bull market with new highs made on a closing basis:
DJIA: 29,568.57 – closed above on 16th November 2020.
DJT: 11,623.58 – closed above on 7th October 2020.
Adding in the S&P and Nasdaq for an extended Dow Theory, confirmation of a bull market would require new highs made on a closing basis:
S&P500: 3,393.52 – closed above on 21st August 2020.
Nasdaq: 9,838.37 – closed above on June 8, 2020.
The following major swing lows would need to be seen on a closing basis for Dow Theory to confirm a change from bull to a bear market:
DJIA: 18,213.65
DJT: 6,481.20
Adding in the S&P and Nasdaq for an extended Dow Theory, confirmation of a new bear market would require new lows on a closing basis:
S&P500: 2,191.86
Nasdaq: 6,631.42
Published @ 07:33 p.m. ET.
—
Careful risk management protects your trading account(s).
Follow my two Golden Rules:
1. Always trade with stops.
2. Risk only 1-5% of equity on any one trade.
—
New updates to this analysis are in bold.