
S&P 500: Elliott Wave and Technical Analysis | Charts – December 17, 2020
An upwards march continues towards targets on the Elliott wave count, which are calculated using Fibonacci ratios.
Summary: The wave count expects the low of the 30th of October to not be breached for many months or years. A new mid-term target is at 3,785. The next target is at 4,606. The invalidation point is at 3,691.08.
An alternate is considered at the daily chart level. It is judged to have a very low probability. For confidence it requires a new low below 3,691.08 and then below 3,549.85.
The biggest picture, Grand Super Cycle analysis, is here.
Monthly charts are last updated here with video here.
ELLIOTT WAVE COUNT
WEEKLY CHART
Click chart to enlarge.
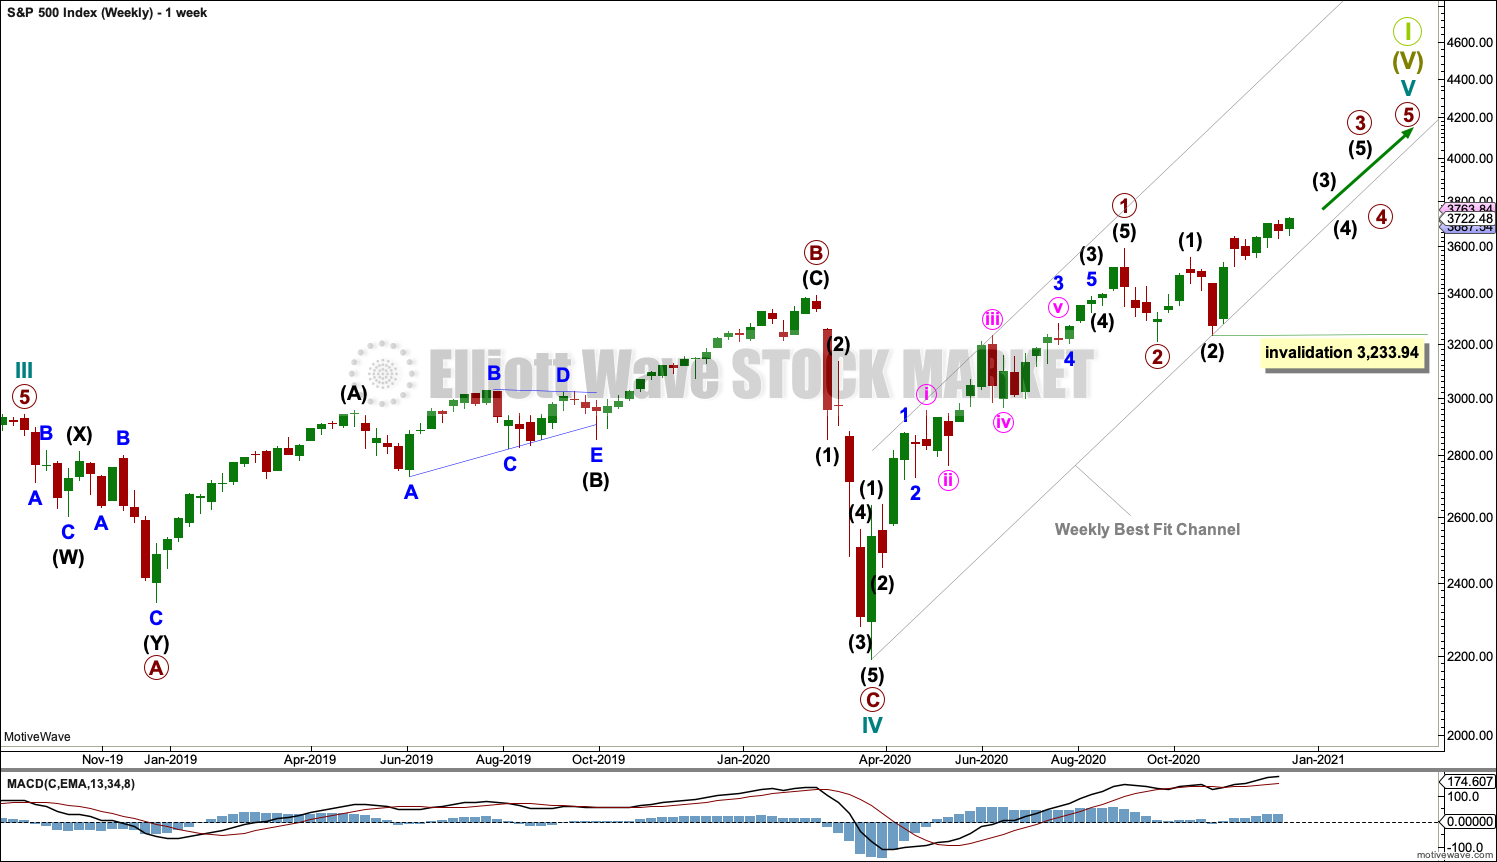
Cycle wave V may last from one to several years. So far it is in its ninth month.
This wave count may allow time for the AD line to diverge from price as price makes final highs before the end of the bull market. The AD line most commonly diverges a minimum of 4 months prior to the end of a bull market.
Cycle wave V would most likely subdivide as an impulse. But if overlapping develops, then an ending diagonal should be considered. This chart considers the more common impulse.
Primary waves 1 and 2 may be complete.
Primary wave 3 may only subdivide as an impulse.
There is already a Fibonacci ratio between cycle waves I and III within Super Cycle wave (V). The S&P500 often exhibits a Fibonacci ratio between two of its actionary waves but rarely between all three; it is less likely that cycle wave V would exhibit a Fibonacci ratio. The target for Super Cycle wave (V) to end would best be calculated at primary degree, but that cannot be done until all of primary waves 1, 2, 3 and 4 are complete.
DAILY CHART
Click chart to enlarge.
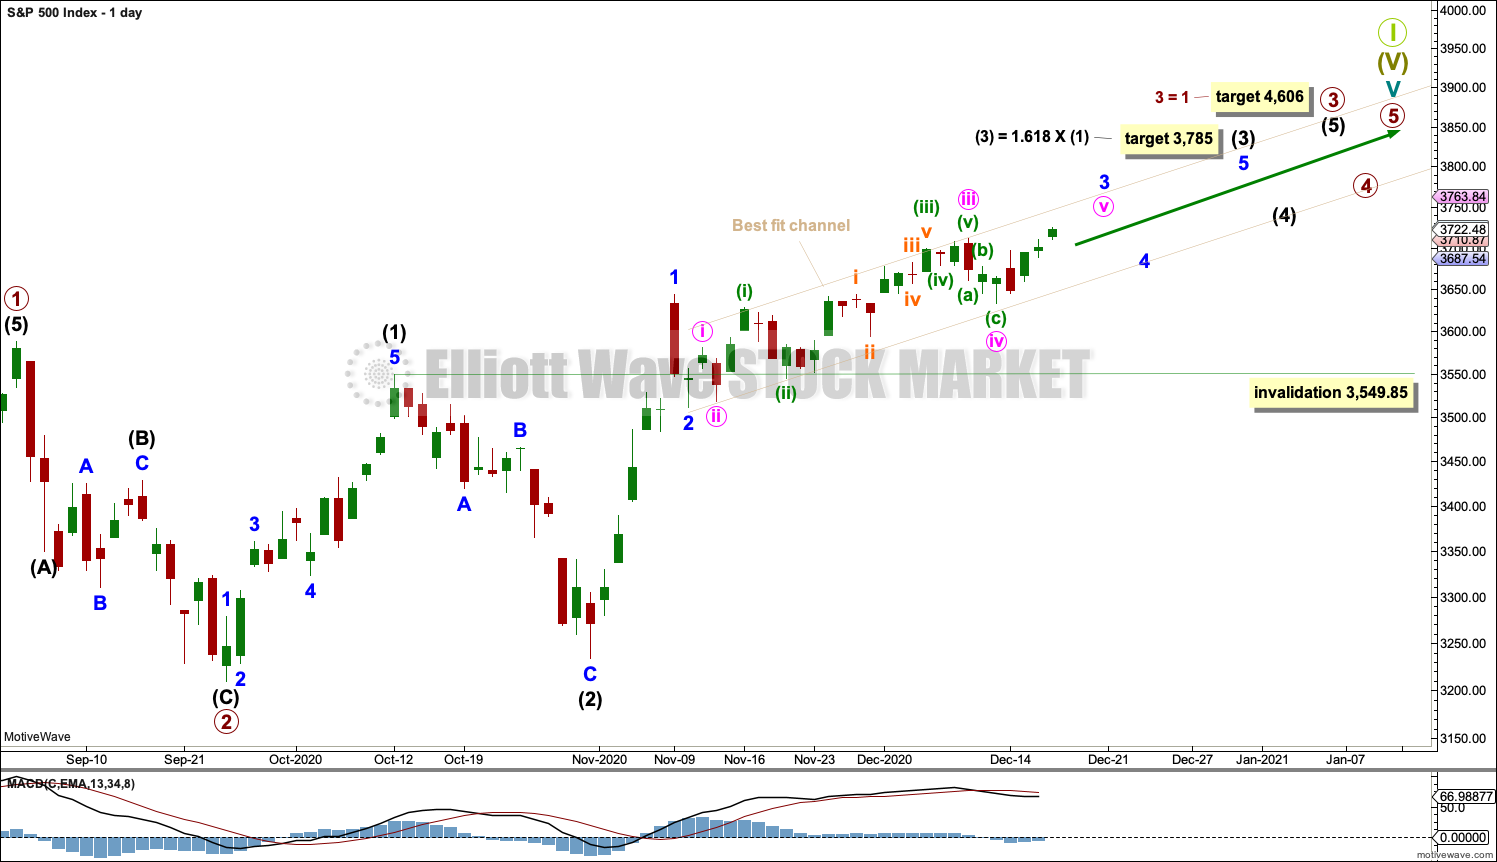
Primary waves 1 and 2 may both be complete. Primary wave 3 may be underway.
Primary wave 3 may only subdivide as an impulse. Within primary wave 3: Intermediate waves (1) and (2) may both be complete, and intermediate wave (3) may be underway and may only subdivide as an impulse. A target is calculated for intermediate wave (3).
Intermediate wave (4) may not move into intermediate wave (1) price territory below 3,549.85.
Primary wave 1 looks extended. The target for primary wave 3 expects it to also be extended.
This wave count now expects that a third wave at three large degrees (minor, intermediate and primary) may have passed through its middle portion. Each successive fourth wave correction must remain above its corresponding first wave price territory.
When third waves extend they do so in price as well as time. Extended waves usually exhibit corrections within them that are more time consuming than those within waves that are not extended.
The best fit channel has provided support for downwards movement. It may now provide resistance to upwards movement, so it may be useful to show where the next pullback may arrive.
HOURLY CHART
Click chart to enlarge.
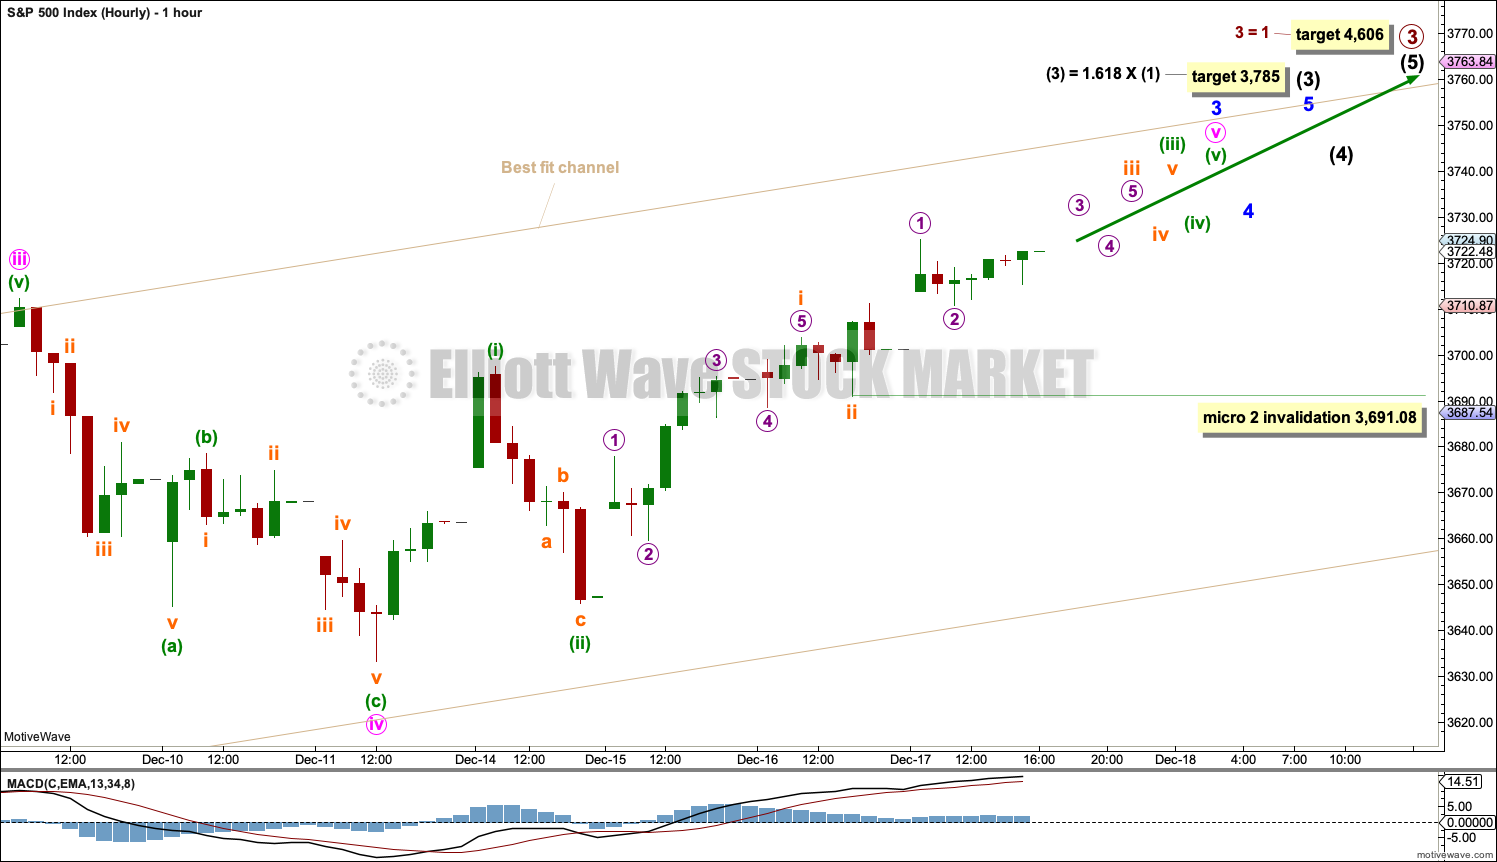
If minute wave iii is complete, then it would be 12.51 points longer than 2.618 the length of minute wave i.
It is possible to see minute wave iii over and the last pullback as minute wave iv.
Minute wave v may only subdivide as a five wave motive structure, most likely an impulse.
Minuette waves (i) and (ii) within minute wave v may be compete. Minuette wave (iii) may have begun and may only subdivide as an impulse.
Subminuette waves i and ii within the impulse of minuette wave (iii) may now be over. Micro wave 2 within the impulse of subminuette wave iii may not move beyond the start of micro wave 1 below 3,691.08.
ALTERNATE HOURLY CHART
Click chart to enlarge.
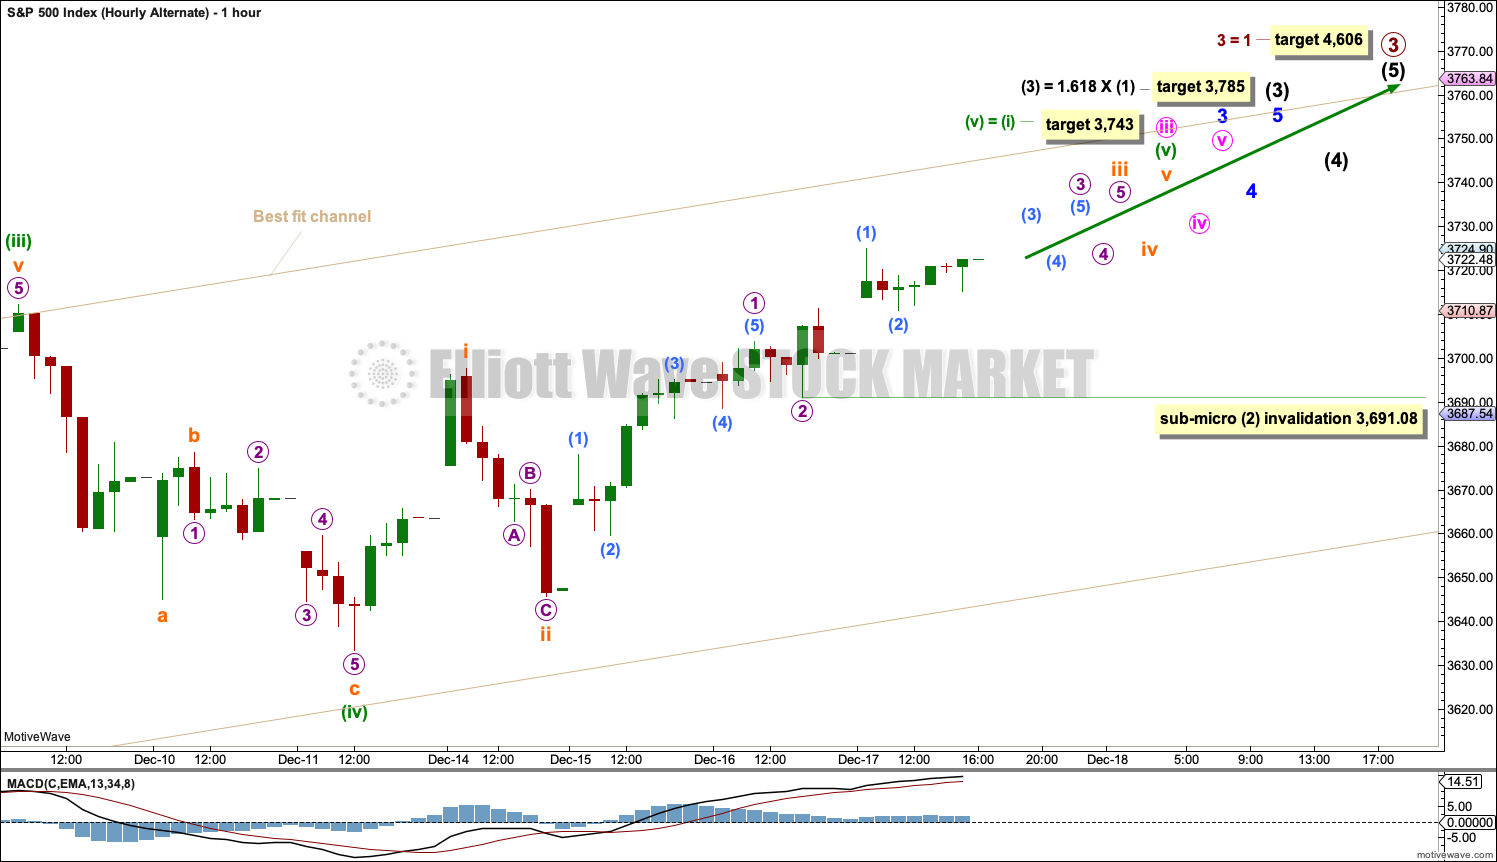
The last pullback may be minuette wave (iv), which may have ended just above minuette wave (i) price territory.
If minuette wave (iii) is over at the last high, then it would be 9.31 points short of 1.618 times the length of minuette wave (i).
Minuette wave (v) may only subdivide as a five wave motive structure, most likely an impulse.
Subminuette waves i and ii within minuette wave (v) may be complete. Subminuette wave iii may only subdivide as an impulse. Micro waves 1 and 2 within subminuette wave iii may be complete. Sub-micro wave (2) within the impulse of micro wave 3 may not move beyond the start of sub-micro wave (1) below 3,691.08.
A target is calculated for minuette wave (v) that expects the most common Fibonacci ratio to minuette wave (i).
ALTERNATE DAILY CHART
Click chart to enlarge.
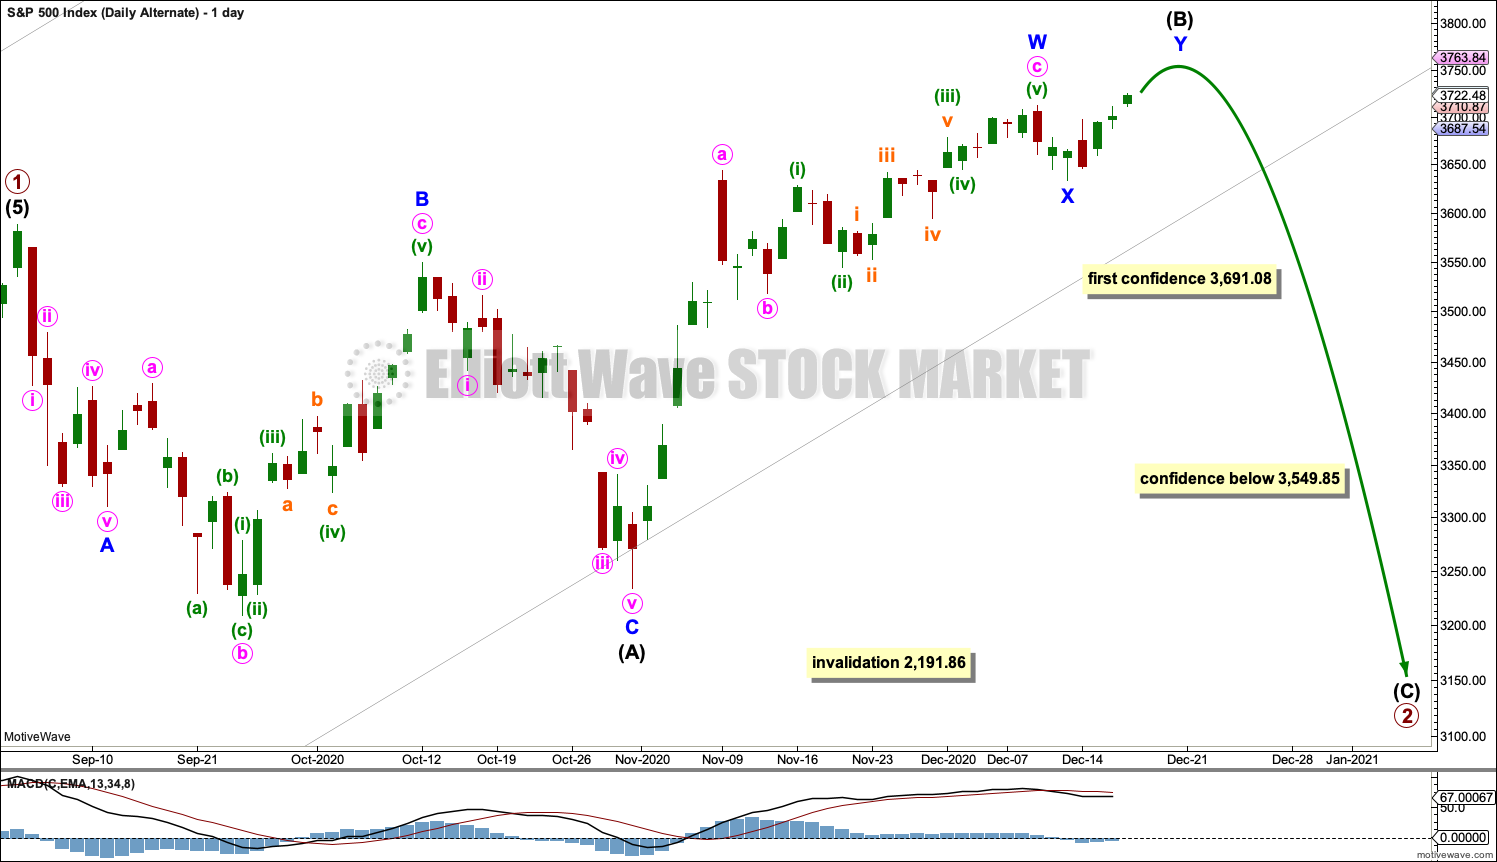
In the interest of always trying to consider all possibilities (so as to not be left without a potential pathway should the main wave count become invalidated) this alternate is considered.
This alternate wave count does not have support from classic technical analysis at this time, so it is judged to have a low probability. However, low probability does not mean no probability. Confidence / invalidation points may be used to judge any change in probability between the two wave counts. The first confidence point is changed to match the new short-term labelling on the main hourly chart.
It is possible that primary wave 2 may be an incomplete expanded flat correction.
Intermediate wave (B) may be continuing higher as a double zigzag.
There is no rule for flat corrections that state a limit for B waves, so it is possible that intermediate wave (B) may extend higher as a double zigzag. If intermediate wave (B) were to reach twice the length of intermediate wave (A) at 3,942.28, then the idea of a flat correction should be discarded based upon a very low probability.
TECHNICAL ANALYSIS
WEEKLY CHART
Click chart to enlarge. Chart courtesy of StockCharts.com.
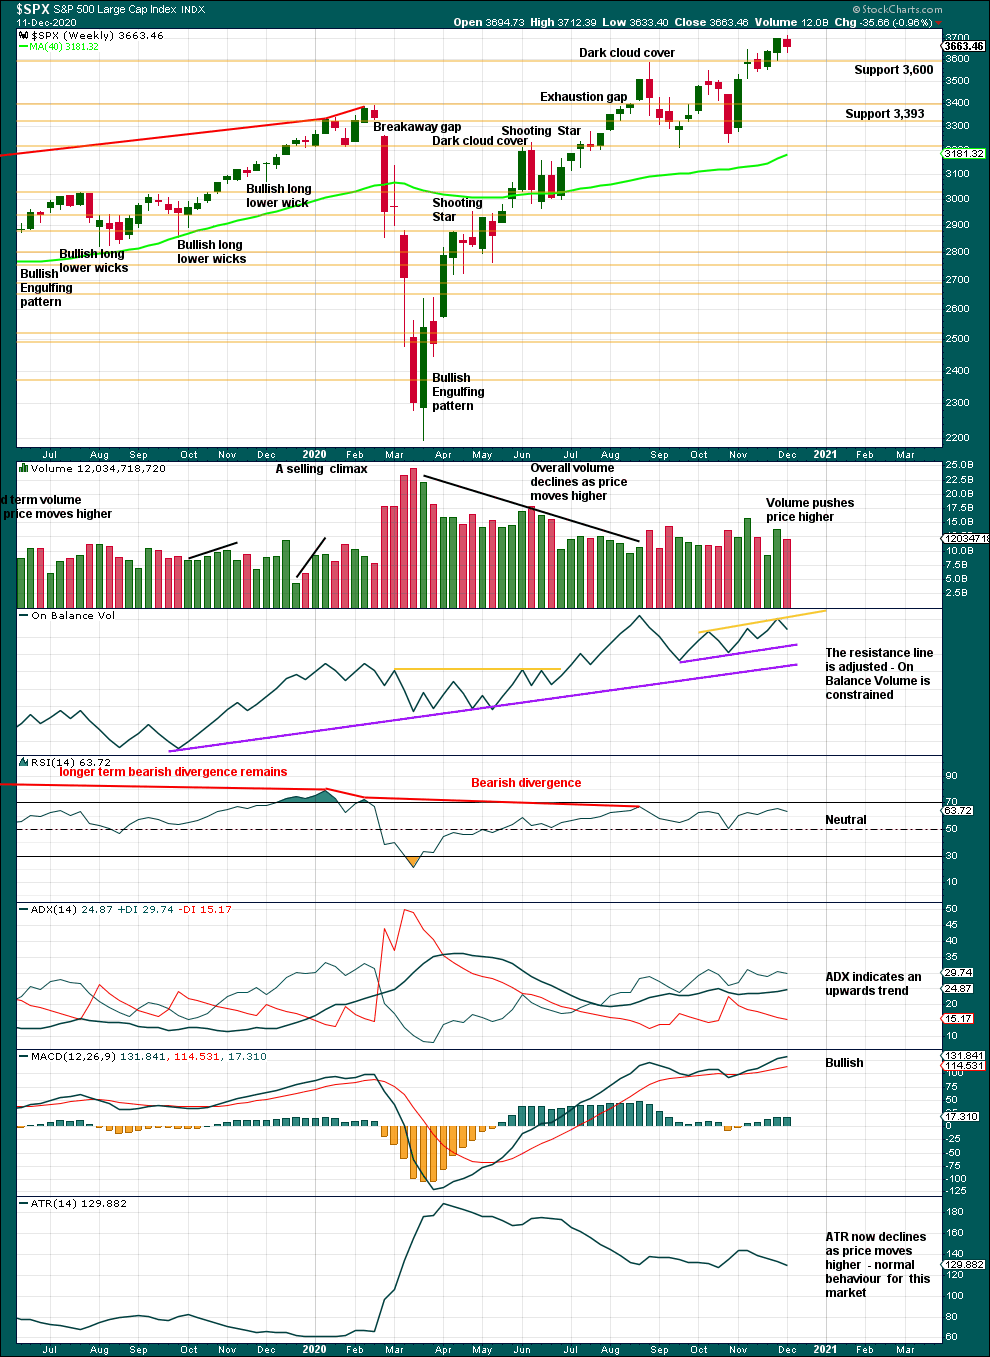
This chart is bullish and still supports the main Elliott wave count. All of volume, ADX and MACD are bullish. There is no bearish candlestick reversal pattern. Conditions are not extreme. There is room for this upwards trend to continue.
DAILY CHART
Click chart to enlarge. Chart courtesy of StockCharts.com.
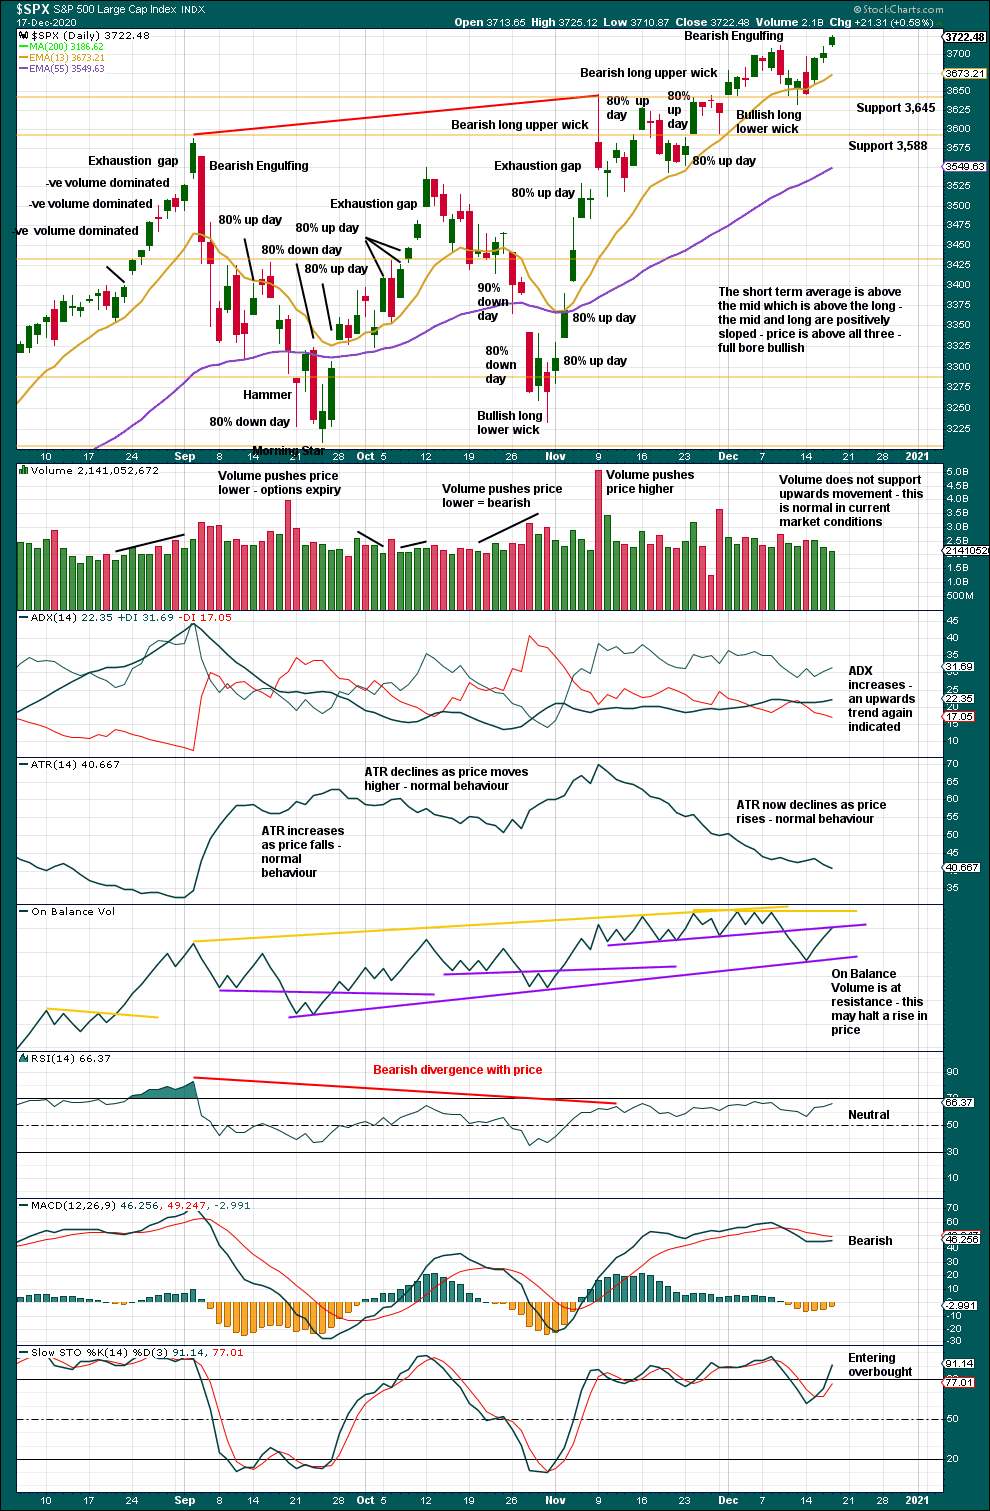
Overall, this chart is bullish and still supports the Elliott wave count. There is a series of higher highs and lower lows from the low on the 24th of September.
Neither ADX nor RSI are yet extreme. There is room for an upwards trend to continue.
The last small pullback looks like it may have been a typical back test of support after a break of resistance. It may now be over. On Balance Volume supports this view.
On Balance Volume is at resistance, but resistance is weak.
BREADTH – AD LINE
WEEKLY CHART
Click chart to enlarge. Chart courtesy of StockCharts.com. So that colour blind members are included, bearish signals will be noted with blue and bullish signals with yellow.
Breadth should be read as a leading indicator.
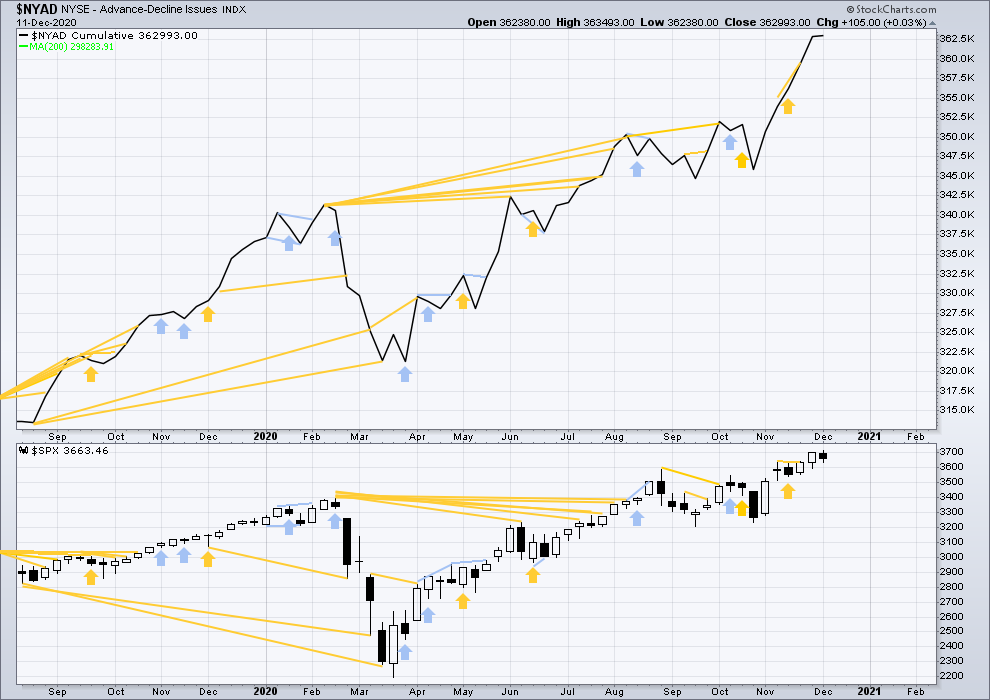
Lowry’s Operating Companies Only AD line has made a new all time high on the 10th of December. This is a strong bullish signal and supports the main Elliott wave count.
Large caps all time high: 3,725.12 on December 17, 2020.
Mid caps all time high: 2,297.99 on December 17, 2020.
Small caps all time high: 1,116.86 on December 17, 2020.
Last week both price and the AD line have made new all time highs. Upwards movement has support from rising market breadth. This is bullish and supports the main daily Elliott wave count.
DAILY CHART
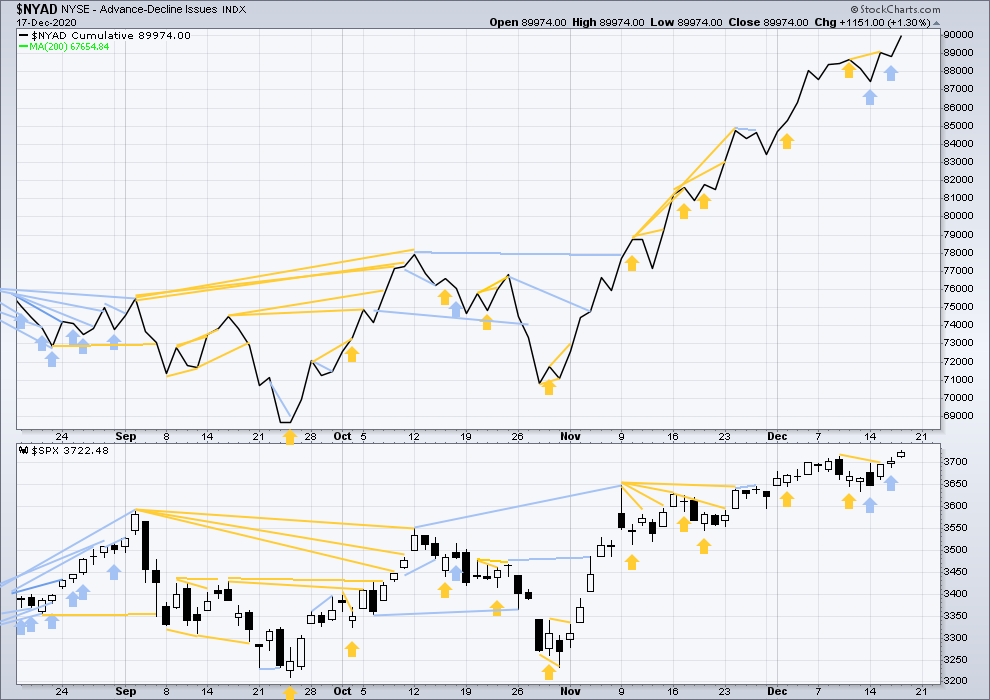
Click chart to enlarge. Chart courtesy of StockCharts.com. So that colour blind members are included, bearish signals will be noted with blue and bullish signals with yellow.
Short-term bearish divergence noted yesterday has not been followed by any downwards movement, so it is considered to have failed.
Today both price and the AD line have made new all time highs. Upwards movement has support from rising market breadth. This is bullish.
VOLATILITY – INVERTED VIX CHART
WEEKLY CHART
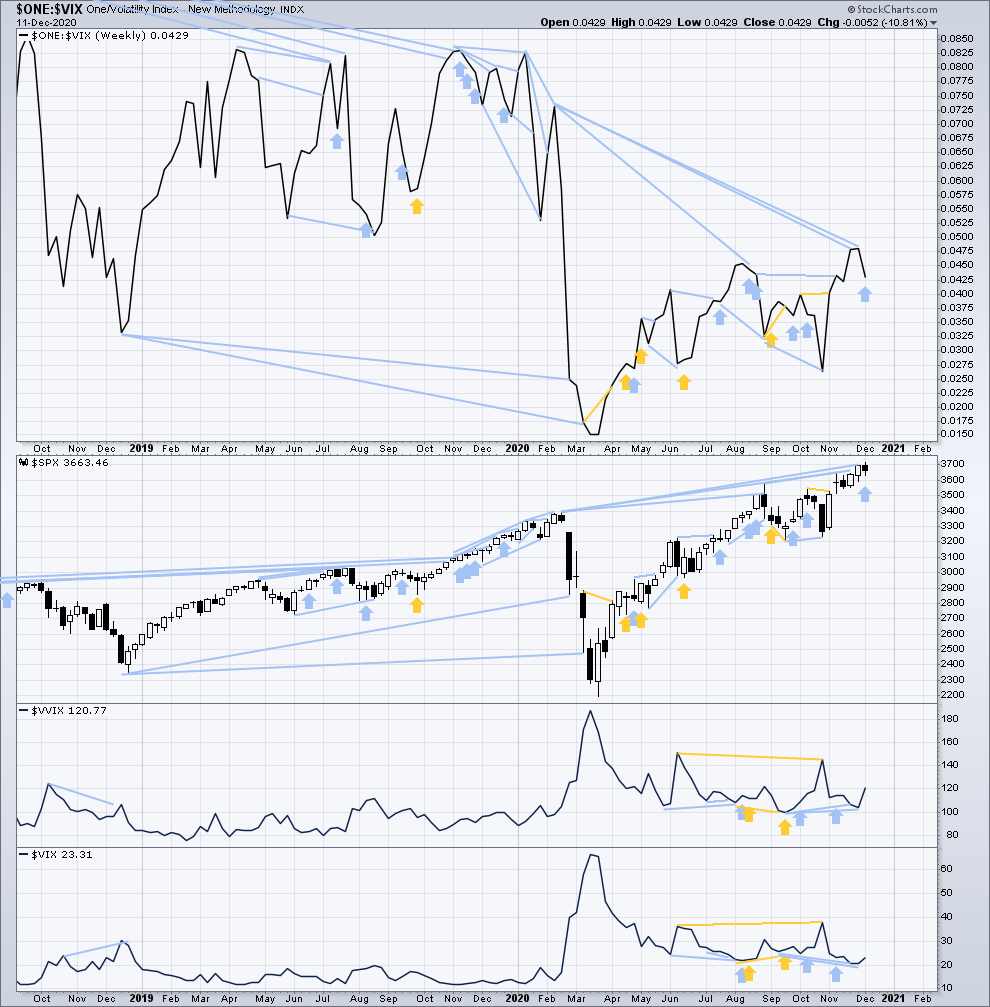
Click chart to enlarge. Chart courtesy of StockCharts.com. So that colour blind members are included, bearish signals will be noted with blue and bullish signals with yellow.
Inverted VIX remains well below all time highs. The all time high for inverted VIX was in the week beginning October 30, 2017. There is over 3 years of bearish divergence between price and inverted VIX. There is all of long, mid and short-term bearish divergence. This bearish divergence may develop further before the bull market ends. It may be a very early indicator of an upcoming bear market, but it is not proving to be useful in timing.
Last week price has moved a little higher although the candlestick has closed red, but inverted VIX has moved lower. This divergence is bearish for the short term.
Comparing VIX and VVIX: Last week VVIX has made a new short-term swing high above the prior high of the week beginning 16th November, but VIX has not. VVIX is increasing faster than VIX. This divergence is bearish for price and supports the alternate daily Elliott wave count.
DAILY CHART
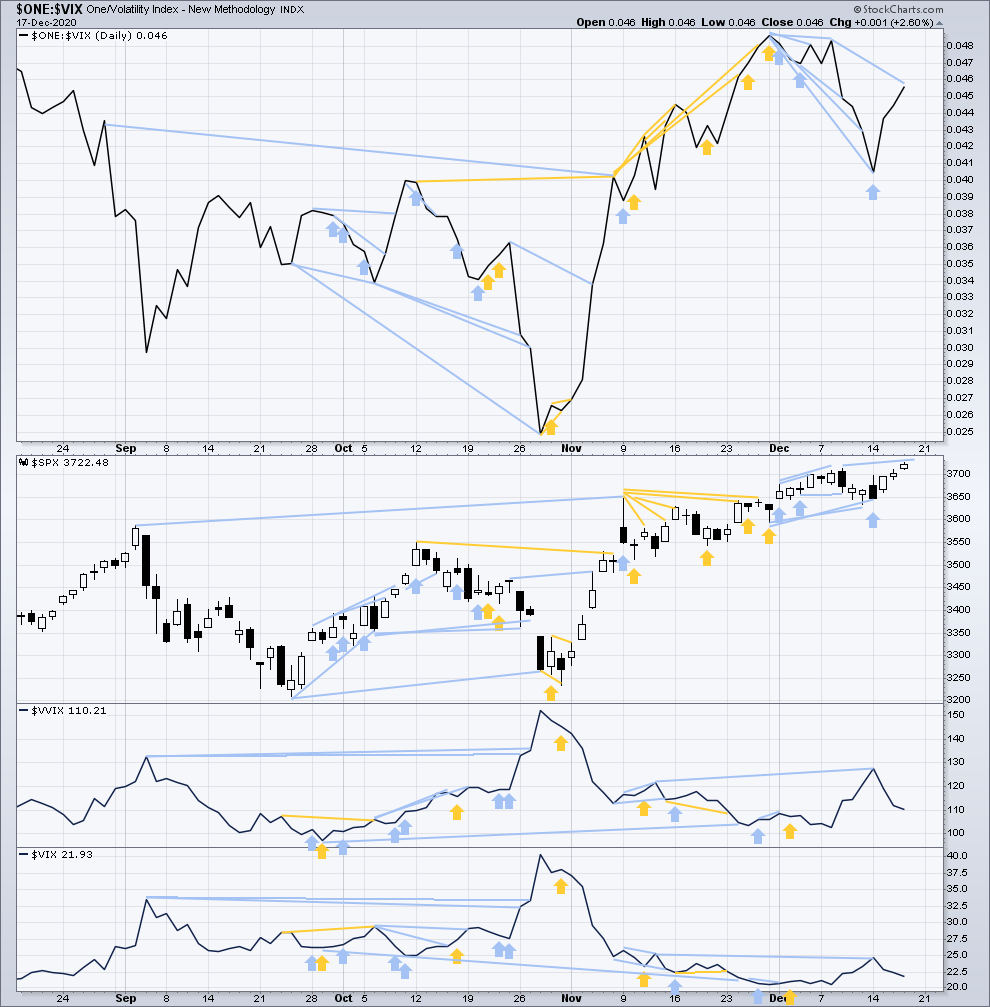
Click chart to enlarge. Chart courtesy of StockCharts.com. So that colour blind members are included, bearish signals will be noted with blue and bullish signals with yellow.
Today price has made a new all time high, but inverted VIX has not. There is all of short, mid and long-term bearish divergence.
Comparing VIX and VVIX at the daily chart level:VVIX has made a new high above the prior high of the 12th of November, but VIX has not. This divergence is bearish for the short to mid term and may offer some support to the alternate daily Elliott wave count. Today both VIX and VVIX have moved lower. There is no new divergence.
DOW THEORY
Dow Theory confirms a new bull market with new highs made on a closing basis:
DJIA: 29,568.57 – closed above on 16th November 2020.
DJT: 11,623.58 – closed above on 7th October 2020.
Adding in the S&P and Nasdaq for an extended Dow Theory, confirmation of a bull market would require new highs made on a closing basis:
S&P500: 3,393.52 – closed above on 21st August 2020.
Nasdaq: 9,838.37 – closed above on June 8, 2020.
Published @ 06:21 p.m. ET.
—
Careful risk management protects your trading account(s).
Follow my two Golden Rules:
1. Always trade with stops.
2. Risk only 1-5% of equity on any one trade.
—
New updates to this analysis are in bold.