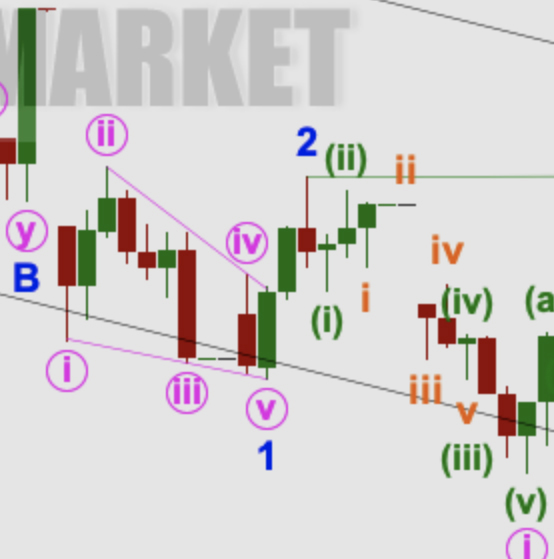
by Lara | Oct 27, 2020 | S&P 500, S&P 500 + DJIA
S&P 500: Elliott Wave and Technical Analysis | Charts – October 27, 2020 An inside day closes red, with the balance of volume downwards. This suggests a lack of buying pressure at this time. A new short-term Elliott wave count is published. Summary: For the short...

by Lara | Oct 26, 2020 | S&P 500, S&P 500 + DJIA
S&P 500: Elliott Wave and Technical Analysis | Charts – October 26, 2020 Downwards movement was not expected by the main Elliott wave count, but it was for an alternate. Price remains above the invalidation point for the main Elliott wave count, so both counts...
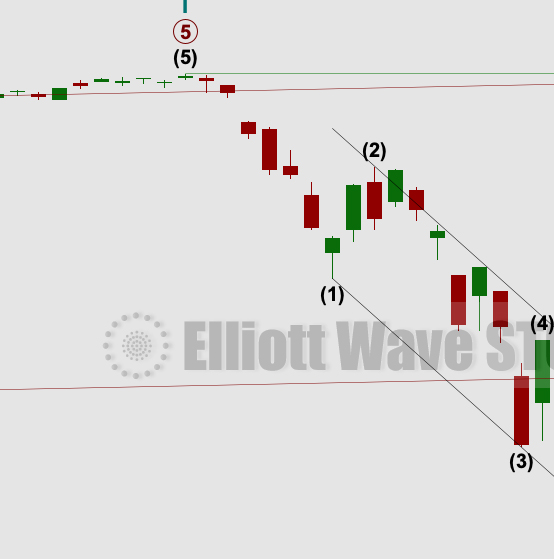
by Lara | Oct 23, 2020 | S&P 500, S&P 500 + DJIA
S&P 500: Elliott Wave and Technical Analysis | Charts – October 23, 2020 Upwards movement was expected for Friday’s session. A higher high and a higher low fits this expectation. Summary: The invalidation point is moved up to 3,209.45. The upwards trend may...

by Lara | Oct 22, 2020 | S&P 500, S&P 500 + DJIA
S&P 500: Elliott Wave and Technical Analysis | Charts – October 22, 2020 For the very short term, a little more downwards movement to a target at 3,418 was expected before a reversal and upwards movement. Today the session began with downwards movement to a low...
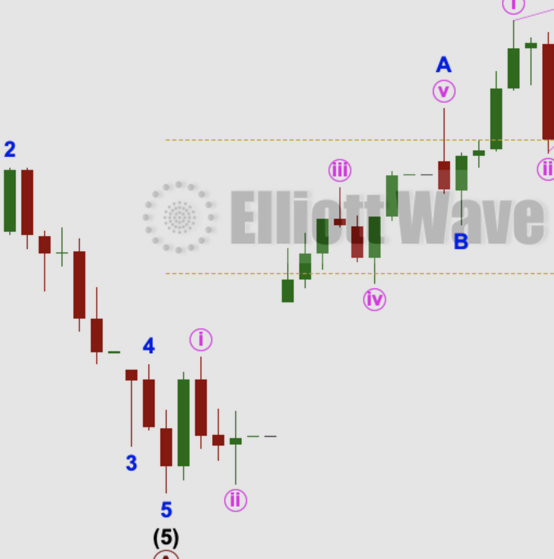
by Lara | Oct 21, 2020 | S&P 500, S&P 500 + DJIA
S&P 500: Elliott Wave and Technical Analysis | Charts – October 21, 2020 Another very small range day sees price move sideways. All three daily Elliott wave counts remain valid. Summary: The invalidation point is moved up to 3,209.45. For the very short term, a...
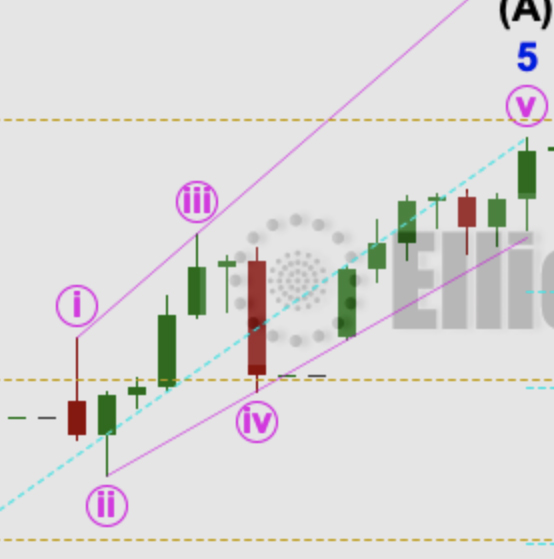
by Lara | Oct 20, 2020 | S&P 500, S&P 500 + DJIA
S&P 500: Elliott Wave and Technical Analysis | Charts – October 20, 2020 An inside day leaves all three daily Elliott wave counts the same. Summary: The invalidation point is moved up to 3,209.45. For the very short term, a very little more downwards movement may...

by Lara | Oct 19, 2020 | S&P 500, S&P 500 + DJIA
S&P 500: Elliott Wave and Technical Analysis | Charts – October 19, 2020 Downwards movement to a short-term target at 3,418 was expected for the start of the new trading week. A strong downwards session reached 3,419.93, just 1.93 points short of the target....

by Lara | Oct 16, 2020 | S&P 500, S&P 500 + DJIA
S&P 500: Elliott Wave and Technical Analysis | Charts – October 16, 2020 An upwards week closes as a red doji candlestick. The short-term invalidation point is moved higher this week. Summary: The invalidation point is moved up to 3,209.45. For the very short...

by Lara | Oct 15, 2020 | S&P 500, S&P 500 + DJIA
S&P 500: Elliott Wave and Technical Analysis | Charts – October 15, 2020 Three new short-term Elliott wave counts are considered today. Summary: The invalidation point is moved up to 3,209.45. The hourly chart expects a little more downwards movement to about...


